Banking Conditions Survey

For this survey, Eleventh District banking executives were asked supplemental questions on credit standards and loan demand. Read the special questions results.
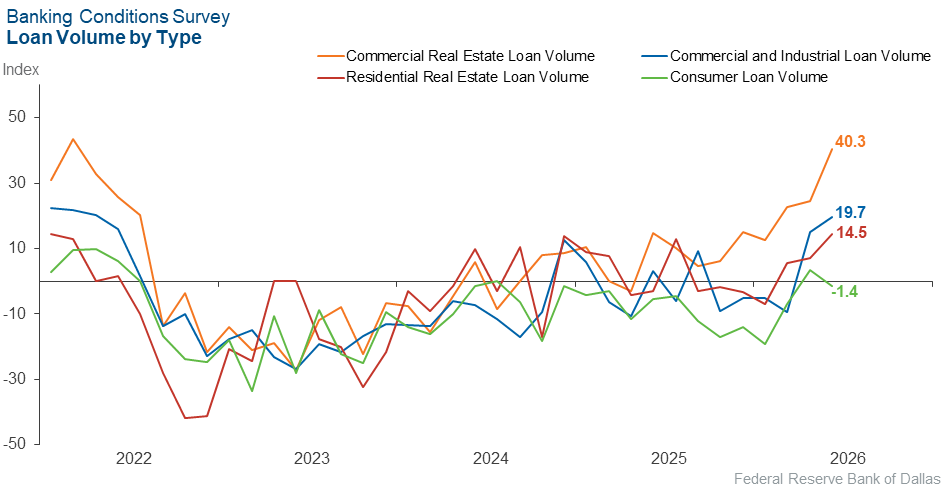
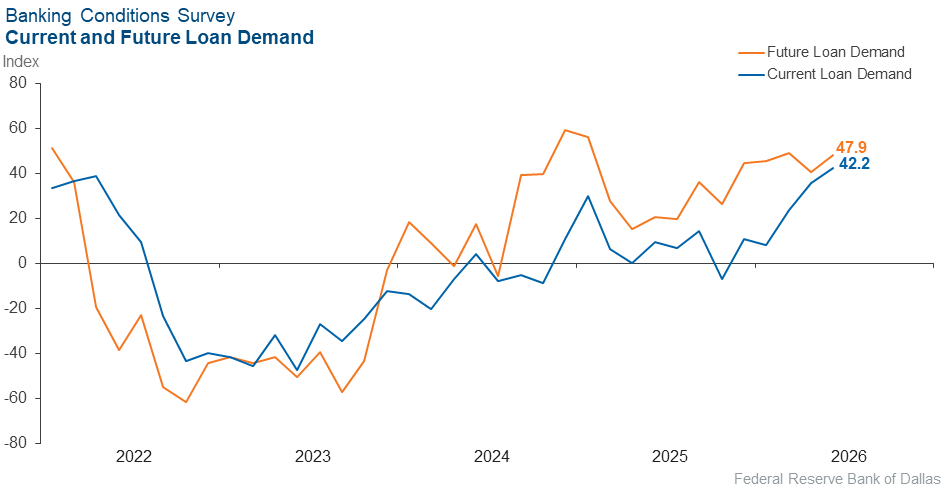
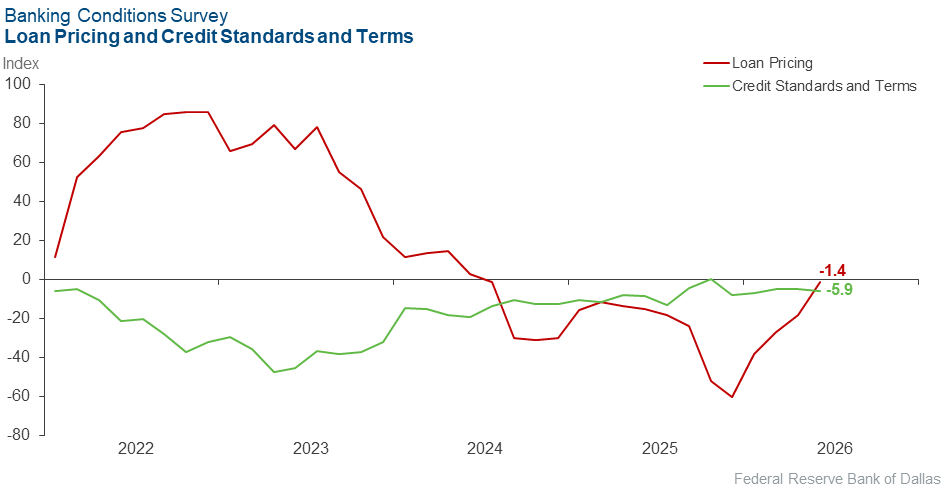
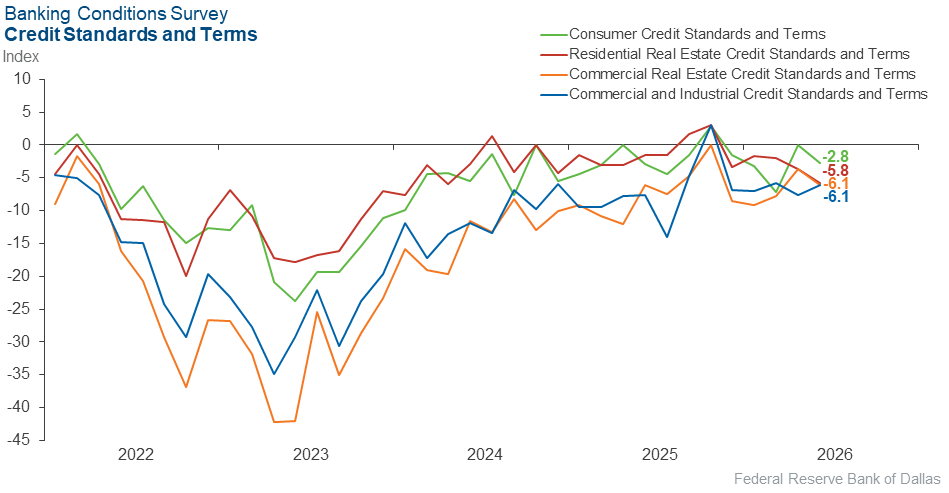
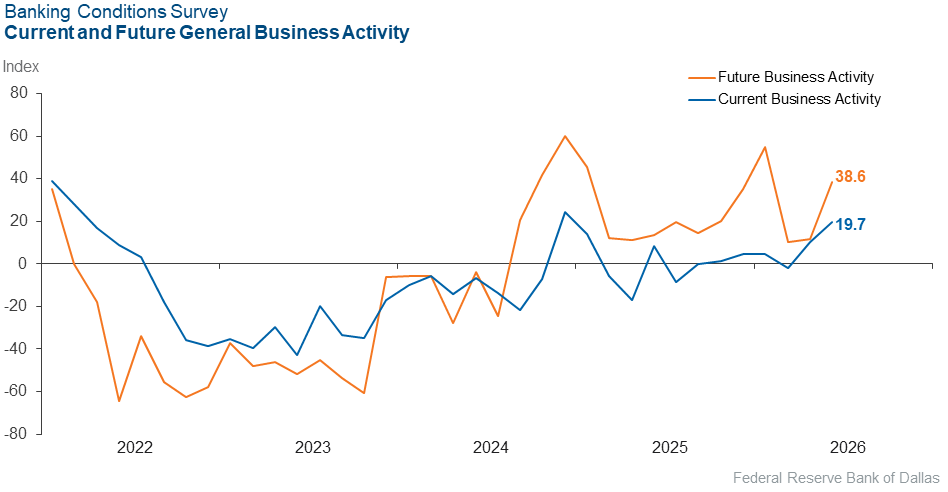
Loan volume and demand grew notably in June. Volume rose across all loan types except for consumer loan volume which was stable. Credit standards and terms tightened, but loan pricing held steady. Overall loan performance remained the same. Bankers reported expanding general business activity and are more optimistic about the future. Survey respondents expect strong growth in loan demand and business activity with a very slight deterioration in loan performance six months from now.
Next release: August 17, 2026
Data were collected June 16–24, and 72 financial institutions responded to the survey. The Federal Reserve Bank of Dallas conducts the Banking Conditions Survey twice each quarter to obtain a timely assessment of activity at banks and credit unions headquartered in the Eleventh Federal Reserve District. CEOs or senior loan officers of financial institutions report on how conditions have changed for indicators such as loan volume, nonperforming loans and loan pricing. Respondents are also asked to report on their banking outlook and their evaluation of general business activity.
Survey responses are used to calculate an index for each indicator. Each index is calculated by subtracting the percentage of respondents reporting a decrease (or tightening) from the percentage reporting an increase (or easing). When the share of respondents reporting an increase exceeds the share reporting a decrease, the index will be greater than zero, suggesting the indicator has increased over the prior reporting period. If the share of respondents reporting a decrease exceeds the share reporting an increase, the index will be below zero, suggesting the indicator has decreased over the prior reporting period. An index will be zero when the number of respondents reporting an increase is equal to the number reporting a decrease.
Results summary
Historical data are available from March 2017.
| Total Loans: Over the past six weeks, how have the following changed? | |||||
| Indicator | Current Index | Previous Index | % Reporting Increase | % Reporting No Change | % Reporting Decrease |
Loan volume | 41.7 | 35.6 | 55.6 | 30.6 | 13.9 |
Loan demand | 42.2 | 35.6 | 53.5 | 35.2 | 11.3 |
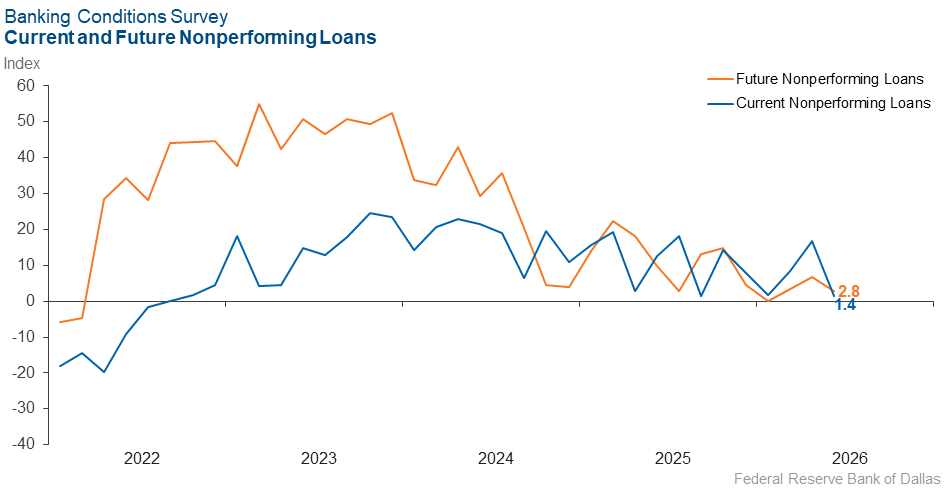
Nonperforming loans | 1.4 | 16.9 | 19.7 | 62.0 | 18.3 |
Loan pricing | –1.4 | –18.6 | 11.1 | 76.4 | 12.5 |
| Indicator | Current Index | Previous Index | % Reporting Eased | % Reporting No Change | % Reporting Tightened |
Credit standards and terms | –5.9 | –5.2 | 2.9 | 88.2 | 8.8 |
| Commercial and Industrial Loans: Over the past six weeks, how have the following changed? | |||||
| Indicator | Current Index | Previous Index | % Reporting Increase | % Reporting No Change | % Reporting Decrease |
Loan volume | 19.7 | 15.1 | 28.8 | 62.1 | 9.1 |
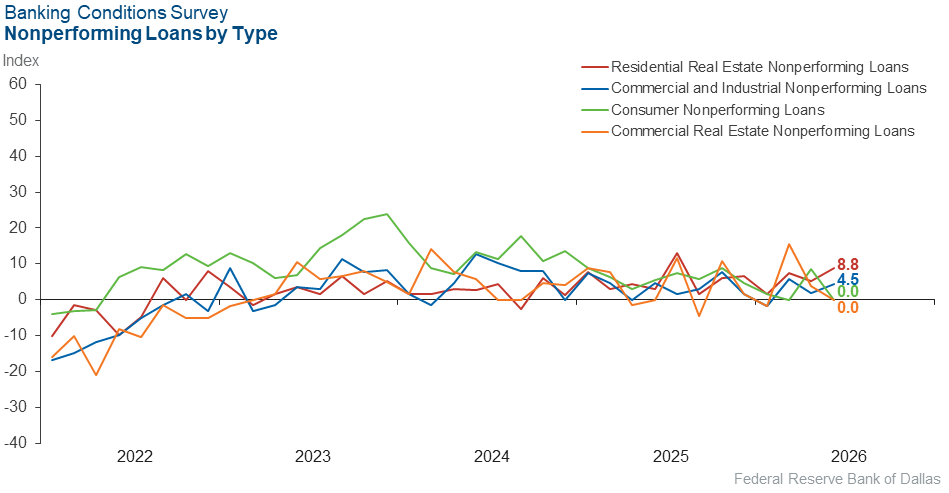
Nonperforming loans | 4.5 | 1.9 | 10.6 | 83.3 | 6.1 |
| Indicator | Current Index | Previous Index | % Reporting Eased | % Reporting No Change | % Reporting Tightened |
Credit standards and terms | –6.1 | –7.7 | 3.1 | 87.7 | 9.2 |
| Commercial Real Estate Loans: Over the past six weeks, how have the following changed? | |||||
| Indicator | Current Index | Previous Index | % Reporting Increase | % Reporting No Change | % Reporting Decrease |
Loan volume | 40.3 | 24.5 | 46.3 | 47.8 | 6.0 |
Nonperforming loans | 0.0 | 3.7 | 9.1 | 81.8 | 9.1 |
| Indicator | Current Index | Previous Index | % Reporting Eased | % Reporting No Change | % Reporting Tightened |
Credit standards and terms | –6.1 | –3.7 | 3.0 | 87.9 | 9.1 |
| Residential Real Estate Loans: Over the past six weeks, how have the following changed? | |||||
| Indicator | Current Index | Previous Index | % Reporting Increase | % Reporting No Change | % Reporting Decrease |
Loan volume | 14.5 | 7.1 | 33.3 | 47.8 | 18.8 |
Nonperforming loans | 8.8 | 5.3 | 13.2 | 82.4 | 4.4 |
| Indicator | Current Index | Previous Index | % Reporting Eased | % Reporting No Change | % Reporting Tightened |
Credit standards and terms | –5.8 | –3.6 | 0.0 | 94.2 | 5.8 |
| Consumer Loans: Over the past six weeks, how have the following changed? | |||||
| Indicator | Current Index | Previous Index | % Reporting Increase | % Reporting No Change | % Reporting Decrease |
Loan volume | –1.4 | 3.4 | 15.3 | 68.1 | 16.7 |
Nonperforming loans | 0.0 | 8.5 | 8.5 | 83.1 | 8.5 |
| Indicator | Current Index | Previous Index | % Reporting Eased | % Reporting No Change | % Reporting Tightened |
Credit standards and terms | –2.8 | 0.0 | 0.0 | 97.2 | 2.8 |
| Banking Outlook: What is your expectation for the following items six months from now? | |||||
| Indicator | Current Index | Previous Index | % Reporting Increase | % Reporting No Change | % Reporting Decrease |
Total loan demand | 47.9 | 40.6 | 59.2 | 29.6 | 11.3 |
Nonperforming loans | 2.8 | 6.7 | 21.1 | 60.6 | 18.3 |
| General Business Activity: What is your evaluation of the level of activity? | |||||
| Indicator | Current Index | Previous Index | % Reporting Better | % Reporting No Change | % Reporting Worse |
Over the past six weeks | 19.7 | 10.2 | 32.4 | 54.9 | 12.7 |
Six months from now | 38.6 | 11.9 | 48.6 | 41.4 | 10.0 |

Survey participants are given the opportunity to submit comments on current issues that may be affecting their businesses. Some comments have been edited for grammar and clarity.
- Geopolitical macro impacts are affecting consumer and business confidence.
- A company is building a $27 billion data center within 40 miles of our main office and within 10 miles of another branch, and it is generating lots of loans and deposits in our area.
- Looking ahead six months, I remain concerned about the economic environment. Inflation is running higher than preferred, the potential for interest-rate increases could raise borrowing costs for consumers and businesses, and ongoing geopolitical uncertainty continues to weigh on overall confidence.
- The duration of the U.S-Israel-Iran war has had a minor impact on business, but the rising price in oil has insulated the Texas economy. We are seeing some weakening in consumer markets driven by sustained higher inflation.
- The end to the war should motivate our small business and middle market clients to proceed with projects currently on hold.
- Inflation is eating away at the disposable income of most consumers. The feedback that we are receiving from local realtors is that residential home listings are up, but there are very few potential buyers right now.
Historical data can be downloaded dating back to March 2017. For the definitions, see data definitions.
NOTE: The following series were discontinued in May 2020: volume of core deposits, cost of funds, non-interest income and net interest margin.
Questions regarding the Banking Conditions Survey can be addressed to Mariam Yousuf at mariam.yousuf@dal.frb.org.
Sign up for our email alert to be automatically notified as soon as the latest Banking Conditions Survey is released on the web.