Special Questions

Special Questions
August 26, 2019
Results below include responses from participants of all three surveys: Texas Manufacturing Outlook Survey, Texas Service Sector Outlook Survey and Texas Retail Outlook Survey.
Texas Business Outlook Surveys
Data were collected August 13–21, and 385 Texas business executives responded to the surveys.
See data files with a full history of results.
Are you currently trying to hire?
| |
May ’19 (percent) |
Aug. ’19 (percent) |
| Yes | 71.4 | 69.8 |
| No | 28.6 | 30.2 |
NOTE: 381 responses.
Are you having problems finding qualified workers when hiring?
| May ’19 (percent) |
Aug. ’19 (percent) |
|
| Yes | 83.0 | 75.6 |
| No | 17.0 | 24.4 |
NOTES: 266 responses. This question was posed only to respondents that answered “Yes” to the preceding question.
If you are trying to fill low-skill positions, are you having problems finding qualified workers?
| Feb. ’19 (percent) |
Aug. ’19 (percent) |
|
| Yes | 80.5 | 77.9 |
| No | 19.5 | 22.1 |
NOTES: 154 responses. This question was posed only to respondents that answered “Yes” to having problems finding qualified workers.
What are the main reasons you are having difficulty finding qualified low-skill workers? Please select all that apply.
| Aug. ’19 (percent) |
|
| Lack of available applicants/no applicants | 72.3 |
| Inability to pass drug test and/or background check | 47.9 |
| Lack of workplace competencies (soft skills) | 43.7 |
| Looking for more pay than is offered | 40.3 |
| Lack of technical competencies (hard skills) | 35.3 |
| Lack of experience | 26.1 |
| Other | 9.2 |
NOTES: 119 responses. This question was posed only to respondents that answered “Yes” to the preceding question.
If you are trying to fill mid-skill positions, are you having problems finding qualified workers?
| Feb. ’19 (percent) |
Aug. ’19 (percent) |
|
| Yes | 86.0 | 84.3 |
| No | 14.0 | 15.7 |
NOTES: 172 responses. This question was posed only to respondents that answered “Yes” to having problems finding qualified workers.
What are the main reasons you are having difficulty finding qualified mid-skill workers? Please select all that apply.
| Aug. ’19 (percent) |
|
| Lack of available applicants/no applicants | 72.2 |
| Lack of technical competencies (hard skills) | 47.2 |
| Looking for more pay than is offered | 44.4 |
| Lack of experience | 36.8 |
| Lack of workplace competencies (soft skills) | 24.3 |
| Inability to pass drug test and/or background check | 16.7 |
| Other | 4.2 |
NOTES: 144 responses. This question was posed only to respondents that answered “Yes” to the preceding question.
If you are trying to fill high-skill positions, are you having problems finding qualified workers?
| Feb. ’19 (percent) |
Aug. ’19 (percent) |
|
| Yes | 77.1 | 64.9 |
| No | 22.9 | 35.1 |
NOTES: 151 responses. This question was posed only to respondents that answered “Yes” to having problems finding qualified workers.
What are the main reasons you are having difficulty finding qualified high-skill workers? Please select all that apply.
| Aug. ’19 (percent) |
|
| Lack of available applicants/no applicants | 72.2 |
| Lack of technical competencies (hard skills) | 50.5 |
| Looking for more pay than is offered | 47.4 |
| Lack of experience | 29.9 |
| Lack of workplace competencies (soft skills) | 17.5 |
| Inability to pass drug test and/or background check | 7.2 |
| Other | 2.1 |
NOTES: 97 responses. This question was posed only to respondents that answered “Yes” to the preceding question.
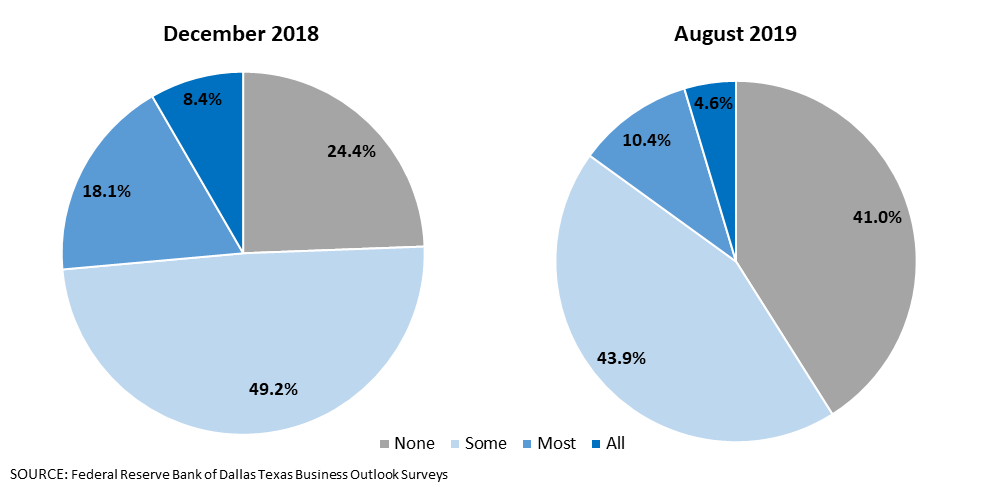
If costs (including wages) are increasing, to what extent are you passing the higher costs on to customers in the way of price increases?
| Dec. ’18 (percent) |
Aug. ’19 (percent) |
|
| None | 24.4 | 41.0 |
| Some | 49.2 | 43.9 |
| Most | 18.1 | 10.4 |
| All | 8.4 | 4.6 |
NOTE: 383 responses.
If costs (including wages) are increasing, how has your firm’s ability to pass those increases on to customers changed over the past six months?
| Dec. ’18 (percent) |
Aug. ’19 (percent) |
|
| Much easier now | 1.4 | 1.8 |
| Somewhat easier now | 18.9 | 13.0 |
| Similar to six months ago | 39.5 | 46.4 |
| Somewhat harder now | 23.7 | 26.7 |
| Significantly harder now | 16.5 | 12.1 |
NOTE: 383 responses.
Survey respondents were given the opportunity to provide general comments. These comments can be found on the individual survey Special Questions results pages, accessible by the tabs above.
Texas Manufacturing Outlook Survey
Data were collected August 13–21, and 114 Texas manufacturers responded to the surveys.
See data files with a full history of results.
Are you currently trying to hire?
| |
May ’19 (percent) |
Aug. ’19 (percent) |
| Yes | 72.7 | 64.0 |
| No | 27.3 | 36.0 |
NOTE: 114 responses.
Are you having problems finding qualified workers when hiring?
| May ’19 (percent) |
Aug. ’19 (percent) |
|
| Yes | 79.5 | 83.6 |
| No | 20.5 | 16.4 |
NOTES: 73 responses. This question was posed only to respondents that answered “Yes” to the preceding question.
If you are trying to fill low-skill positions, are you having problems finding qualified workers?
| Feb. ’19 (percent) |
Aug. ’19 (percent) |
|
| Yes | 83.8 | 71.4 |
| No | 16.2 | 28.6 |
NOTES: 49 responses. This question was posed only to respondents that answered “Yes” to having problems finding qualified workers.
What are the main reasons you are having difficulty finding qualified low-skill workers? Please select all that apply.
| Aug. ’19 (percent) |
|
| Lack of available applicants/no applicants | 85.3 |
| Inability to pass drug test and/or background check | 64.7 |
| Lack of technical competencies (hard skills) | 44.1 |
| Looking for more pay than is offered | 38.2 |
| Lack of workplace competencies (soft skills) | 35.3 |
| Lack of experience | 26.5 |
| Other | 17.6 |
NOTES: 34 responses. This question was posed only to respondents that answered “Yes” to the preceding question.
If you are trying to fill mid-skill positions, are you having problems finding qualified workers?
| Feb. ’19 (percent) |
Aug. ’19 (percent) |
|
| Yes | 83.1 | 83.6 |
| No | 16.9 | 16.4 |
NOTES: 55 responses. This question was posed only to respondents that answered “Yes” to having problems finding qualified workers.
What are the main reasons you are having difficulty finding qualified mid-skill workers? Please select all that apply.
| Aug. ’19 (percent) |
|
| Lack of available applicants/no applicants | 73.3 |
| Lack of technical competencies (hard skills) | 51.1 |
| Looking for more pay than is offered | 37.8 |
| Lack of experience | 37.8 |
| Lack of workplace competencies (soft skills) | 26.7 |
| Inability to pass drug test and/or background check | 15.6 |
| Other | 4.4 |
NOTES: 45 responses. This question was posed only to respondents that answered “Yes” to the preceding question.
If you are trying to fill high-skill positions, are you having problems finding qualified workers?
| Feb. ’19 (percent) |
Aug. ’19 (percent) |
|
| Yes | 70.3 | 66.0 |
| No | 29.7 | 34.0 |
NOTES: 47 responses. This question was posed only to respondents that answered “Yes” to having problems finding qualified workers.
What are the main reasons you are having difficulty finding qualified high-skill workers? Please select all that apply.
| Aug. ’19 (percent) |
|
| Lack of technical competencies (hard skills) | 80.0 |
| Lack of available applicants/no applicants | 70.0 |
| Looking for more pay than is offered | 40.0 |
| Lack of experience | 40.0 |
| Lack of workplace competencies (soft skills) | 23.3 |
| Inability to pass drug test and/or background check | 16.7 |
| Other | 0.0 |
NOTES: 30 responses. This question was posed only to respondents that answered “Yes” to the preceding question.
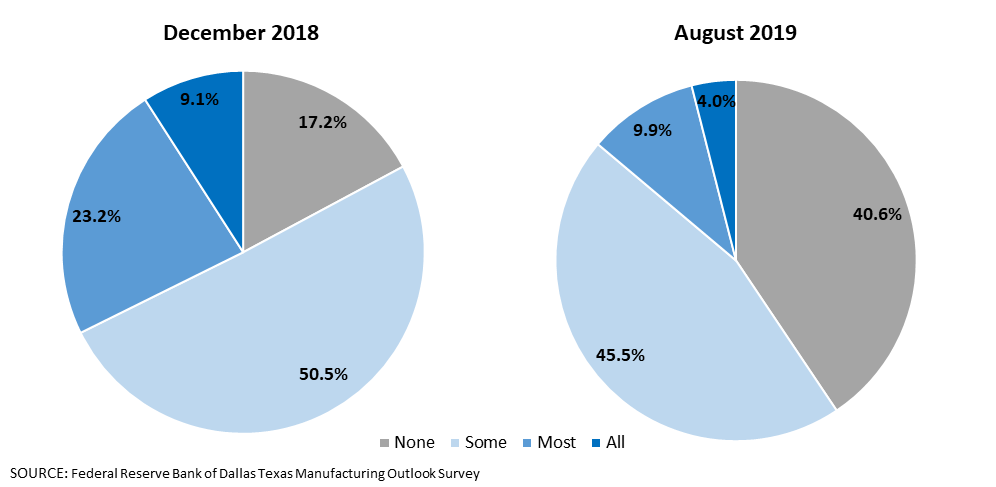
If costs (including wages) are increasing, to what extent are you passing the higher costs on to customers in the way of price increases?
| Dec. ’18 (percent) |
Aug. ’19 (percent) |
|
| None | 17.2 | 40.6 |
| Some | 50.5 | 45.5 |
| Most | 23.2 | 9.9 |
| All | 9.1 | 4.0 |
NOTE: 113 responses.
If costs (including wages) are increasing, how has your firm’s ability to pass those increases on to customers changed over the past six months?
| Dec. ’18 (percent) |
Aug. ’19 (percent) |
|
| Much easier now | 1.0 | 1.0 |
| Somewhat easier now | 26.5 | 12.7 |
| Similar to six months ago | 35.7 | 45.1 |
| Somewhat harder now | 20.4 | 25.5 |
| Significantly harder now | 16.3 | 15.7 |
NOTE: 114 responses.
Special Questions Comments
These comments have been edited for publication.
Fabricated Metal Product Manufacturing
- Our company has to bid on most every job from a couple of our customers whether we have done the job before or it is new. Since President Trump’s tariffs, we are forced to lower our previous pricing to maintain jobs we had done for years at essentially at the same price. So the price of material and labor go up while the cost of manufactured parts goes down? Does not compute.
Machinery Manufacturing
- Our industry is trying to cut costs everywhere, which is making it harder for us to pass costs on to our customers.
Transportation Equipment Manufacturing
- We are looking to improve production efficiencies, purchasing savings and quality.
- Pricing for our company is based on global supply and demand. So when we increase wages for employees, we cannot automatically increase our sales prices to global customers. Competing against Third World countries that have reverse-engineered our technology and utilize low-wage earners is very difficult, if not impossible.
Food Manufacturing
- We have been successful squeezing more productivity (efficiencies) out of the plant, which has offset increased direct labor/hourly rates for now.
Paper Manufacturing
- The same capacity (employees/machinery) is now chasing lower demand, so realized prices are coming down. Demand for health care never goes down, thus prices continue to climb. This is a squeeze that can only be addressed by reducing the workforce. Automation can’t impact it fast enough.
Miscellaneous Manufacturing
- Customers see the LME [London Metal Exchange] aluminum and Midwest Aluminum Premium coming down and are requesting price decreases. But we aren’t able to pass along price decreases to our customers due to the decline in business level versus the amount of aluminum we have on order and in the pipeline at higher prices—we had to order aluminum well in advance due to long lead times caused by demand and tariffs—and due to the sharp decline in scrap prices.
Texas Service Sector Outlook Survey
Data were collected August 13–21, and 271 Texas business executives responded to the surveys.
See data files with a full history of results.
Are you currently trying to hire?
| |
May ’19 (percent) |
Aug. ’19 (percent) |
| Yes | 70.8 | 72.3 |
| No | 29.2 | 27.7 |
NOTE: 267 responses.
Are you having problems finding qualified workers when hiring?
| May ’19 (percent) |
Aug. ’19 (percent) |
|
| Yes | 84.5 | 72.5 |
| No | 15.5 | 27.5 |
NOTES: 193 responses. This question was posed only to respondents that answered “Yes” to the preceding question.
If you are trying to fill low-skill positions, are you having problems finding qualified workers?
| Feb. ’19 (percent) |
Aug. ’19 (percent) |
|
| Yes | 78.6 | 81.0 |
| No | 21.4 | 19.0 |
NOTES: 105 responses. This question was posed only to respondents that answered “Yes” to having problems finding qualified workers.
What are the main reasons you are having difficulty finding qualified low-skill workers? Please select all that apply.
| Aug. ’19 (percent) |
|
| Lack of available applicants/no applicants | 67.1 |
| Lack of workplace competencies (soft skills) | 47.1 |
| Looking for more pay than is offered | 41.2 |
| Inability to pass drug test and/or background check | 41.2 |
| Lack of technical competencies (hard skills) | 31.8 |
| Lack of experience | 25.9 |
| Other | 5.9 |
NOTES: 85 responses. This question was posed only to respondents that answered “Yes” to the preceding question.
If you are trying to fill mid-skill positions, are you having problems finding qualified workers?
| Feb. ’19 (percent) |
Aug. ’19 (percent) |
|
| Yes | 87.5 | 84.6 |
| No | 12.5 | 15.4 |
NOTES: 117 responses. This question was posed only to respondents that answered “Yes” to having problems finding qualified workers.
What are the main reasons you are having difficulty finding qualified mid-skill workers? Please select all that apply.
| Aug. ’19 (percent) |
|
| Lack of available applicants/no applicants | 71.7 |
| Looking for more pay than is offered | 47.5 |
| Lack of technical competencies (hard skills) | 45.5 |
| Lack of experience | 36.4 |
| Lack of workplace competencies (soft skills) | 23.2 |
| Inability to pass drug test and/or background check | 17.2 |
| Other | 4.0 |
NOTES: 99 responses. This question was posed only to respondents that answered “Yes” to the preceding question.
If you are trying to fill high-skill positions, are you having problems finding qualified workers?
| Feb. ’19 (percent) |
Aug. ’19 (percent) |
|
| Yes | 80.3 | 64.4 |
| No | 19.7 | 35.6 |
NOTES: 104 responses. This question was posed only to respondents that answered “Yes” to having problems finding qualified workers.
What are the main reasons you are having difficulty finding qualified high-skill workers? Please select all that apply.
| Aug. ’19 (percent) |
|
| Lack of available applicants/no applicants | 73.1 |
| Looking for more pay than is offered | 50.7 |
| Lack of technical competencies (hard skills) | 37.3 |
| Lack of experience | 25.4 |
| Lack of workplace competencies (soft skills) | 14.9 |
| Inability to pass drug test and/or background check | 3.0 |
| Other | 3.0 |
NOTES: 67 responses. This question was posed only to respondents that answered “Yes” to the preceding question.
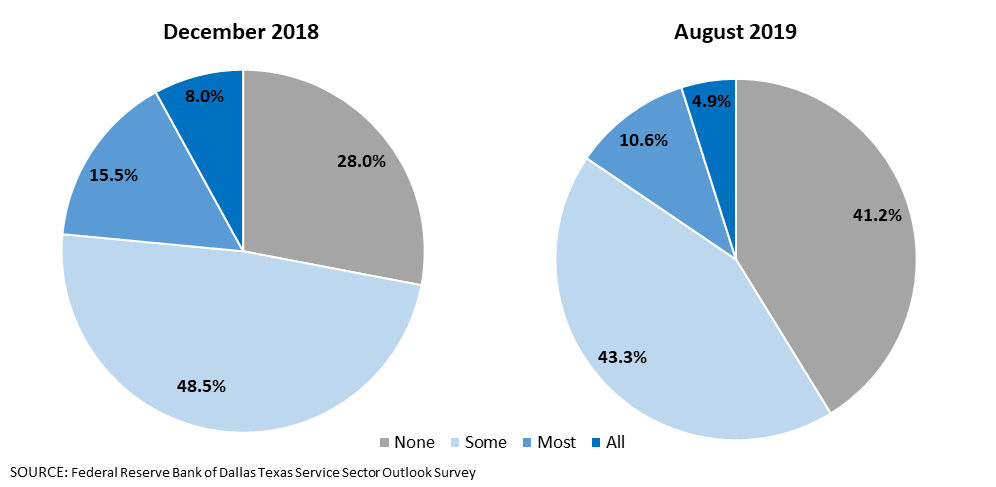
If costs (including wages) are increasing, to what extent are you passing the higher costs on to customers in the way of price increases?
| Dec. ’18 (percent) |
Aug. ’19 (percent) |
|
| None | 28.0 | 41.2 |
| Some | 48.5 | 43.3 |
| Most | 15.5 | 10.6 |
| All | 8.0 | 4.9 |
NOTE: 270 responses.
If costs (including wages) are increasing, how has your firm’s ability to pass those increases on to customers changed over the past six months?
| Dec. ’18 (percent) |
Aug. ’19 (percent) |
|
| Much easier now | 1.6 | 2.2 |
| Somewhat easier now | 15.0 | 13.2 |
| Similar to six months ago | 41.5 | 46.9 |
| Somewhat harder now | 25.4 | 27.2 |
| Significantly harder now | 16.6 | 10.5 |
NOTE: 269 responses.
Special Questions Comments
These comments have been edited for publication.
Support Activities for Transportation
- Price increases have been implemented when bringing on new business.
Data Processing, Hosting and Related Services
- Our clients expect us to enhance our technology at a regular pace, and new innovations require leading-edge technologies. There are very few workers in North Texas with leading-edge technology skills.
- We have employed several search firms to help us hire additional high-skilled workers.
- We are offering more pay and better benefits.
- We are working current employees much more (overtime and higher stress) and paying them better wages and benefits.
- We have recently started looking outside of North Texas for high-skilled help.
Credit Intermediation and Related Activities
- The average time to fill a position has increased by about a week.
- Succession is the biggest challenge with an aging workforce; there are more spots to fill. Consolidation of tasks is part of the plan but requires higher wages and more talent to acquire the expertise to absorb increased responsibilities.
Securities, Commodity Contracts, and Other Financial Investments and Related Activities
- Selling/quoting prices are down (i.e., markets services to the oil and gas industry), while almost all costs are increasing (i.e., raw materials, labor, property taxes, all property insurance, health insurance, etc.).
- Competition is increasing, with pricing at the forefront of our competitors’ strategy.
Professional, Scientific and Technical Services
- Companies are more likely to take the cheapest service without understanding the qualifications and expertise provided. Raising prices or just keeping prices at current levels is next to impossible.
- It is incredibly hard to find excellent candidates who want to commit.
- Clients continually attempt to commoditize products/services and make it difficult to raise prices.
- Our premium rates are set by the state, so we cannot pass any of these expenses on to our customers.
- We raise rates every year in October. There seems to be good room to be able to do so based on good demand presently for our services. Moreover, competitors have largely had higher rates, which makes it easier for us.
Management of Companies and Enterprises
- Decreasing loan interest rates while costs of deposits remain steady has put pressure on banks’ NIM (net interest margin). The yield curve (short-term interest rates versus longer-term interest rates) has flattened and in some cases inverted, thus the NIM pressure noted above.
Administrative and Support Services
- It is a good market—very strong. Weather is not an issue anymore. It was four months ago—very, very rainy.
- Customers are still price shopping heavily. We will not increase our prices until Jan. 1 if we can keep EBITA [earnings before interest, taxes and amortization] in line for fourth quarter.
- Our units are under contract and, as such, price increases in our construction costs can't be passed through. However, we can raise prices on future phases of development, and we have had good ability to raise prices as needed.
Educational Services
- As we continue to garner results for our clients and gain credibility, we are able to increase our prices, which helps us pay our employees more and fuel growth.
Ambulatory Health Care Services
- It is a tight employment market. Low-skill employees are hardest [to find]—we rely on local recruitment. Mid-level employees are often promoted from within or recruited from other firms. Higher-skill employees are recruited from outside the region—we have slowed hiring but have had no major difficulties. Texas is still a great place to live and work.
- As a health care provider, we have no control over prices; it is a deflationary industry. I am an outpatient image provider.
- With the oil and gas sector cutting back on the workforce in the last three weeks, we are seeing an increase in health care workers returning back to the health care fields from the O&G jobs. That is allowing us in the health care field to staff up the vacant positions.
Hospitals
- Hospital reimbursement levels are largely fixed, especially in the short run. Our ability to pass cost increases on to our customers is extremely limited.
Nursing and Residential Care Facilities
- As a Medicare and state Medicaid provider for part of our services, we are not able to pass along cost increases to most of our customers. Texas Medicaid does not pay enough to cover the cost of services now. We actually lose anywhere from $30–$60 per patient per day for every person on Medicaid we have.
Social Assistance
- We are planning to pass along a 3 percent increase to our customers in October.
Amusement, Gambling and Recreation Industries
- Because we are a private club, many of the increases are passed on by dues increases. This will cover the costs of employee health insurance and horrible increases in property taxes. However, I just ate at my favorite hamburger joint today and they are closing in October because they can no longer handle the increases in taxes and the fact that the city has severely affected their business by taking away so many parking places. This is a similar story being told all over our central business district. There are many vacant storefronts with many more to come.
Texas Retail Outlook Survey
Data were collected August 13–21, and 50 Texas retailers responded to the surveys.
See data files with a full history of results.
Are you currently trying to hire?
| |
May ’19 (percent) |
Aug. ’19 (percent) |
| Yes | 70.0 | 75.5 |
| No | 30.0 | 24.5 |
NOTE: 49 responses.
Are you having problems finding qualified workers when hiring?
| May ’19 (percent) |
Aug. ’19 (percent) |
|
| Yes | 88.6 | 78.4 |
| No | 11.4 | 21.6 |
NOTES: 37 responses. This question was posed only to respondents that answered “Yes” to the preceding question.
If you are trying to fill low-skill positions, are you having problems finding qualified workers?
| Feb. ’19 (percent) |
Aug. ’19 (percent) |
|
| Yes | 76.0 | 80.8 |
| No | 24.0 | 19.2 |
NOTES: 26 responses. This question was posed only to respondents that answered “Yes” to having problems finding qualified workers.
What are the main reasons you are having difficulty finding qualified low-skill workers? Please select all that apply.
| Aug. ’19 (percent) |
|
| Lack of available applicants/no applicants | 66.7 |
| Lack of workplace competencies (soft skills) | 61.9 |
| Inability to pass drug test and/or background check | 47.6 |
| Lack of technical competencies (hard skills) | 28.6 |
| Lack of experience | 19.0 |
| Looking for more pay than is offered | 14.3 |
| Other | 0.0 |
NOTES: 21 responses. This question was posed only to respondents that answered “Yes” to the preceding question.
If you are trying to fill mid-skill positions, are you having problems finding qualified workers?
| Feb. ’19 (percent) |
Aug. ’19 (percent) |
|
| Yes | 85.7 | 85.2 |
| No | 14.3 | 14.8 |
NOTES: 27 responses. This question was posed only to respondents that answered “Yes” to having problems finding qualified workers.
What are the main reasons you are having difficulty finding qualified mid-skill workers? Please select all that apply.
| Aug. ’19 (percent) |
|
| Lack of available applicants/no applicants | 60.9 |
| Lack of technical competencies (hard skills) | 47.8 |
| Looking for more pay than is offered | 39.1 |
| Lack of experience | 26.1 |
| Inability to pass drug test and/or background check | 26.1 |
| Lack of workplace competencies (soft skills) | 21.7 |
| Other | 0.0 |
NOTES: 23 responses. This question was posed only to respondents that answered “Yes” to the preceding question.
If you are trying to fill high-skill positions, are you having problems finding qualified workers?
| Feb. ’19 (percent) |
Aug. ’19 (percent) |
|
| Yes | 70.4 | 52.6 |
| No | 29.6 | 47.4 |
NOTES: 19 responses. This question was posed only to respondents that answered “Yes” to having problems finding qualified workers.
What are the main reasons you are having difficulty finding qualified high-skill workers? Please select all that apply.
| Aug. ’19 (percent) |
|
| Lack of available applicants/no applicants | 70.0 |
| Lack of technical competencies (hard skills) | 60.0 |
| Lack of workplace competencies (soft skills) | 30.0 |
| Looking for more pay than is offered | 10.0 |
| Lack of experience | 10.0 |
| Inability to pass drug test and/or background check | 10.0 |
| Other | 0.0 |
NOTES: 10 responses. This question was posed only to respondents that answered “Yes” to the preceding question.
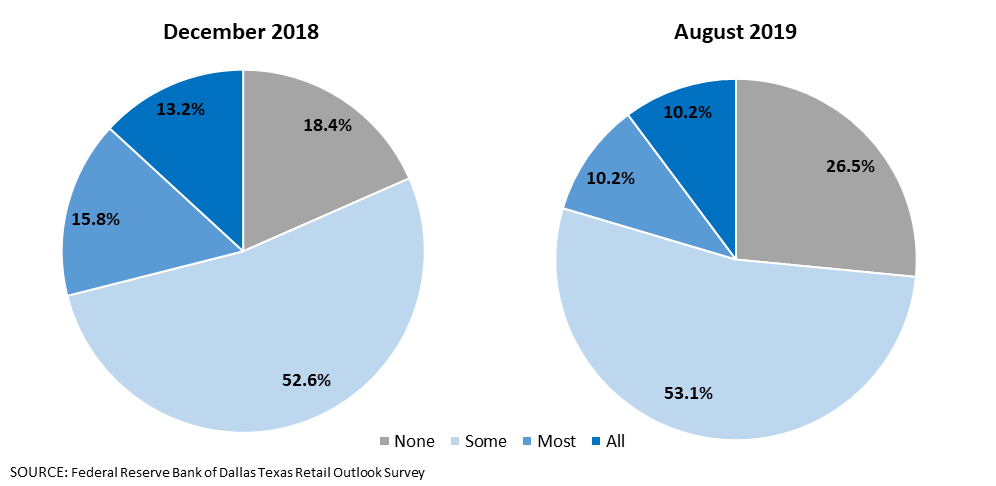
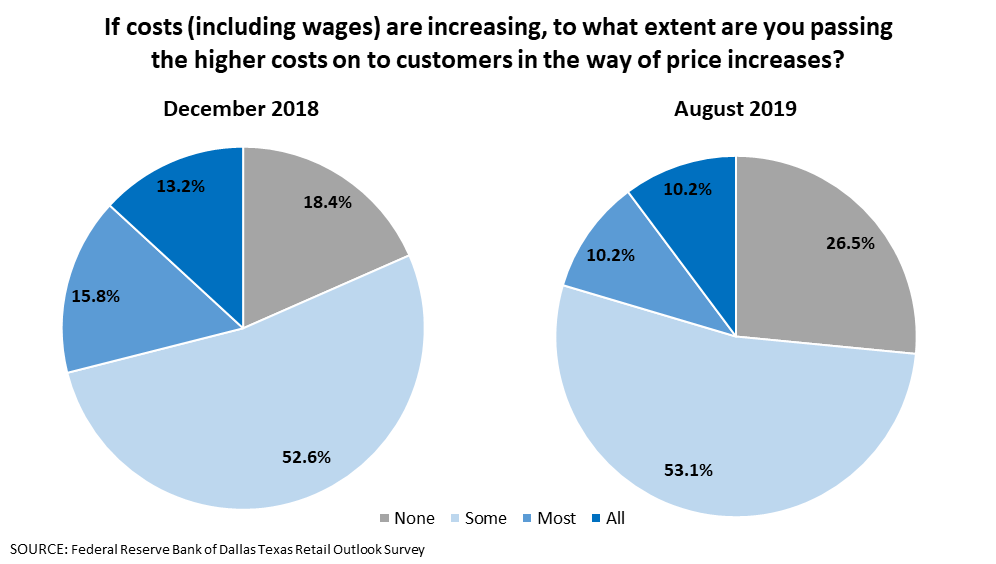
If costs (including wages) are increasing, to what extent are you passing the higher costs on to customers in the way of price increases?
| Dec. ’18 (percent) |
Aug. ’19 (percent) |
|
| None | 18.4 | 26.5 |
| Some | 52.6 | 53.1 |
| Most | 15.8 | 10.2 |
| All | 13.2 | 10.2 |
NOTE: 50 responses.
If costs (including wages) are increasing, how has your firm’s ability to pass those increases on to customers changed over the past six months?
| Dec. ’18 (percent) |
Aug. ’19 (percent) |
|
| Much easier now | 5.3 | 2.1 |
| Somewhat easier now | 7.9 | 14.6 |
| Similar to six months ago | 28.9 | 39.6 |
| Somewhat harder now | 36.8 | 33.3 |
| Significantly harder now | 21.1 | 10.4 |
NOTE: 50 responses.
Special Questions Comments
There were no comments for the Texas Retail Outlook Survey for this release.
Questions regarding the Texas Business Outlook Surveys can be addressed to Emily Kerr at emily.kerr@dal.frb.org.
Sign up for our email alert to be automatically notified as soon as the latest surveys are released on the web.