Special Questions

Special Questions
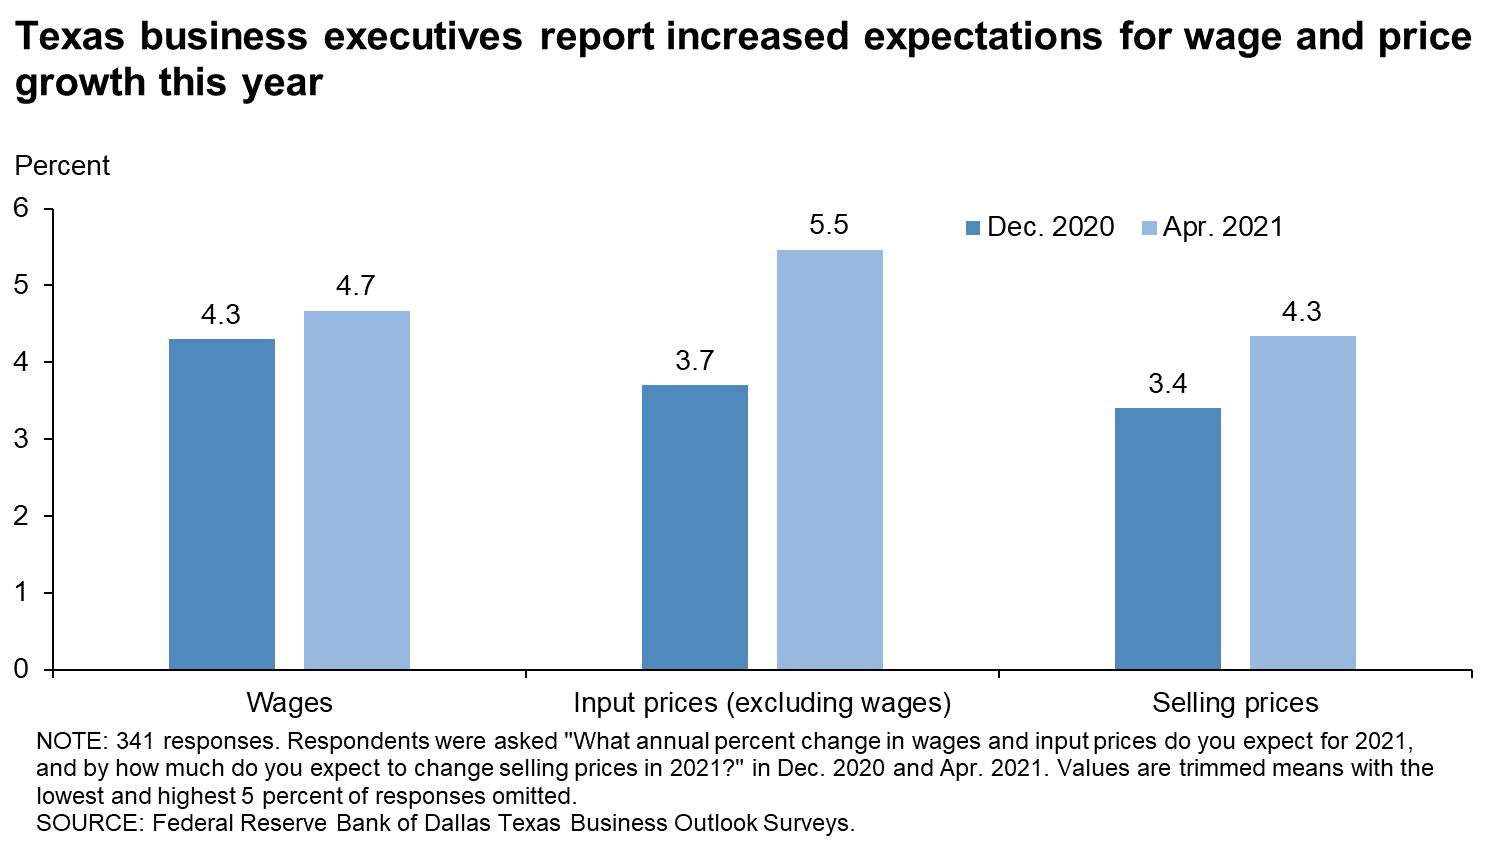
Texas Business Outlook Surveys
Data were collected April 13–21, and 376 Texas business executives responded to the surveys.
| 2018 | 2019 | 2020 | 2021 | |||||
| Expected (percent) |
Actual (percent) |
Expected (percent) |
Actual (percent) |
Expected (percent) |
Actual (percent) |
Expected (percent) |
Expected (percent) |
|
| Wages | 4.4 | 4.5 | 4.0 | 3.9 | 3.8 | 2.1 | 4.3 | 4.7 |
| Input prices | 4.8 | 4.7 | 3.8 | 3.4 | 3.3 | 2.7 | 3.7 | 5.5 |
| Selling prices | 3.5 | 3.1 | 2.8 | 2.4 | 2.8 | 1.1 | 3.4 | 4.3 |
| Data collected | May '18 | Dec. '18 | Dec. '18 | Dec. '19 | Dec. '19 | Dec. '20 | Dec. '20 | Apr. '21 |
NOTES: 341 responses. Shown are averages calculated as trimmed means with the lowest and highest 5 percent of responses omitted.
| May '20 (percent) |
Aug. '20 (percent) |
Nov. '20 (percent) |
Feb. '21 (percent) |
Apr. '21 (percent) |
|
| Share of firms reporting reduced revenues | 81.2 | 68.3 | 63.7 | 56.5 | 50.1 |
| Average revenue decline (Y/Y) | -38.3 | -29.9 | -28.7 | -26.7 | -26.3 |
| Share of firms reporting increased revenues | 10.2 | 18.3 | 19.9 | 23.3 | 34.0 |
| Average revenue increase (Y/Y) | 20.1 | 17.6 | 17.7 | 15.8 | 15.5 |
| Share of firms reporting no change in revenues | 8.6 | 13.4 | 16.4 | 20.2 | 15.9 |
NOTES: 353 responses. In past months the question wording was adjusted to reference the respective month of comparison. Averages are calculated as trimmed means with the lowest and highest 7.5 percent of responses omitted. Average revenue decline is calculated using only responses from firms that reported reduced revenues. Average revenue increase is calculated using only responses from firms that reported increased revenues.
| Aug. '20 (percent) |
Nov. '20 (percent) |
Feb. '21 (percent) |
Apr. '21 (percent) |
|
| Share of firms reporting reduced head count | 51.4 | 51.1 | 47.3 | 48.6 |
| Average head count decline (compared with Feb. 2020 levels) | -27.2 | -28.4 | -25.4 | -26.4 |
| Share of firms reporting increased head count | 15.4 | 13.2 | 21.0 | 22.6 |
| Average head count increase (compared with Feb. 2020 levels) | 21.0 | 15.2 | 10.8 | 12.6 |
| Share of firms reporting no change in head count | 33.2 | 35.7 | 31.7 | 28.8 |
NOTES: 354 responses. Averages are calculated as trimmed means with the lowest and highest 7.5 percent of responses omitted. Average head count decline is calculated using only responses from firms that reported reduced head count. Average head count increase is calculated using only responses from firms that reported increased head count.
| Apr. '21 (percent) |
|||||
| Yes | 60.1 | ||||
| No | 39.9 |
NOTE: 363 responses.
| Apr. '21 (percent) |
||
| Lack of available applicants/no applicants | 66.7 | |
| Generous unemployment benefits | 47.7 | |
| Lack of technical competencies (hard skills) | 41.2 | |
| Lack of experience | 38.4 | |
| Workers looking for more pay than is offered | 33.8 | |
| Lack of workplace competencies (soft skills) | 26.9 | |
| Inability to pass drug test and/or background check | 19.9 | |
| Lack of child care | 11.6 | |
| Fear of COVID-19 infection | 8.3 | |
| Other | 10.6 | |
| None | 9.7 |
NOTES: 216 responses. This question was only posed to those currently trying to hire or recall workers.
Survey respondents were given the opportunity to provide comments. These comments can be found on the individual survey Special Questions results pages, accessible by the tabs above.
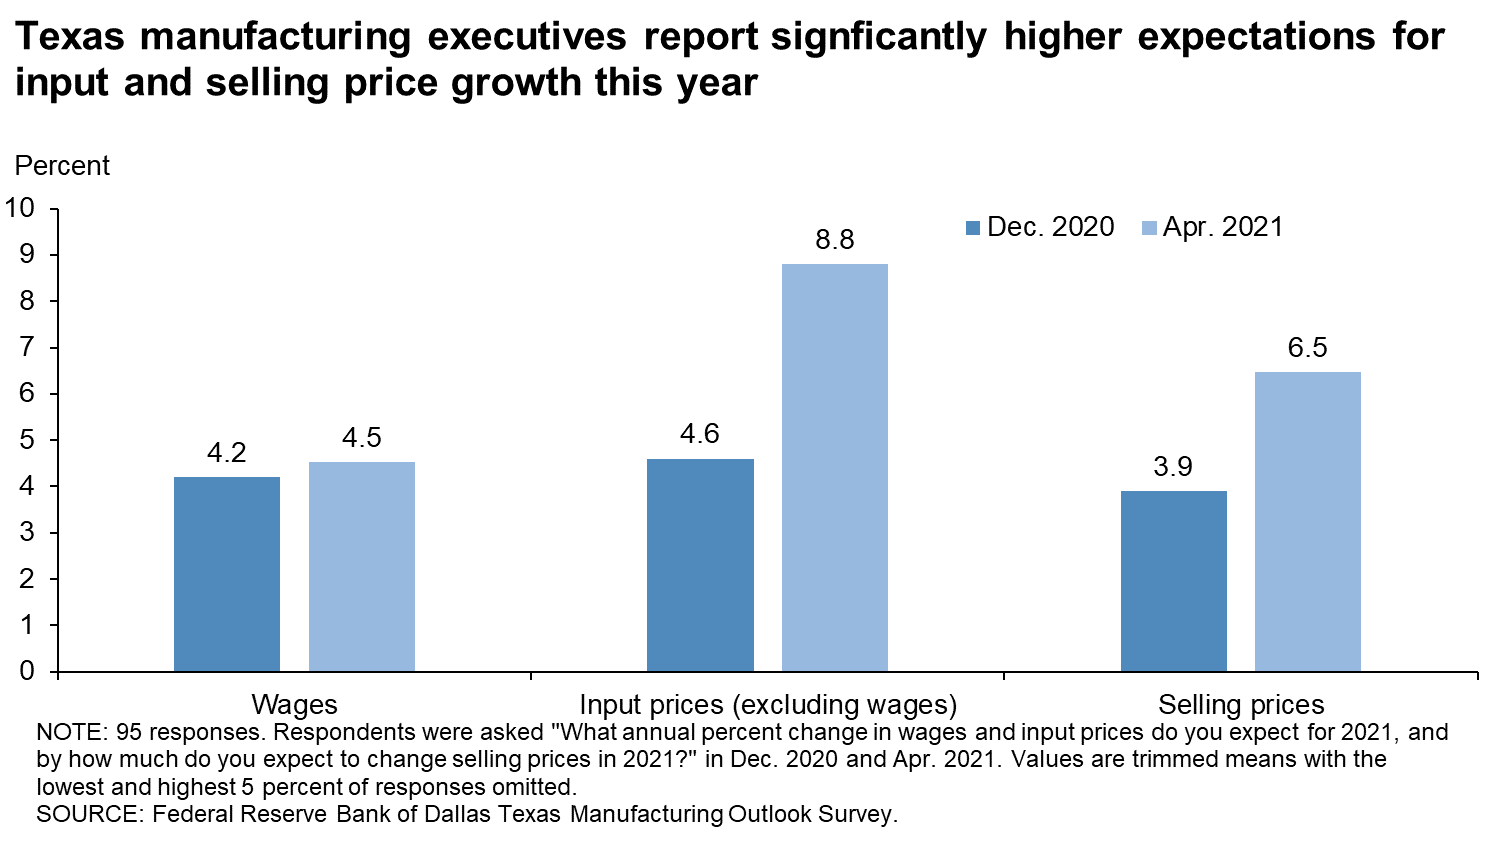
Texas Manufacturing Outlook Survey
Data were collected April 13–21, and 103 Texas manufacturers responded to the surveys.
| 2018 | 2019 | 2020 | 2021 | |||||
| Expected (percent) |
Actual (percent) |
Expected (percent) |
Actual (percent) |
Expected (percent) |
Actual (percent) |
Expected (percent) |
Expected (percent) |
|
| Wages | 4.2 | 4.4 | 3.9 | 3.4 | 3.5 | 3.3 | 4.2 | 4.5 |
| Input prices | 6.2 | 5.7 | 4.0 | 3.2 | 3.2 | 3.0 | 4.6 | 8.8 |
| Selling prices | 4.0 | 3.8 | 3.0 | 2.2 | 3.0 | 1.6 | 3.9 | 6.5 |
| Data collected | May '18 | Dec. '18 | Dec. '18 | Dec. '19 | Dec. '19 | Dec. '20 | Dec. '20 | Apr. '21 |
NOTES: 95 responses. Shown are averages calculated as trimmed means with the lowest and highest 5 percent of responses omitted.
| May '20 (percent) |
Aug. '20 (percent) |
Nov. '20 (percent) |
Feb. '21 (percent) |
Apr. '21 (percent) |
|
| Share of firms reporting reduced revenues | 78.0 | 68.6 | 57.7 | 55.7 | 45.9 |
| Average revenue decline (Y/Y) | -38.6 | -28.7 | -30.7 | -26.0 | -30.3 |
| Share of firms reporting increased revenues | 16.5 | 20.0 | 29.8 | 30.7 | 40.8 |
| Average revenue increase (Y/Y) | 19.1 | 24.6 | 19.3 | 17.7 | 19.4 |
| Share of firms reporting no change in revenues | 5.5 | 11.4 | 12.5 | 13.6 | 13.3 |
NOTES: 98 responses. In past months the question wording was adjusted to reference the respective month of comparison. Averages are calculated as trimmed means with the lowest and highest 7.5 percent of responses omitted. Average revenue decline is calculated using only responses from firms that reported reduced revenues. Average revenue increase is calculated using only responses from firms that reported increased revenues.
| Aug. '20 (percent) |
Nov. '20 (percent) |
Feb. '21 (percent) |
Apr. '21 (percent) |
|
| Share of firms reporting reduced head count | 47.6 | 49.0 | 47.7 | 40.8 |
| Average head count decline (compared with Feb. 2020 levels) | -23.9 | -24.5 | -26.8 | -23.4 |
| Share of firms reporting increased head count | 21.9 | 17.3 | 25.0 | 30.6 |
| Average head count increase (compared with Feb. 2020 levels) | 17.1 | 22.0 | 15.1 | 13.9 |
| Share of firms reporting no change in head count | 30.5 | 33.7 | 27.3 | 28.6 |
NOTES: 98 responses. Averages are calculated as trimmed means with the lowest and highest 7.5 percent of responses omitted. Average head count decline is calculated using only responses from firms that reported reduced head count. Average head count increase is calculated using only responses from firms that reported increased head count.
| Apr. '21 (percent) |
|||||
| Yes | 70.7 | ||||
| No | 29.3 |
NOTE: 99 responses.
| Apr. '21 (percent) |
||
| Lack of available applicants/no applicants | 75.7 | |
| Generous unemployment benefits | 60.0 | |
| Lack of technical competencies (hard skills) | 51.4 | |
| Lack of experience | 42.9 | |
| Workers looking for more pay than is offered | 32.9 | |
| Lack of workplace competencies (soft skills) | 32.9 | |
| Inability to pass drug test and/or background check | 30.0 | |
| Lack of child care | 8.6 | |
| Fear of COVID-19 infection | 2.9 | |
| Other | 10.0 | |
| None | 4.3 |
NOTES: 70 responses. This question was only posed to those currently trying to hire or recall workers.
Special Questions Comments
These comments have been edited for publication.
- Extended and expanded unemployment benefits make it very difficult to hire at the low end of the market.
- Government support is making it harder and harder to get folks back to work.
- Our selling prices are mostly fixed for the rest of 2021. Costs will go up this year, but it is too early to plan on a price increase for 2022.
- Finding personnel is problematic. There are very few applications in the labor pool. Lead times for production equipment are extended beyond a year. Steel prices have risen significantly and continue to do so. We are seeing increased pricing across the board in fuel, supplies, etc. We are “nose to the grindstone” on extracting all efficiencies possible in selling, production, and logistics people and processes.
- Hiring continues to be a struggle. Onboarding due to government requirements takes longer than most applicants are willing to accept. When we do manage to get someone in and start training, they are unable to handle the strenuous workload, forcing us back to square one. Our backlog is steadily increasing. Customers are pushing more and more for quicker deliveries. Raw material pricing is becoming a problem. We’re getting almost monthly increases for metals and elastomers.
- It's difficult to find people who want to work when they're making $15 per hour to sit home on unemployment.
- Get rid of the free money.
- We cannot compare month to month with sales being so random. The swings are unpredictable.
- We are hiring, but it is very hard to find qualified technical SaaS [software as a service]-based salespeople.
- We will not try to hire any planned employees due to the uncertainty of the outlook.
- Constrained hiring for both skilled and unskilled factory labor ($15 to $25 per hour) is our most significant challenge to profitable growth. Our order backlog and new orders are strong. Our focus right now is rapid and effective hiring while managing excessive overtime and employee burnout.
- Government checks are keeping people from wanting to work. They have money without having to work for it.
- It is very difficult to hire anyone who really wants to work. What we keep hearing is that it is too easy to stay home and draw unemployment. This really needs to be looked at. People need to be incentivized to work—not to stay home.
- The $300 per week of additional unemployment benefits needs to go away. There are plenty of jobs but very few jobseekers at the moment.
- Government unemployment policy offers disincentives to finding a job by paying people more to stay home than [they can earn] going to work.
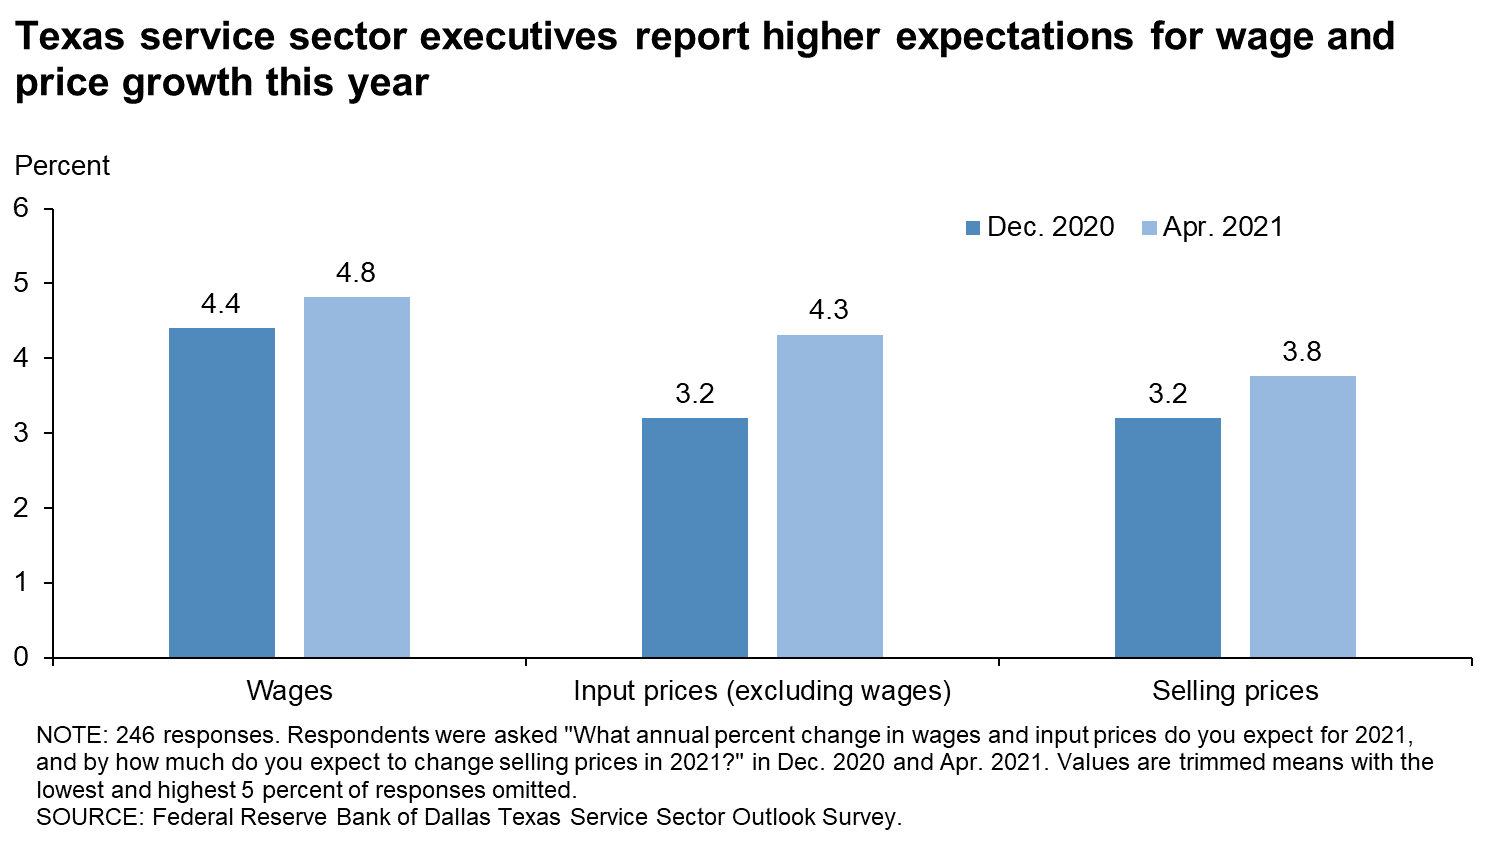
Texas Service Sector Outlook Survey
Data were collected April 13–21, and 273 Texas business executives responded to the surveys.
| 2018 | 2019 | 2020 | 2021 | |||||
| Expected (percent) |
Actual (percent) |
Expected (percent) |
Actual (percent) |
Expected (percent) |
Actual (percent) |
Expected (percent) |
Expected (percent) |
|
| Wages | 4.7 | 4.5 | 4.0 | 4.1 | 3.9 | 1.3 | 4.4 | 4.8 |
| Input prices | 4.4 | 4.2 | 3.8 | 3.5 | 3.4 | 2.6 | 3.2 | 4.3 |
| Selling prices | 3.3 | 2.8 | 2.7 | 2.5 | 2.7 | 0.8 | 3.2 | 3.8 |
| Data collected | May '18 | Dec. '18 | Dec. '18 | Dec. '19 | Dec. '19 | Dec. '20 | Dec. '20 | Apr. '21 |
NOTES: 246 responses. Shown are averages calculated as trimmed means with the lowest and highest 5 percent of responses omitted.
| May '20 (percent) |
Aug. '20 (percent) |
Nov. '20 (percent) |
Feb. '21 (percent) |
Apr. '21 (percent) |
|
| Share of firms reporting reduced revenues | 82.5 | 68.2 | 66.0 | 56.8 | 51.8 |
| Average revenue decline (Y/Y) | -38.4 | -30.5 | -28.1 | -27.3 | -25.4 |
| Share of firms reporting increased revenues | 7.7 | 17.7 | 16.0 | 20.5 | 31.4 |
| Average revenue increase (Y/Y) | 23.1 | 16.6 | 16.4 | 14.7 | 13.5 |
| Share of firms reporting no change in revenues | 9.9 | 14.1 | 17.9 | 22.7 | 16.9 |
NOTES: 255 responses. In past months the question wording was adjusted to reference the respective month of comparison. Averages are calculated as trimmed means with the lowest and highest 7.5 percent of responses omitted. Average revenue decline is calculated using only responses from firms that reported reduced revenues. Average revenue increase is calculated using only responses from firms that reported increased revenues.
| Aug. '20 (percent) |
Nov. '20 (percent) |
Feb. '21 (percent) |
Apr. '21 (percent) |
|
| Share of firms reporting reduced head count | 52.8 | 51.9 | 47.1 | 51.6 |
| Average head count decline (compared with Feb. 2020 levels) | -28.8 | -30.4 | -24.9 | -27.3 |
| Share of firms reporting increased head count | 13.0 | 11.7 | 19.4 | 19.5 |
| Average head count increase (compared with Feb. 2020 levels) | 23.7 | 11.1 | 9.8 | 12.5 |
| Share of firms reporting no change in head count | 34.2 | 36.5 | 33.5 | 28.9 |
NOTES: 256 responses. Averages are calculated as trimmed means with the lowest and highest 7.5 percent of responses omitted. Average head count decline is calculated using only responses from firms that reported reduced head count. Average head count increase is calculated using only responses from firms that reported increased head count.
| Apr. '21 (percent) |
|||||
| Yes | 56.1 | ||||
| No | 43.9 |
NOTE: 264 responses.
| Apr. '21 (percent) |
||
| Lack of available applicants/no applicants | 62.3 | |
| Generous unemployment benefits | 41.8 | |
| Lack of experience | 36.3 | |
| Lack of technical competencies (hard skills) | 36.3 | |
| Workers looking for more pay than is offered | 34.2 | |
| Lack of workplace competencies (soft skills) | 24.0 | |
| Inability to pass drug test and/or background check | 15.1 | |
| Lack of child care | 13.0 | |
| Fear of COVID-19 infection | 11.0 | |
| Other | 11.0 | |
| None | 12.3 |
NOTES: 146 responses. This question was only posed to those currently trying to hire or recall workers.
Special Questions Comments
These comments have been edited for publication.
- Volumes are down compared to a typical pre-COVID April.
- We have had no layoffs, so no recalls have been needed.
- In our hotel business, we are having a great deal of difficulty getting applicants for front desk and housekeeping positions. Of the applicants that we are interested in, about a quarter fall out because they do not have proper identification/work permit credentials. About one-third never show up for the drug screen test or fail it. The remainder either never return our calls, or if they are hired, they work for a day or two then quit stating this is harder work than they want to do. We are now changing our "onboarding" process to reduce the workload and create a more "welcoming and fun" workplace environment for the new hires.
- I believe revenues for most banks will be up over last year, especially in the fee category as a result of the PPP [Paycheck Protection Program] loan fees that are starting to be taken into income as PPP loans are forgiven by the SBA [Small Business Administration]. The challenge will be interest income on the substantial liquidity currently being held by banks.
- Pre-COVID we had around 700–1,200 applicants a month. We are lucky now if we get 20 applicants a month. The hiring environment is dramatically different than a year ago. We can grow at a faster pace on the sales side but are unable to do so because we cannot find the employees to service the clients.
- Lack of available applicants and/or lack of experience are the primary impediments to adding more staff.
- Our company did not lay off any employees during COVID-19.
- It was much more difficult hiring someone for a position this month than earlier in the year.
- Hiring will begin in force in the fall. COVID-19 concerns and not being able to work in-office fully are the big reasons we decided to wait and start hiring in late summer or fall. COVID-19 containment is the single reason the economy is not roaring back. Any tax increase should not be done at this time or in the future. The economy roaring back will solve all fiscal issues.
- Big law firms are now paying retention bonuses to keep associates.
- Hiring is a challenge right now.
- Few people are applying.
- To be blunt, if the federal government pays extended unemployment to potential employees, then they will stay on unemployment until it runs out. We have had people call us to see if we can beat the unemployment pay they receive now. Then we had some current employees take unscheduled vacation when they got the stimulus check.
- I have no workers to recall. We laid off no one.
- The IC [independent contractor] model is best for the typical travel agency. Compensation is based upon commission.
- There is very limited hiring now, but we expect more for fall.
- No employees have been terminated or furloughed. We have had issues related to entry-level new hires or turnover at the professional level requiring relocation from outside our metro area. These are different factors in part, but still some overlap. Medicine is undergoing massive pressures: No relief, rates are down, and there are huge costs to screening patients and lost business from COVID. PPP has not yet been forgiven or resolved. Small practices are disappearing forever.
- There is a significant amount of hold-back approach from traditional health care workers because of (a) burn-out from COVID work experience; (b) federal unemployment benefits availability; (c) early retirement of many senior and experienced workforce [members] due to COVID-19 impacts on their own careers or, because a majority are women in the health care workforce, their home environment (spouse work experience and children education experience) is all contributing to women in the workforce holding back from participating in the current workforce openings.
- Base wages will remain unchanged; however, with revenue returning, our bonus plans will come back into play, and employee total compensation will rise with revenue. List [selling] prices will remain unchanged; however, on Jan. 1, we removed doctors impacting 50 percent of revenue from participation in "in-network" insurance plans, offering instead participation in our Preferred Patient Membership plans. Therefore, the significant discounts in the insurance plans go away, leading to higher effective selling prices/margins.
- In my 40 years in the service industry, this period has been one of the most challenging times I can recall to just get applications, period. No one is applying online or in person.
- We have growing concerns/pressures: labor market, construction material costs and construction workers.
- People don't want to work.
- Wages are increasing because everyone is trying to hire at the same time. Prices will have to increase.
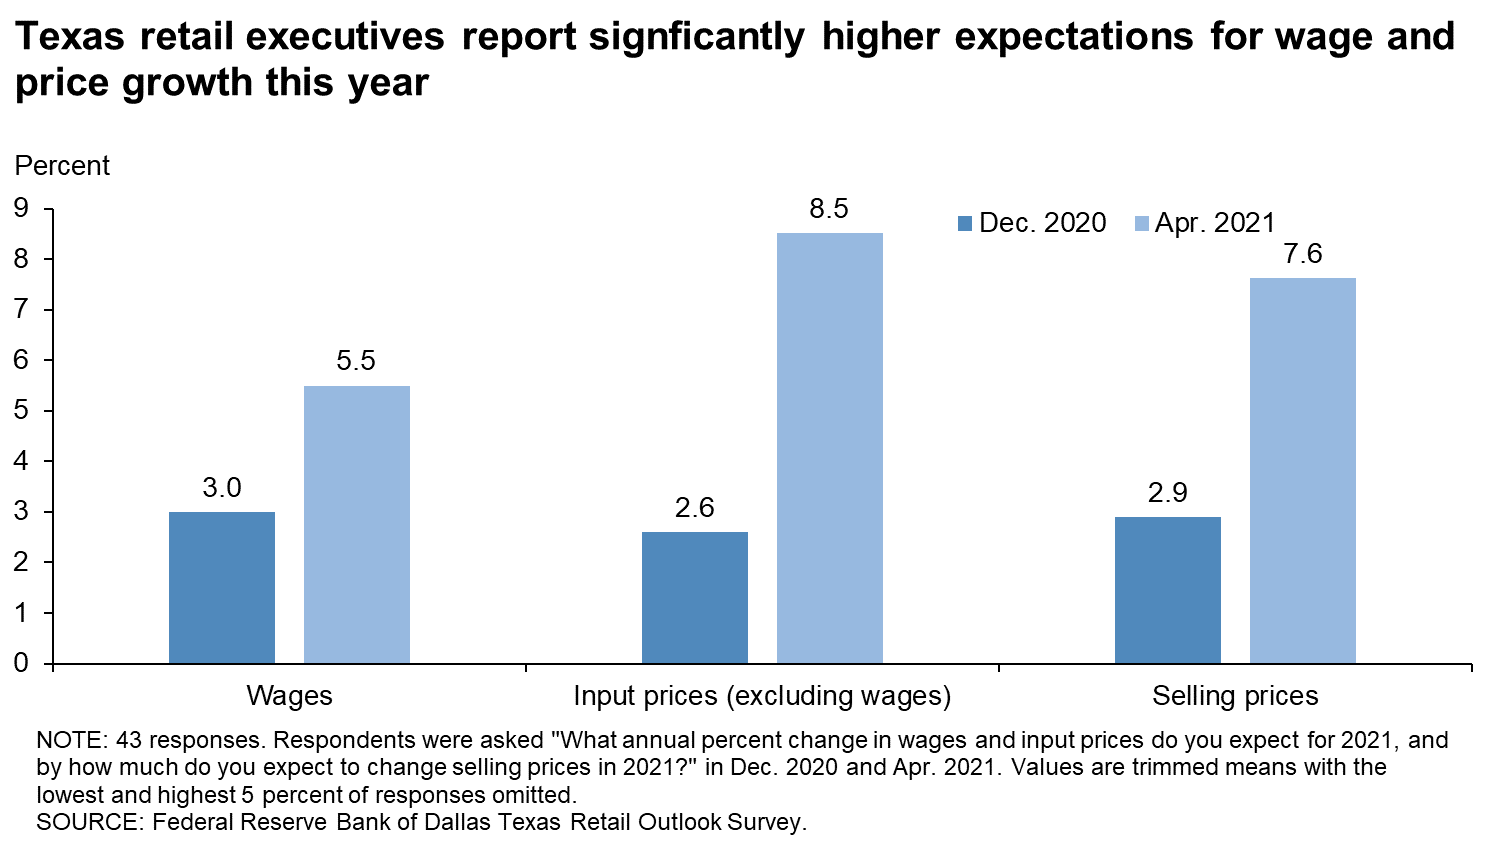
Texas Retail Outlook Survey
Data were collected April 13–21, and 48 Texas retailers responded to the surveys.
| 2018 | 2019 | 2020 | 2021 | |||||
| Expected (percent) |
Actual (percent) |
Expected (percent) |
Actual (percent) |
Expected (percent) |
Actual (percent) |
Expected (percent) |
Expected (percent) |
|
| Wages | 4.5 | 4.9 | 3.1 | 4.1 | 3.4 | 1.1 | 3.0 | 5.5 |
| Input prices | 5.3 | 4.5 | 3.6 | 3.4 | 3.8 | 3.3 | 2.6 | 8.5 |
| Selling prices | 5.3 | 3.3 | 3.2 | 2.9 | 3.8 | 2.4 | 2.9 | 7.6 |
| Data collected | May '18 | Dec. '18 | Dec. '18 | Dec. '19 | Dec. '19 | Dec. '20 | Dec. '20 | Apr. '21 |
NOTES: 43 responses. Shown are averages calculated as trimmed means with the lowest and highest 5 percent of responses omitted.
| May '20 (percent) |
Aug. '20 (percent) |
Nov. '20 (percent) |
Feb. '21 (percent) |
Apr. '21 (percent) |
|
| Share of firms reporting reduced revenues | 90.7 | 67.9 | 66.7 | 59.5 | 47.8 |
| Average revenue decline (Y/Y) | -35.0 | -25.6 | -23.1 | -26.3 | -29.0 |
| Share of firms reporting increased revenues | 1.9 | 18.9 | 20.8 | 21.4 | 37.0 |
| Average revenue increase (Y/Y) | 20.0 | 21.8 | 30.3 | 18.8 | 14.3 |
| Share of firms reporting no change in revenues | 7.4 | 13.2 | 12.5 | 19.0 | 15.2 |
NOTES: 46 responses. In past months the question wording was adjusted to reference the respective month of comparison. Averages are calculated as trimmed means with the lowest and highest 7.5 percent of responses omitted. Average revenue decline is calculated using only responses from firms that reported reduced revenues. Average revenue increase is calculated using only responses from firms that reported increased revenues.
| Aug. '20 (percent) |
Nov. '20 (percent) |
Feb. '21 (percent) |
Apr. '21 (percent) |
|
| Share of firms reporting reduced head count | 45.3 | 46.9 | 37.2 | 40.0 |
| Average head count decline (compared with Feb. 2020 levels) | -27.0 | -25.6 | -30.0 | -37.4 |
| Share of firms reporting increased head count | 13.2 | 12.2 | 20.9 | 28.9 |
| Average head count increase (compared with Feb. 2020 levels) | 20.0 | 8.7 | 6.2 | 6.8 |
| Share of firms reporting no change in head count | 41.5 | 40.8 | 41.9 | 31.1 |
NOTES: 45 responses. Averages are calculated as trimmed means with the lowest and highest 7.5 percent of responses omitted. Average head count decline is calculated using only responses from firms that reported reduced head count. Average head count increase is calculated using only responses from firms that reported increased head count.
| Apr. '21 (percent) |
|||||
| Yes | 56.5 | ||||
| No | 43.5 |
NOTE: 46 responses.
| Apr. '21 (percent) |
||
| Lack of available applicants/no applicants | 80.0 | |
| Lack of technical competencies (hard skills) | 56.0 | |
| Generous unemployment benefits | 48.0 | |
| Lack of experience | 32.0 | |
| Inability to pass drug test and/or background check | 32.0 | |
| Workers looking for more pay than is offered | 24.0 | |
| Lack of workplace competencies (soft skills) | 24.0 | |
| Lack of child care | 12.0 | |
| Fear of COVID-19 infection | 4.0 | |
| Other | 4.0 | |
| None | 0.0 |
NOTES: 25 responses. This question was only posed to those currently trying to hire or recall workers.
Special Questions Comments
These comments have been edited for publication.
- We hear regularly that unemployment benefits are too good [for people] to want to work.
- The problem of lack of technical competencies is confined to service techs.
- We are seeing major inventory issues.
- We stayed fully employed in 2020 and remain constant for 2021.
Questions regarding the Texas Business Outlook Surveys can be addressed to Emily Kerr at emily.kerr@dal.frb.org.
Sign up for our email alert to be automatically notified as soon as the latest surveys are released on the web.