Special Questions

Special Questions
Texas Business Outlook Surveys
Data were collected July 13–21, and 368 Texas business executives responded to the surveys.
| May '20 (percent) |
Aug. '20 (percent) |
Nov. '20 (percent) |
Feb. '21 (percent) |
Jul. '21 (percent) |
|
| Share of firms reporting reduced revenues | 81.2 | 68.3 | 63.7 | 56.5 | 45.8 |
| Average revenue decline (Y/Y) | -38.3 | -29.9 | -28.7 | -26.7 | -28.8 |
| Share of firms reporting increased revenues | 10.2 | 18.3 | 19.9 | 23.3 | 35.8 |
| Average revenue increase (Y/Y) | 20.1 | 17.6 | 17.7 | 15.8 | 16.3 |
| Share of firms reporting no change in revenues | 8.6 | 13.4 | 16.4 | 20.2 | 18.3 |
NOTES: 349 responses. In past months the question wording was adjusted to reference the respective month of comparison. Averages are calculated as trimmed means with the lowest and highest 7.5 percent of responses omitted. Average revenue decline is calculated using only responses from firms that reported reduced revenues. Average revenue increase is calculated using only responses from firms that reported increased revenues.
| Jun '20 (percent) |
Aug. '20 (percent) |
Nov. '20 (percent) |
Feb. '21 (percent) |
Jul. '21 (percent) |
|
| Share of firms reporting reduced head count | 43.0 | 51.4 | 51.1 | 47.3 | 46.3 |
| Average head count decline (compared with Feb. 2020 levels) | -26.5 | -27.2 | -28.4 | -25.4 | -32.0 |
| Share of firms reporting increased head count | 12.3 | 15.4 | 13.2 | 21.0 | 25.4 |
| Average head count increase (compared with Feb. 2020 levels) | 10.8 | 21.0 | 15.2 | 10.8 | 11.6 |
| Share of firms reporting no change in head count | 44.6 | 33.2 | 35.7 | 31.7 | 28.3 |
NOTES: 350 responses. Averages are calculated as trimmed means with the lowest and highest 7.5 percent of responses omitted. Average head count decline is calculated using only responses from firms that reported reduced head count. Average head count increase is calculated using only responses from firms that reported increased head count.
| Apr. '21 (percent) |
Jun. '21 (percent) |
Jul. '21 (percent) |
|
| Yes | 60.1 | 60.3 | 68.7 |
| No | 39.9 | 39.7 | 31.3 |
NOTE: 358 responses.
| Apr. '21 (percent) |
Jun. '21 (percent) |
Jul. '21 (percent) |
|
| Lack of available applicants/no applicants | 66.7 | 70.4 | 75.9 |
| Workers looking for more pay than is offered | 33.8 | 42.5 | 40.8 |
| Generous unemployment benefits | 47.7 | 47.3 | 39.6 |
| Lack of technical competencies (hard skills) | 41.2 | 37.2 | 35.1 |
| Lack of experience | 38.4 | 30.1 | 32.2 |
| Lack of workplace competencies (soft skills) | 26.9 | 27.0 | 25.7 |
| Inability to pass drug test and/or background check | 19.9 | 21.7 | 22.9 |
| Lack of child care | 11.6 | 13.3 | 11.4 |
| Fear of COVID-19 infection | 8.3 | 8.4 | 6.5 |
| Other | 10.6 | 6.2 | 7.8 |
| None | 9.7 | 5.3 | 0.0 |
NOTES: 245 responses. This question was only posed to those currently trying to hire or recall workers.
| Jun. '21 (percent) |
Jul. '21 (percent) |
|
| Improved significantly | 0.0 | 0.5 |
| Improved slightly | 17.0 | 24.9 |
| No change | 47.8 | 47.6 |
| Worsened slightly | 20.1 | 16.8 |
| Worsened significantly | 15.1 | 10.3 |
NOTES: 185 responses. This question was only posed to those noting a lack of available applicants/no applicants.
| Dec. '18 (percent) |
Aug. '19 (percent) |
May '21 (percent) |
Jul. '21 (percent) |
|
| None | 24.4 | 41.0 | 36.0 | 41.3 |
| Some | 49.2 | 43.9 | 38.4 | 37.5 |
| Most | 18.1 | 10.4 | 16.7 | 14.1 |
| All | 8.4 | 4.6 | 8.9 | 7.2 |
NOTE: 320 responses.
| May '21 (percent) |
Jul. '21 (percent) |
|
| Price increases this year | 77.9 | 83.4 |
| Price increases next year | 34.7 | 33.2 |
| Offering variable pricing or adding contract contingencies to allow for rising input costs | 9.9 | 13.9 |
| Offering reduced product or service for the same price | 12.7 | 6.4 |
| Other | 9.4 | 6.4 |
NOTES: 187 responses. This question was posed only to those passing at least some of the higher costs on to customers.
| 2019 | 2020 | 2021 | 2022 | |||||
| Expected (percent) |
Actual (percent) |
Expected (percent) |
Actual (percent) |
Expected (percent) |
Expected (percent) |
Expected (percent) |
Expected (percent) |
|
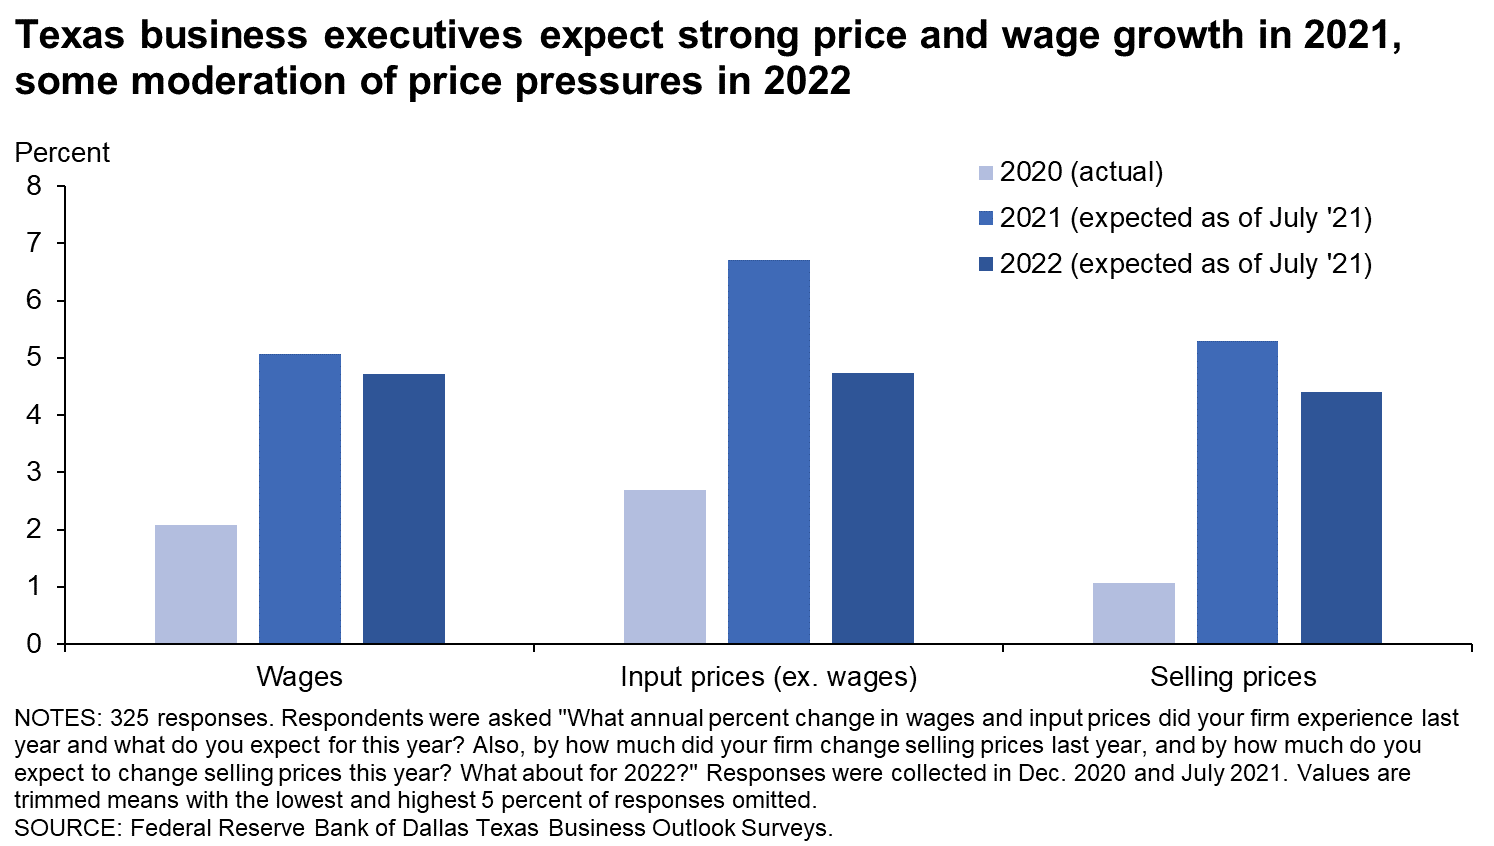
| Wages | 4.0 | 3.9 | 3.8 | 2.1 | 4.3 | 4.7 | 5.1 | 4.7 |
| Input prices | 3.8 | 3.4 | 3.3 | 2.7 | 3.7 | 5.5 | 6.7 | 4.7 |
| Selling prices | 2.8 | 2.4 | 2.8 | 1.1 | 3.4 | 4.3 | 5.3 | 4.4 |
| Data collected | Dec. '18 | Dec. '19 | Dec. '19 | Dec. '20 | Dec. '20 | Apr. '21 | Jul. '21 | Jul. '21 |
NOTES: 325 responses. Averages are calculated as trimmed means with the lowest and highest 5 percent of responses omitted.
Survey respondents were given the opportunity to provide comments. These comments can be found on the individual survey Special Questions results pages, accessible by the tabs above.
Texas Manufacturing Outlook Survey
Data were collected July 13–21, and 99 Texas manufacturers responded to the survey.
| May '20 (percent) |
Aug. '20 (percent) |
Nov. '20 (percent) |
Feb. '21 (percent) |
Jul. '21 (percent) |
|
| Share of firms reporting reduced revenues | 78.0 | 68.6 | 57.7 | 55.7 | 46.8 |
| Average revenue decline (Y/Y) | -38.6 | -28.7 | -30.7 | -26.0 | -34.9 |
| Share of firms reporting increased revenues | 16.5 | 20.0 | 29.8 | 30.7 | 38.3 |
| Average revenue increase (Y/Y) | 19.1 | 24.6 | 19.3 | 17.7 | 15.5 |
| Share of firms reporting no change in revenues | 5.5 | 11.4 | 12.5 | 13.6 | 14.9 |
NOTES: 94 responses. In past months the question wording was adjusted to reference the respective month of comparison. Averages are calculated as trimmed means with the lowest and highest 7.5 percent of responses omitted. Average revenue decline is calculated using only responses from firms that reported reduced revenues. Average revenue increase is calculated using only responses from firms that reported increased revenues.
| Jun '20 (percent) |
Aug. '20 (percent) |
Nov. '20 (percent) |
Feb. '21 (percent) |
Jul. '21 (percent) |
|
| Share of firms reporting reduced head count | 42.6 | 47.6 | 49.0 | 47.7 | 51.6 |
| Average head count decline (compared with Feb. 2020 levels) | -20.7 | -23.9 | -24.5 | -26.8 | -30.0 |
| Share of firms reporting increased head count | 15.7 | 21.9 | 17.3 | 25.0 | 26.3 |
| Average head count increase (compared with Feb. 2020 levels) | 9.2 | 17.1 | 22.0 | 15.1 | 12.7 |
| Share of firms reporting no change in head count | 41.7 | 30.5 | 33.7 | 27.3 | 22.1 |
NOTES: 95 responses. Averages are calculated as trimmed means with the lowest and highest 7.5 percent of responses omitted. Average head count decline is calculated using only responses from firms that reported reduced head count. Average head count increase is calculated using only responses from firms that reported increased head count.
| Apr. '21 (percent) |
Jun. '21 (percent) |
Jul. '21 (percent) |
|
| Yes | 70.7 | 69.3 | 80.2 |
| No | 29.3 | 30.7 | 19.8 |
NOTE: 96 responses.
| Apr. '21 (percent) |
Jun. '21 (percent) |
Jul. '21 (percent) |
|
| Lack of available applicants/no applicants | 75.7 | 77.1 | 84.4 |
| Generous unemployment benefits | 60.0 | 55.7 | 51.9 |
| Workers looking for more pay than is offered | 32.9 | 47.1 | 44.2 |
| Lack of technical competencies (hard skills) | 51.4 | 42.9 | 40.3 |
| Lack of experience | 42.9 | 35.7 | 37.7 |
| Inability to pass drug test and/or background check | 30.0 | 28.6 | 29.9 |
| Lack of workplace competencies (soft skills) | 32.9 | 30.0 | 24.7 |
| Lack of child care | 8.6 | 11.4 | 9.1 |
| Fear of COVID-19 infection | 2.9 | 4.3 | 3.9 |
| Other | 10.0 | 5.7 | 5.2 |
| None | 4.3 | 1.4 | 0.0 |
NOTES: 77 responses. This question was only posed to those currently trying to hire or recall workers.
| Jun. '21 (percent) |
Jul. '21 (percent) |
|
| Improved significantly | 0.0 | 1.5 |
| Improved slightly | 13.0 | 20.0 |
| No change | 44.4 | 50.8 |
| Worsened slightly | 24.1 | 15.4 |
| Worsened significantly | 18.5 | 12.3 |
NOTES: 65 responses. This question was only posed to those noting a lack of available applicants/no applicants.
| Dec. '18 (percent) |
Aug. '19 (percent) |
May '21 (percent) |
Jul. '21 (percent) |
|
| None | 17.2 | 40.6 | 15.2 | 24.2 |
| Some | 50.5 | 45.5 | 44.6 | 41.8 |
| Most | 23.2 | 9.9 | 29.3 | 24.2 |
| All | 9.1 | 4.0 | 10.9 | 9.9 |
NOTE: 91 responses.
| May '21 (percent) |
Jul. '21 (percent) |
|
| Price increases this year | 84.6 | 88.4 |
| Price increases next year | 24.4 | 33.3 |
| Offering variable pricing or adding contract contingencies to allow for rising input costs | 20.5 | 18.8 |
| Offering reduced product or service for the same price | 16.7 | 4.3 |
| Other | 7.7 | 2.9 |
NOTES: 69 responses. This question was posed only to those passing at least some of the higher costs on to customers.
| 2019 | 2020 | 2021 | 2022 | |||||
| Expected (percent) |
Actual (percent) |
Expected (percent) |
Actual (percent) |
Expected (percent) |
Expected (percent) |
Expected (percent) |
Expected (percent) |
|
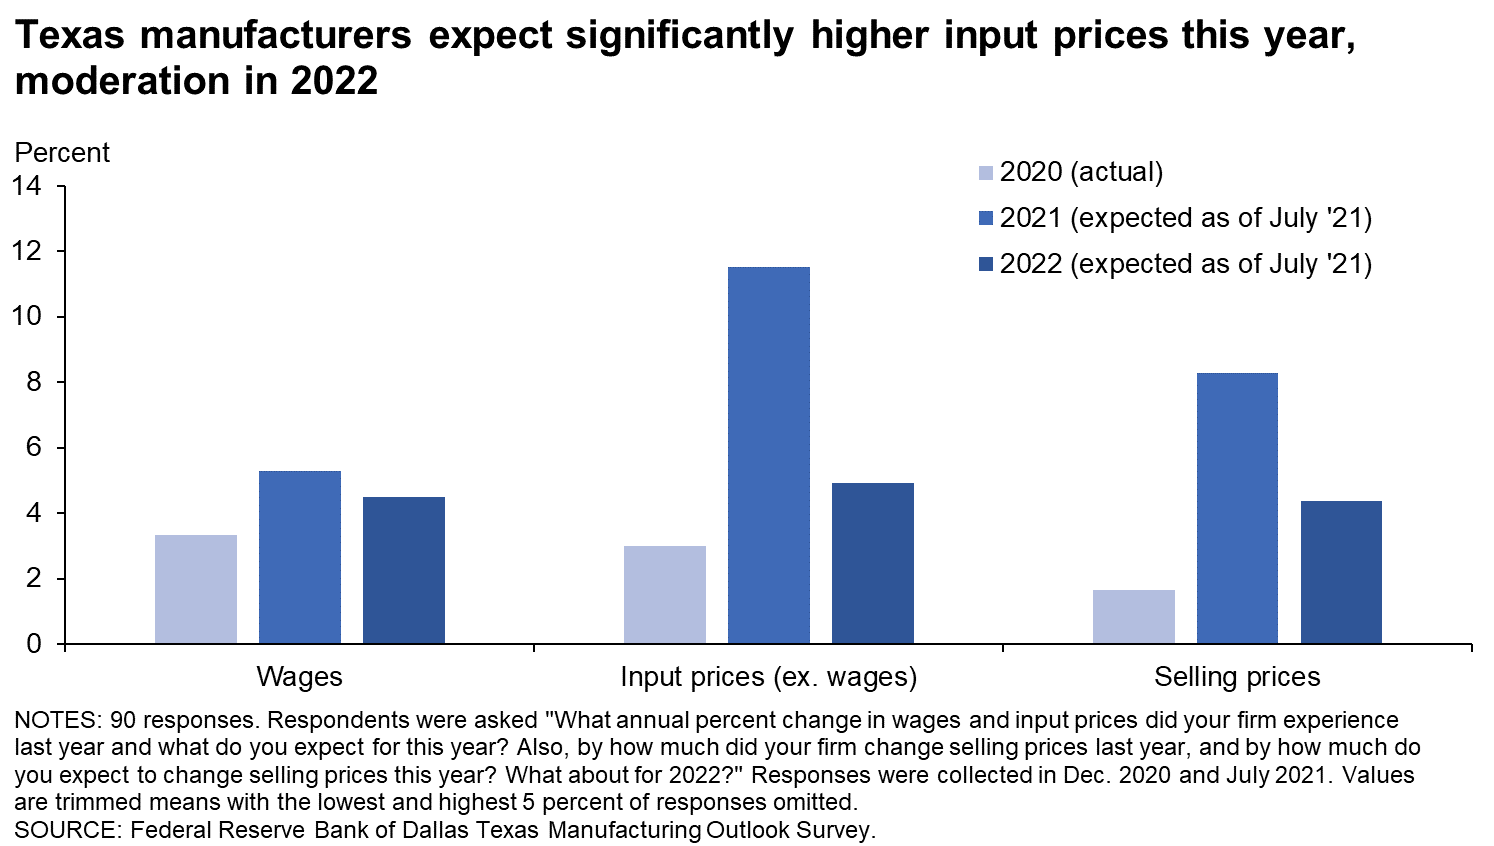
| Wages | 3.9 | 3.4 | 3.5 | 3.3 | 4.2 | 4.5 | 5.3 | 4.5 |
| Input prices | 4.0 | 3.2 | 3.2 | 3.0 | 4.6 | 8.8 | 11.5 | 4.9 |
| Selling prices | 3.0 | 2.2 | 3.0 | 1.6 | 3.9 | 6.5 | 8.3 | 4.4 |
| Data collected | Dec. '18 | Dec. '19 | Dec. '19 | Dec. '20 | Dec. '20 | Apr. '21 | Jul. '21 | Jul. '21 |
NOTES: 90 responses. Averages are calculated as trimmed means with the lowest and highest 5 percent of responses omitted.
Special Questions Comments
These comments have been edited for publication.
- Raw aluminum prices continue to rise to unprecedented levels. Section 232 tariffs as well as Russian export duties on aluminum will continue to support these higher levels.
- We do not have a feel for material price increases after 2021. We are still experiencing increases and shortages of materials and haven’t received any true sign of relief. We have received our first notice of force majeure taking effect from one of our suppliers.
- It is very competitive for new business contract awards, suppressing the ability to raise margins. In reality, margins have narrowed.
- We only hope the availability of materials improves and the pricing of materials declines over the next six months. Also, we hope that the president will not give out so much unemployment. This prevents a lot of hourly workers from wanting a job.
- We continue to struggle to bring in qualified applicants that are physically capable of handling the grueling workload. Material pricing and availability are only getting worse. We’re receiving almost monthly price increases from some of our suppliers. Other suppliers are having difficulty getting material in-house to make our products and, thus, are increasing their lead times beyond what is acceptable. This is forcing us to re-source material at suppliers that were already more expensive pre-COVID. It doesn’t appear to be easing up; expectations are that the supply crunch will only get worse by the end of the summer.
- Some prices will go up and others will go down, so the net will be unchanged.
- Wages and raw materials costs are increasing at double-digit rates. There is constant pressure to reduce our sales price.
Texas Service Sector Outlook Survey
Data were collected July 13–21, and 269 Texas business executives responded to the survey.
| May '20 (percent) |
Aug. '20 (percent) |
Nov. '20 (percent) |
Feb. '21 (percent) |
Jul. '21 (percent) |
|
| Share of firms reporting reduced revenues | 82.5 | 68.2 | 66.0 | 56.8 | 45.5 |
| Average revenue decline (Y/Y) | -38.4 | -30.5 | -28.1 | -27.3 | -27.2 |
| Share of firms reporting increased revenues | 7.7 | 17.7 | 16.0 | 20.5 | 34.9 |
| Average revenue increase (Y/Y) | 23.1 | 16.6 | 16.4 | 14.7 | 14.1 |
| Share of firms reporting no change in revenues | 9.9 | 14.1 | 17.9 | 22.7 | 19.6 |
NOTES: 255 responses. In past months the question wording was adjusted to reference the respective month of comparison. Averages are calculated as trimmed means with the lowest and highest 7.5 percent of responses omitted. Average revenue decline is calculated using only responses from firms that reported reduced revenues. Average revenue increase is calculated using only responses from firms that reported increased revenues.
| Jun '20 (percent) |
Aug. '20 (percent) |
Nov. '20 (percent) |
Feb. '21 (percent) |
Jul. '21 (percent) |
|
| Share of firms reporting reduced head count | 43.2 | 52.8 | 51.9 | 47.1 | 44.3 |
| Average head count decline (compared with Feb. 2020 levels) | -29.3 | -28.8 | -30.4 | -24.9 | -33.4 |
| Share of firms reporting increased head count | 11.0 | 13.0 | 11.7 | 19.4 | 25.1 |
| Average head count increase (compared with Feb. 2020 levels) | 12.8 | 23.7 | 11.1 | 9.8 | 11.4 |
| Share of firms reporting no change in head count | 45.8 | 34.2 | 36.5 | 33.5 | 30.6 |
NOTES: 255 responses. Averages are calculated as trimmed means with the lowest and highest 7.5 percent of responses omitted. Average head count decline is calculated using only responses from firms that reported reduced head count. Average head count increase is calculated using only responses from firms that reported increased head count.
| Apr. '21 (percent) |
Jun. '21 (percent) |
Jul. '21 (percent) |
|
| Yes | 56.1 | 57.0 | 64.5 |
| No | 43.9 | 43.0 | 35.5 |
NOTE: 262 responses.
| Apr. '21 (percent) |
Jun. '21 (percent) |
Jul. '21 (percent) |
|
| Lack of available applicants/no applicants | 62.3 | 67.3 | 72.0 |
| Workers looking for more pay than is offered | 34.2 | 40.4 | 39.3 |
| Generous unemployment benefits | 41.8 | 43.6 | 33.9 |
| Lack of technical competencies (hard skills) | 36.3 | 34.6 | 32.7 |
| Lack of experience | 36.3 | 27.6 | 29.8 |
| Lack of workplace competencies (soft skills) | 24.0 | 25.6 | 26.2 |
| Inability to pass drug test and/or background check | 15.1 | 18.6 | 19.6 |
| Lack of child care | 13.0 | 14.1 | 12.5 |
| Fear of COVID-19 infection | 11.0 | 10.3 | 7.7 |
| Other | 11.0 | 6.4 | 8.9 |
| None | 12.3 | 7.1 | 0.0 |
NOTES: 168 responses. This question was only posed to those currently trying to hire or recall workers.
| Jun. '21 (percent) |
Jul. '21 (percent) |
|
| Improved significantly | 0.0 | 0.0 |
| Improved slightly | 19.0 | 27.5 |
| No change | 49.5 | 45.8 |
| Worsened slightly | 18.1 | 17.5 |
| Worsened significantly | 13.3 | 9.2 |
NOTES: 120 responses. This question was only posed to those noting a lack of available applicants/no applicants.
| Dec. '18 (percent) |
Aug. '19 (percent) |
May '21 (percent) |
Jul. '21 (percent) |
|
| None | 28.0 | 41.2 | 43.9 | 48.0 |
| Some | 48.5 | 43.3 | 36.1 | 35.8 |
| Most | 15.5 | 10.6 | 11.9 | 10.0 |
| All | 8.0 | 4.9 | 8.2 | 6.1 |
NOTE: 229 responses.
| May '21 (percent) |
Jul. '21 (percent) |
|
| Price increases this year | 74.1 | 80.5 |
| Price increases next year | 40.7 | 33.1 |
| Offering variable pricing or adding contract contingencies to allow for rising input costs | 3.7 | 11.0 |
| Offering reduced product or service for the same price | 10.4 | 7.6 |
| Other | 10.4 | 8.5 |
NOTES: 118 responses. This question was posed only to those passing at least some of the higher costs on to customers.
| 2019 | 2020 | 2021 | 2022 | |||||
| Expected (percent) |
Actual (percent) |
Expected (percent) |
Actual (percent) |
Expected (percent) |
Expected (percent) |
Expected (percent) |
Expected (percent) |
|
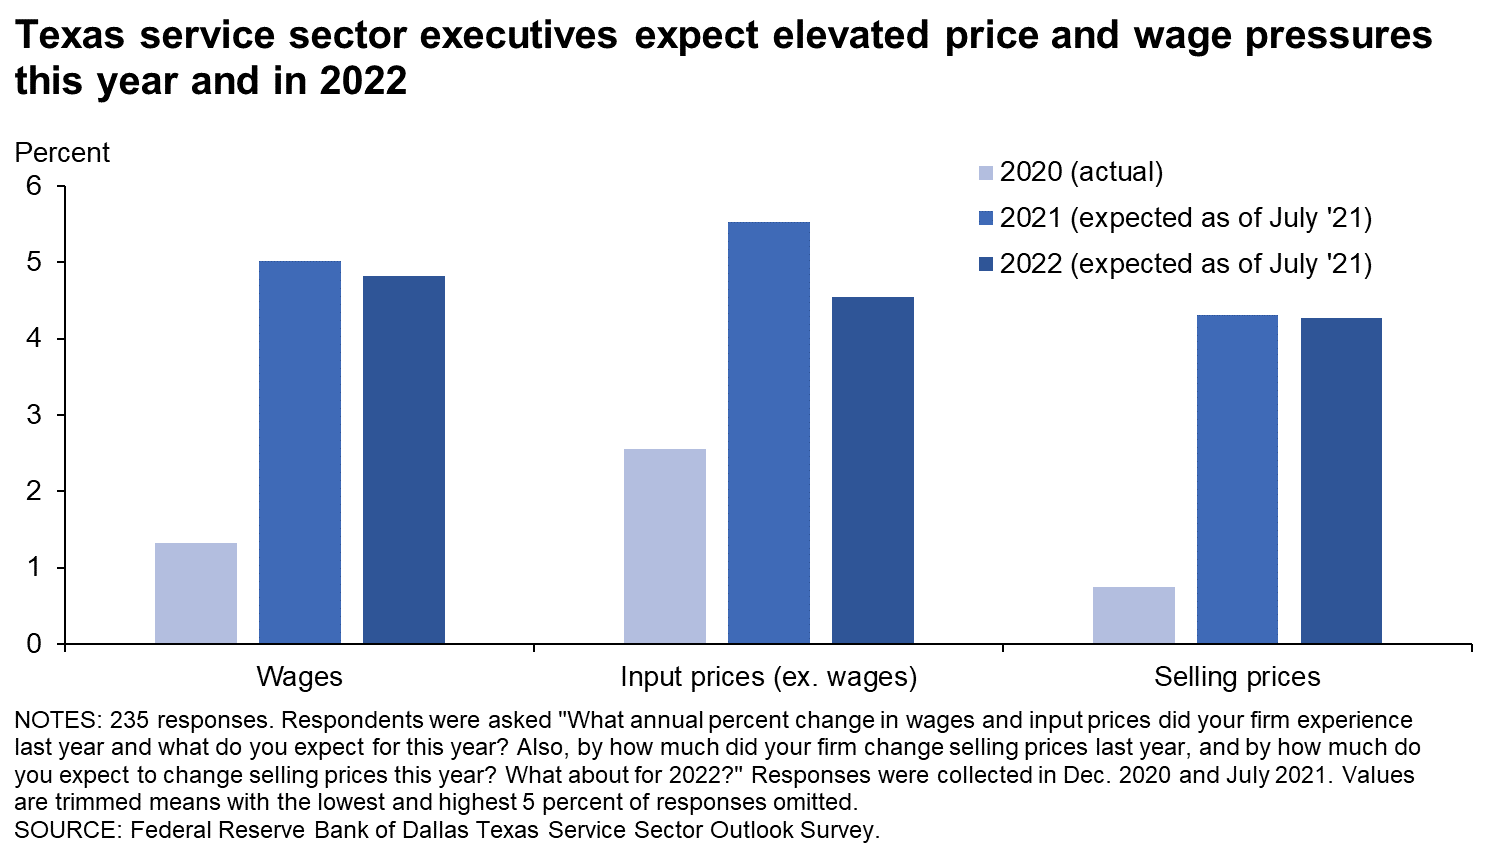
| Wages | 4.0 | 4.1 | 3.9 | 1.3 | 4.4 | 4.8 | 5.0 | 4.8 |
| Input prices | 3.8 | 3.5 | 3.4 | 2.6 | 3.2 | 4.3 | 5.5 | 4.5 |
| Selling prices | 2.7 | 2.5 | 2.7 | 0.8 | 3.2 | 3.8 | 4.3 | 4.3 |
| Data collected | Dec. '18 | Dec. '19 | Dec. '19 | Dec. '20 | Dec. '20 | Apr. '21 | Jul. '21 | Jul. '21 |
NOTES: 235 responses. Averages are calculated as trimmed means with the lowest and highest 5 percent of responses omitted.
Special Questions Comments
These comments have been edited for publication.
- Currently, we’re having trouble getting parts, especially if they have any electronics in them. We’re watching inflation to take steps to stay ahead of it.
- We are passing the estimated 15 percent increase to all of our clients. We don’t have any information on 2022.
- Increases in selling prices would be for new business only.
- Our top concern is COVID resurgence, which would hurt the economy again. Inflation is also a concern. Lack of a talented workforce is also a key concern.
- Wage pressure is extreme in some parts due to the government paying people to not work ... so those that will work are pursued by every competitor I have!
- We resell equipment and usually use a fairly fixed margin, so if our input prices for products increase, we instantly increase our resell prices. Services prices are different and we have to remain competitive, but if we increase wages, we usually increase prices by a similar percentage.
- Our outlook is for continued expansion in the Dallas–Fort Worth economy, which we expect will result in expanded services to existing clients and new client acquisitions. The availability of existing candidates for expanding our staff remains an issue. Salary inflation is a concern going into 2022.
- I calculated input prices as a cost [in deciding whether] to upgrade equipment and other items related to our services that we held off doing last year. Wages are increasing through some pay increases and a lot of overtime. We are increasing some hourly rates midyear in 2021 due to high demand and plan to increase all hourly rates in 2022.
- Bank PPP [Paycheck Protection Program] fee revenue for July was up substantially. Bank PPP fees will not be up next month.
- Supplier prices are all over the place. Prices are quoted as only good for 15 days in some cases.
- In health care, especially services focused on the Medicare and Medicaid population, any increase in service costs has to be absorbed by the health care service provider. The increase in wages has been substantial (almost 20 percent from last year and maybe another 10 percent next year) without any ability to pass the cost out to consumers. Therefore, employee productivity is one key aspect that we as service providers focus on.
- Wage increases, sign-on bonuses, etc., have yet to draw people back to the labor force, so though we are and will be offering more wages, we are also working on how to provide the same or better services and care with fewer staff. In addition to the costs of wages and goods and services, insurance costs—property and liability insurance, health insurance, etc.—have increased the greatest percentage by far: 300 percent in price and five times the deductible amounts to levels almost unsustainable to cover by reasonable revenues, especially when our primary payers are fixed state and government payers.
- We are going to have to increase foot traffic and the number of customers to offset increased costs.
- We are in a competitive marketplace. If we increase prices too drastically, guests will just go somewhere else. We have to be very careful with big price increases. But wages and prices are going up significantly. How we handle this will define our path and business going forward. Brutal.
- We have increased wages to attract applicants, Over the next month, I will be raising some pricing on the top five sellers on my menu. I have also cut out [meal delivery services], which were too costly for small businesses, and working to bring in orders directly to us. Some pricing for cost of goods has continued to stay high; on select items, there has been a price increase as well after adjusting for discounts.
- We are in the food business, so we have to make changes quicker. Food costs in some areas are the same and in other areas are through the roof.
- I have experienced a dramatic shift in work dynamics with applicants and existing employees. We will schedule about 10 interviews from applicants submitting email resumes and confirming interview appointments. On average, 30 percent of the applicants actually show up for the scheduled interview. Too many of those that do show up are still not worth hiring. When we do hire, there is a 95 percent chance new employees will not last one month. Existing employees are cutting back on working hours by their own choice and then complain they are not making enough money and want pay raises. The average mindset of existing employees (from my experience) is that they now view 28 to 32 hours of work per week as full-time employment. It is extremely difficult to get employees to work 40 hours per week. Less than 8 percent of employees, including managers, work 40 hours per week.
Texas Retail Outlook Survey
Data were collected July 13–21, and 47 Texas retailers responded to the survey.
| May '20 (percent) |
Aug. '20 (percent) |
Nov. '20 (percent) |
Feb. '21 (percent) |
Jul. '21 (percent) |
|
| Share of firms reporting reduced revenues | 90.7 | 67.9 | 66.7 | 59.5 | 55.8 |
| Average revenue decline (Y/Y) | -35.0 | -25.6 | -23.1 | -26.3 | -17.0 |
| Share of firms reporting increased revenues | 1.9 | 18.9 | 20.8 | 21.4 | 32.6 |
| Average revenue increase (Y/Y) | 20.0 | 21.8 | 30.3 | 18.8 | 15.8 |
| Share of firms reporting no change in revenues | 7.4 | 13.2 | 12.5 | 19.0 | 11.6 |
NOTES: 43 responses. In past months the question wording was adjusted to reference the respective month of comparison. Averages are calculated as trimmed means with the lowest and highest 7.5 percent of responses omitted. Average revenue decline is calculated using only responses from firms that reported reduced revenues. Average revenue increase is calculated using only responses from firms that reported increased revenues.
| Jun '20 (percent) |
Aug. '20 (percent) |
Nov. '20 (percent) |
Feb. '21 (percent) |
Jul. '21 (percent) |
|
| Share of firms reporting reduced head count | 41.2 | 45.3 | 46.9 | 37.2 | 45.5 |
| Average head count decline (compared with Feb. 2020 levels) | -26.1 | -27.0 | -25.6 | -30.0 | -32.2 |
| Share of firms reporting increased head count | 7.8 | 13.2 | 12.2 | 20.9 | 22.7 |
| Average head count increase (compared with Feb. 2020 levels) | 11.3 | 20.0 | 8.7 | 6.2 | 7.1 |
| Share of firms reporting no change in head count | 51.0 | 41.5 | 40.8 | 41.9 | 31.8 |
NOTES: 44 responses. Averages are calculated as trimmed means with the lowest and highest 7.5 percent of responses omitted. Average head count decline is calculated using only responses from firms that reported reduced head count. Average head count increase is calculated using only responses from firms that reported increased head count.
| Apr. '21 (percent) |
Jun. '21 (percent) |
Jul. '21 (percent) |
|
| Yes | 56.5 | 53.2 | 71.1 |
| No | 43.5 | 46.8 | 28.9 |
NOTE: 45 responses.
| Apr. '21 (percent) |
Jun. '21 (percent) |
Jul. '21 (percent) |
|
| Lack of available applicants/no applicants | 80.0 | 76.0 | 84.4 |
| Generous unemployment benefits | 48.0 | 52.0 | 53.1 |
| Workers looking for more pay than is offered | 24.0 | 36.0 | 43.8 |
| Lack of technical competencies (hard skills) | 56.0 | 48.0 | 40.6 |
| Inability to pass drug test and/or background check | 32.0 | 36.0 | 40.6 |
| Lack of workplace competencies (soft skills) | 24.0 | 36.0 | 31.3 |
| Lack of experience | 32.0 | 32.0 | 31.3 |
| Lack of child care | 12.0 | 12.0 | 12.5 |
| Fear of COVID-19 infection | 4.0 | 4.0 | 9.4 |
| Other | 4.0 | 8.0 | 9.4 |
| None | 0.0 | 4.0 | 0.0 |
NOTES: 32 responses. This question was only posed to those currently trying to hire or recall workers.
| Jun. '21 (percent) |
Jul. '21 (percent) |
|
| Improved significantly | 0.0 | 0.0 |
| Improved slightly | 15.8 | 37.0 |
| No change | 47.4 | 40.7 |
| Worsened slightly | 21.1 | 18.5 |
| Worsened significantly | 15.8 | 3.7 |
NOTES: 27 responses. This question was only posed to those noting a lack of available applicants/no applicants.
| Dec. '18 (percent) |
Aug. '19 (percent) |
May '21 (percent) |
Jul. '21 (percent) |
|
| None | 18.4 | 26.5 | 20.4 | 26.2 |
| Some | 52.6 | 53.1 | 51.0 | 35.7 |
| Most | 15.8 | 10.2 | 18.4 | 26.2 |
| All | 13.2 | 10.2 | 10.2 | 11.9 |
NOTE: 42 responses.
| May '21 (percent) |
Jul. '21 (percent) |
|
| Price increases this year | 71.8 | 90.3 |
| Price increases next year | 43.6 | 35.5 |
| Offering variable pricing or adding contract contingencies to allow for rising input costs | 2.6 | 12.9 |
| Offering reduced product or service for the same price | 10.3 | 3.2 |
| Other | 2.6 | 6.5 |
NOTES: 31 responses. This question was posed only to those passing at least some of the higher costs on to customers.
| 2019 | 2020 | 2021 | 2022 | |||||
| Expected (percent) |
Actual (percent) |
Expected (percent) |
Actual (percent) |
Expected (percent) |
Expected (percent) |
Expected (percent) |
Expected (percent) |
|
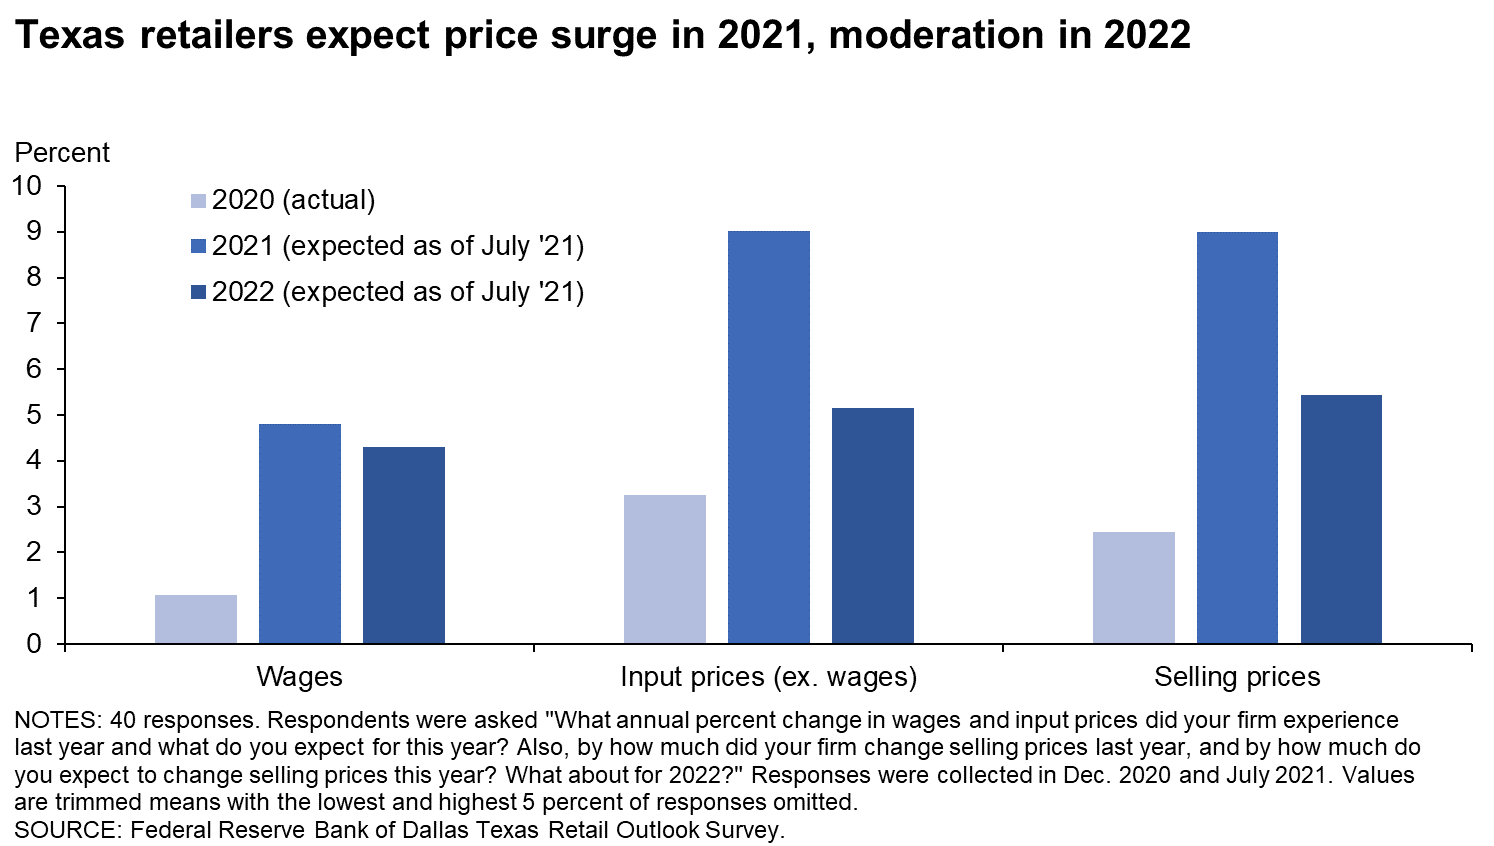
| Wages | 3.1 | 4.1 | 3.4 | 1.1 | 3.0 | 5.5 | 4.8 | 4.3 |
| Input prices | 3.6 | 3.4 | 3.8 | 3.3 | 2.6 | 8.5 | 9.0 | 5.1 |
| Selling prices | 3.2 | 2.9 | 3.8 | 2.4 | 2.9 | 7.6 | 9.0 | 5.4 |
| Data collected | Dec. '18 | Dec. '19 | Dec. '19 | Dec. '20 | Dec. '20 | Apr. '21 | Jul. '21 | Jul. '21 |
NOTES: 40 responses. Averages are calculated as trimmed means with the lowest and highest 5 percent of responses omitted.
Special Questions Comments
These comments have been edited for publication.
- The manufacturers have increased costs and reduced consumer rebates.
Questions regarding the Texas Business Outlook Surveys can be addressed to Emily Kerr at emily.kerr@dal.frb.org.
Sign up for our email alert to be automatically notified as soon as the latest surveys are released on the web.