Special Questions

Special Questions
Texas Business Outlook Surveys
Data were collected November 15–23, and 360 Texas business executives responded to the surveys.
| Feb '21 (percent) |
Jun '21 (percent) |
Sep '21 (percent) |
Nov '21 (percent) |
|
| Yes | 35.5 | 61.0 | 64.5 | 69.7 |
| No | 64.5 | 39.0 | 35.5 | 30.3 |
NOTE: 356 responses.
| Jun '21 (percent) |
Sep '21 (percent) |
Nov '21 (percent) |
|
| Improved significantly | 2.2 | 1.3 | 0.8 |
| Improved slightly | 16.6 | 17.3 | 18.3 |
| No change | 21.4 | 30.5 | 29.3 |
| Worsened slightly | 41.0 | 34.1 | 39.0 |
| Worsened significantly | 18.8 | 16.8 | 12.6 |
NOTES: 246 responses. This question was posed only to those who are experiencing supply-chain disruptions or delays.
| Jun '21 (percent) |
Sep '21 (percent) |
Nov '21 (percent) |
|
| Less than a month | 0.5 | 0.0 | 0.5 |
| 1–3 months | 8.9 | 8.4 | 7.0 |
| 4–6 months | 38.1 | 28.3 | 26.6 |
| 7–9 months | 24.3 | 22.0 | 19.6 |
| 10–12 months | 14.9 | 23.0 | 21.0 |
| More than a year | 13.4 | 18.3 | 25.2 |
NOTES: 248 responses. This question was only posed to those currently experiencing any supply-chain disruptions or delays. These calculations exclude respondents that answered “Not sure,” which represented 11.8 percent of responses in June ’21, 15.9 percent in Sep. ’21 and 13.7 percent in Nov. ’21.
| May '21 (percent) |
Aug '21 (percent) |
Nov '21 (percent) |
|
| Yes | 50.9 | 50.3 | 51.7 |
| No | 49.1 | 49.7 | 48.3 |
NOTE: 356 responses.
| May '21 (percent) |
Aug '21 (percent) |
Nov '21 (percent) |
|
| Not difficult | 2.1 | 1.7 | 2.2 |
| Somewhat difficult | 29.6 | 42.5 | 36.1 |
| Very difficult | 68.3 | 55.9 | 61.7 |
NOTES: 183 responses. This question was posed only to those trying to fill low-skill postions.
| May '21 (percent) |
Aug '21 (percent) |
Nov '21 (percent) |
|
| Yes | 55.4 | 61.3 | 57.5 |
| No | 44.6 | 38.7 | 42.5 |
NOTE: 355 responses.
| May '21 (percent) |
Aug '21 (percent) |
Nov '21 (percent) |
|
| Not difficult | 6.7 | 4.2 | 2.0 |
| Somewhat difficult | 44.7 | 49.1 | 45.8 |
| Very difficult | 48.6 | 46.7 | 52.2 |
NOTES: 203 responses. This question was posed only to those trying to fill mid-skill postions.
| May '21 (percent) |
Aug '21 (percent) |
Nov '21 (percent) |
|
| Yes | 45.2 | 47.4 | 46.8 |
| No | 54.8 | 52.6 | 53.2 |
NOTE: 355 responses.
| May '21 (percent) |
Aug '21 (percent) |
Nov '21 (percent) |
|
| Not difficult | 20.1 | 15.9 | 4.8 |
| Somewhat difficult | 45.6 | 38.8 | 45.8 |
| Very difficult | 34.3 | 45.3 | 49.4 |
NOTES: 166 responses. This question was posed only to those trying to fill high-skill postions.
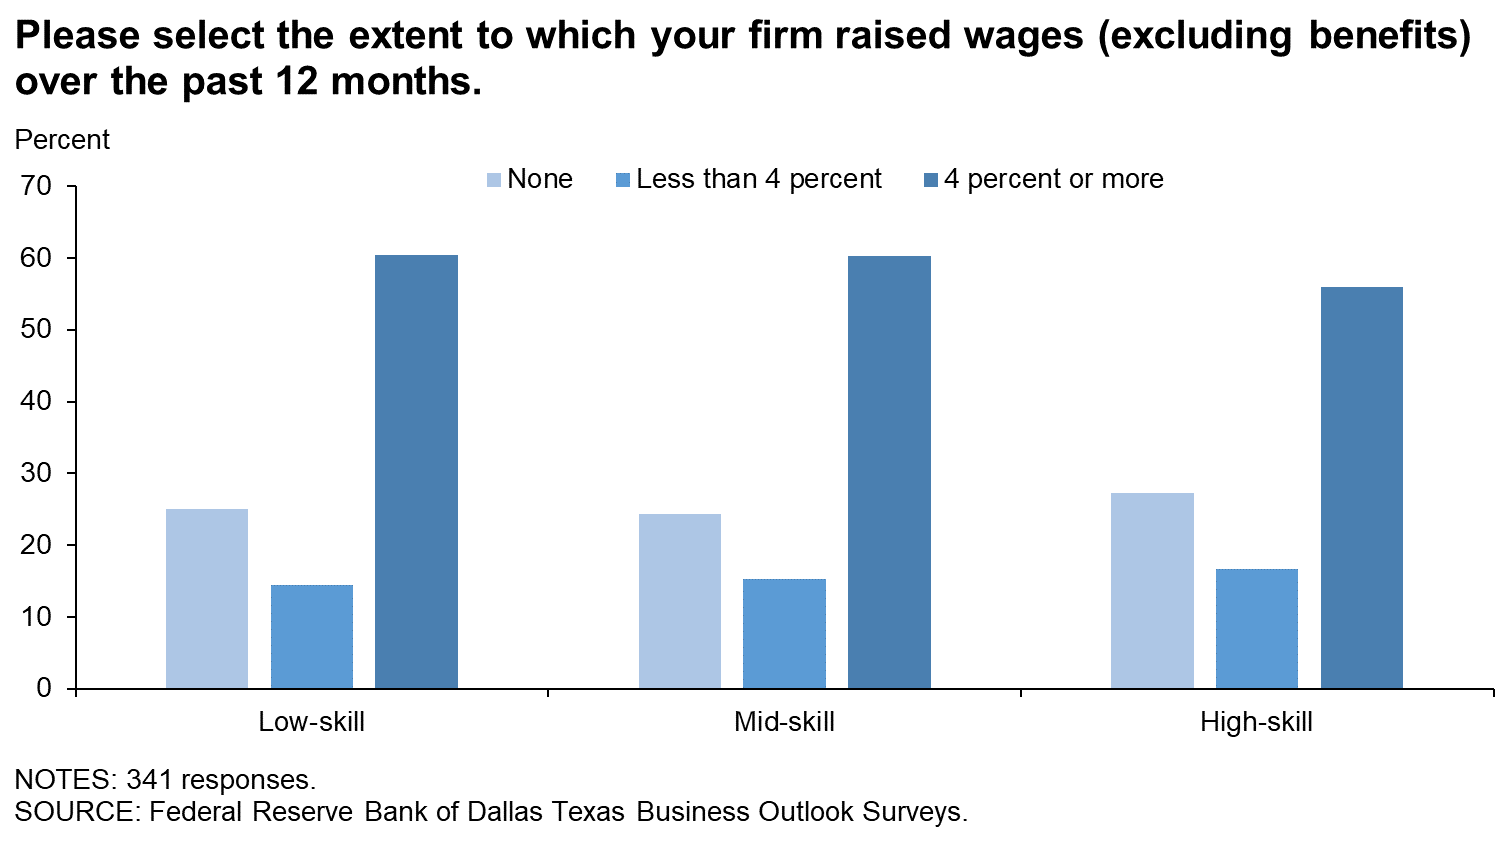
| Nov '18 (percent) |
Dec '19 (percent) |
Nov '21 (percent) |
|
| None | 23.5 | 22.2 | 25.0 |
| Less than 4 percent | 43.7 | 50.7 | 14.5 |
| 4 percent or more* | 32.8 | 27.2 | 60.5 |
| 4–7 percent | 20.9 | ||
| 8–11 percent | 17.2 | ||
| 12–15 percent | 10.8 | ||
| 16–19 percent | 4.7 | ||
| 20 percent or more | 7.0 |
*In Nov. '21, respondents were provided with more specific answer choices. We aggregated those responses into the "4 percent or more" category for comparison to prior periods and also provided the detailed breakouts.
NOTE: 344 responses.
| Nov '18 (percent) |
Dec '19 (percent) |
Nov '21 (percent) |
|
| None | 19.3 | 16.4 | 24.3 |
| Less than 4 percent | 44.9 | 49.3 | 15.4 |
| 4 percent or more* | 35.8 | 34.2 | 60.3 |
| 4–7 percent | 24.3 | ||
| 8–11 percent | 17.7 | ||
| 12–15 percent | 11.0 | ||
| 16–19 percent | 2.0 | ||
| 20 percent or more | 5.2 |
*In Nov. '21, respondents were provided with more specific answer choices. We aggregated those responses into the "4 percent or more" category for comparison to prior periods and also provided the detailed breakouts.
NOTE: 345 responses.
| Nov '18 (percent) |
Dec '19 (percent) |
Nov '21 (percent) |
|
| None | 27.4 | 18.5 | 27.3 |
| Less than 4 percent | 36.5 | 41.3 | 16.7 |
| 4 percent or more* | 36.2 | 40.3 | 56.0 |
| 4–7 percent | 24.6 | ||
| 8–11 percent | 15.0 | ||
| 12–15 percent | 8.2 | ||
| 16–19 percent | 2.9 | ||
| 20 percent or more | 5.3 |
*In Nov. '21, respondents were provided with more specific answer choices. We aggregated those responses into the "4 percent or more" category for comparison to prior periods and also provided the detailed breakouts.
NOTE: 341 responses.
Survey respondents were given the opportunity to provide comments. These comments can be found on the individual survey Special Questions results pages, accessible by the tabs above.
Texas Manufacturing Outlook Survey
Data were collected November 15–23, and 94 Texas manufacturers responded to the survey.
| Feb '21 (percent) |
Jun '21 (percent) |
Sep '21 (percent) |
Nov '21 (percent) |
|
| Yes | 61.8 | 86.1 | 92.0 | 92.5 |
| No | 38.2 | 13.9 | 8.0 | 7.5 |
NOTE: 93 responses.
| Jun '21 (percent) |
Sep '21 (percent) |
Nov '21 (percent) |
|
| Improved significantly | 2.3 | 1.3 | 0.0 |
| Improved slightly | 11.5 | 10.0 | 16.5 |
| No change | 23.0 | 31.3 | 27.1 |
| Worsened slightly | 43.7 | 37.5 | 43.5 |
| Worsened significantly | 19.5 | 20.0 | 12.9 |
NOTES: 85 responses. This question was posed only to those who are experiencing supply-chain disruptions or delays.
| Jun '21 (percent) |
Sep '21 (percent) |
Nov '21 (percent) |
|
| Less than a month | 0.0 | 0.0 | 1.3 |
| 1–3 months | 6.7 | 7.6 | 5.3 |
| 4–6 months | 33.3 | 31.8 | 30.7 |
| 7–9 months | 28.0 | 24.2 | 17.3 |
| 10–12 months | 17.3 | 18.2 | 20.0 |
| More than a year | 14.7 | 18.2 | 25.3 |
NOTES: 86 responses. This question was only posed to those currently experiencing any supply-chain disruptions or delays. These calculations exclude respondents that answered “Not sure,” which represented 10.6 percent of responses in June ’21, 14.4 percent in Sep. ’21 and 14.2 percent in Nov. ’21
| May '21 (percent) |
Aug '21 (percent) |
Nov '21 (percent) |
|
| Yes | 64.3 | 67.0 | 63.4 |
| No | 35.7 | 33.0 | 36.6 |
NOTE: 93 responses.
| May '21 (percent) |
Aug '21 (percent) |
Nov '21 (percent) |
|
| Not difficult | 1.6 | 0.0 | 0.0 |
| Somewhat difficult | 29.5 | 28.8 | 25.9 |
| Very difficult | 68.9 | 71.2 | 74.1 |
NOTES: 58 responses. This question was posed only to those trying to fill low-skill postions.
| May '21 (percent) |
Aug '21 (percent) |
Nov '21 (percent) |
|
| Yes | 69.4 | 65.6 | 68.8 |
| No | 30.6 | 34.4 | 31.2 |
NOTE: 93 responses.
| May '21 (percent) |
Aug '21 (percent) |
Nov '21 (percent) |
|
| Not difficult | 8.8 | 3.4 | 3.2 |
| Somewhat difficult | 44.1 | 36.2 | 42.9 |
| Very difficult | 47.1 | 60.3 | 54.0 |
NOTES: 63 responses. This question was posed only to those trying to fill mid-skill postions.
| May '21 (percent) |
Aug '21 (percent) |
Nov '21 (percent) |
|
| Yes | 50.0 | 51.1 | 50.5 |
| No | 50.0 | 48.9 | 49.5 |
NOTE: 93 responses.
| May '21 (percent) |
Aug '21 (percent) |
Nov '21 (percent) |
|
| Not difficult | 22.4 | 19.6 | 10.6 |
| Somewhat difficult | 44.9 | 32.6 | 42.6 |
| Very difficult | 32.7 | 47.8 | 46.8 |
NOTES: 47 responses. This question was posed only to those trying to fill high-skill postions.
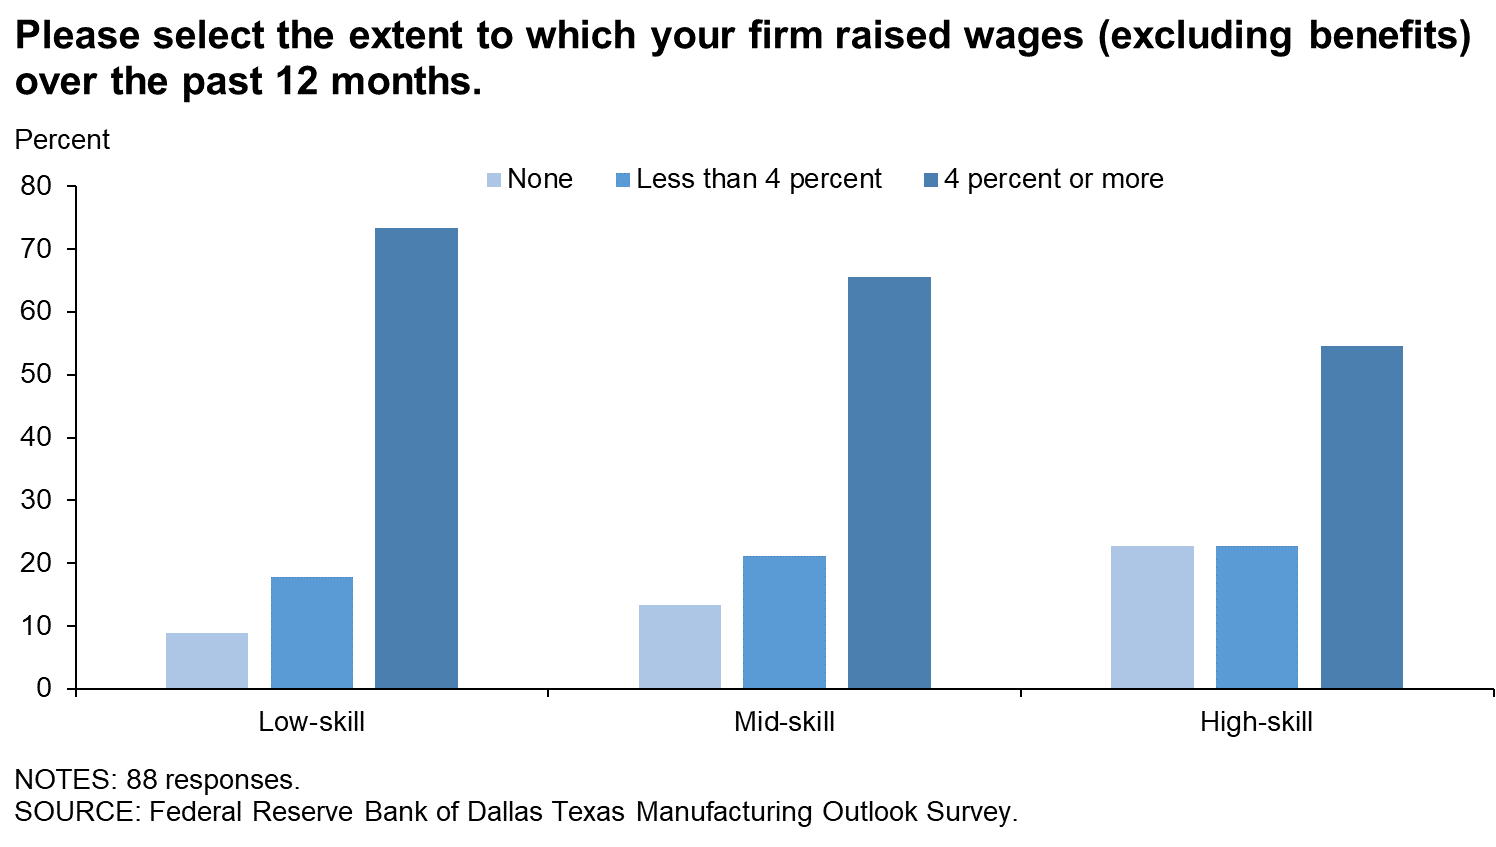
| Nov '18 (percent) |
Dec '19 (percent) |
Nov '21 (percent) |
|
| None | 10.8 | 14.0 | 8.9 |
| Less than 4 percent | 53.9 | 54.8 | 17.8 |
| 4 percent or more* | 35.3 | 31.2 | 73.3 |
| 4–7 percent | 25.6 | ||
| 8–11 percent | 24.4 | ||
| 12–15 percent | 8.9 | ||
| 16–19 percent | 5.6 | ||
| 20 percent or more | 8.9 |
*In Nov. '21, respondents were provided with more specific answer choices. We aggregated those responses into the "4 percent or more" category for comparison to prior periods and also provided the detailed breakouts.
NOTE: 90 responses.
| Nov '18 (percent) |
Dec '19 (percent) |
Nov '21 (percent) |
|
| None | 11.7 | 11.7 | 13.3 |
| Less than 4 percent | 49.5 | 54.3 | 21.1 |
| 4 percent or more* | 38.8 | 34.0 | 65.6 |
| 4–7 percent | 28.9 | ||
| 8–11 percent | 13.3 | ||
| 12–15 percent | 12.2 | ||
| 16–19 percent | 3.3 | ||
| 20 percent or more | 7.8 |
*In Nov. '21, respondents were provided with more specific answer choices. We aggregated those responses into the "4 percent or more" category for comparison to prior periods and also provided the detailed breakouts.
NOTE: 90 responses.
| Nov '18 (percent) |
Dec '19 (percent) |
Nov '21 (percent) |
|
| None | 20.4 | 19.1 | 22.7 |
| Less than 4 percent | 39.8 | 43.6 | 22.7 |
| 4 percent or more* | 39.8 | 37.2 | 54.5 |
| 4–7 percent | 20.5 | ||
| 8–11 percent | 18.2 | ||
| 12–15 percent | 4.5 | ||
| 16–19 percent | 4.5 | ||
| 20 percent or more | 6.8 |
*In Nov. '21, respondents were provided with more specific answer choices. We aggregated those responses into the "4 percent or more" category for comparison to prior periods and also provided the detailed breakouts.
NOTE: 88 responses.
Special Questions Comments
These comments have been edited for publication.
- Retention is the new norm. Just as we hire one, another leaves. To help alleviate this problem, we’ve taken steps to help stabilize our workforce through increased starting wages and other incentives. Only time will tell if these adjustments make an impact. As they have all year, supply-chain issues continue to drive price increases, delivery issues and late orders. Various materials used in elastomer material are becoming more difficult to obtain. We are seeking alternatives, but that doesn’t help us in the long term. Many suppliers cite that things will recover in late January. We’ll have to wait and see what happens.
- Wage rate changes have been based on specific roles and are not necessarily the same for all low-, mid- and high-skill positions.
- Effective Jan. 1, we are raising our finished-goods prices to cover our increased costs.
- We are competing for technically skilled welders and machinists. They are not available and, when available, are not long-term employees due to better offers.
- Maybe I don’t understand transitory [inflation], but this sure looks like real inflation to me. Prices keep going up, and we have to over-buy on all raw materials to ensure a continuous supply of product to our customers. We just bought a coil of steel that used to cost 45 cents per pound that is now over $1.00, and that was the last coil until sometime in December. No one is talking about price decreases, and I don’t expect that they will.
- The large increase in medical insurance costs will hurt profitability going forward.
- Supply problems shift from vendor to vendor. We have high employee turnover with new hires. We may have to raise starting labor rates in the near future.
- We gave raises to three employees who were just under $15 per hour to $15.15 per hour and increased the rest of the nonexempt proportionally.
- We increased incoming pay in an attempt to attract more applicants. We also increased the pay of all employees currently employed by the same percentage.
Texas Service Sector Outlook Survey
Data were collected November 15–23, and 266 Texas business executives responded to the survey.
| Feb '21 (percent) |
Jun '21 (percent) |
Sep '21 (percent) |
Nov '21 (percent) |
|
| Yes | 25.5 | 51.8 | 55.3 | 61.6 |
| No | 74.5 | 48.2 | 44.7 | 38.4 |
NOTE: 263 responses.
| Jun '21 (percent) |
Sep '21 (percent) |
Nov '21 (percent) |
|
| Improved significantly | 2.1 | 1.4 | 1.2 |
| Improved slightly | 19.7 | 21.2 | 19.3 |
| No change | 20.4 | 30.1 | 30.4 |
| Worsened slightly | 39.4 | 32.2 | 36.6 |
| Worsened significantly | 18.3 | 15.1 | 12.4 |
NOTES: 161 responses. This question was posed only to those who are experiencing supply-chain disruptions or delays.
| Jun '21 (percent) |
Sep '21 (percent) |
Nov '21 (percent) |
|
| Less than a month | 0.8 | 0.0 | 0.0 |
| 1–3 months | 10.2 | 8.8 | 7.9 |
| 4–6 months | 40.9 | 26.4 | 24.5 |
| 7–9 months | 22.0 | 20.8 | 20.9 |
| 10–12 months | 13.4 | 25.6 | 21.6 |
| More than a year | 12.6 | 18.4 | 25.2 |
NOTES: 162 responses. This question was only posed to those currently experiencing any supply-chain disruptions or delays. These calculations exclude respondents that answered “Not sure,” which represented 10.6 percent of responses in June ’21, 14.4 percent in Sep. ’21 and 14.2 percent in Nov. ’21.
| May '21 (percent) |
Aug '21 (percent) |
Nov '21 (percent) |
|
| Yes | 46.3 | 44.8 | 47.5 |
| No | 53.7 | 55.2 | 52.5 |
NOTE: 263 responses.
| May '21 (percent) |
Aug '21 (percent) |
Nov '21 (percent) |
|
| Not difficult | 2.3 | 2.5 | 3.2 |
| Somewhat difficult | 29.7 | 49.2 | 40.8 |
| Very difficult | 68.0 | 48.3 | 56.0 |
NOTES: 125 responses. This question was posed only to those trying to fill low-skill postions.
| May '21 (percent) |
Aug '21 (percent) |
Nov '21 (percent) |
|
| Yes | 50.5 | 59.8 | 53.4 |
| No | 49.5 | 40.2 | 46.6 |
NOTE: 262 responses.
| May '21 (percent) |
Aug '21 (percent) |
Nov '21 (percent) |
|
| Not difficult | 5.7 | 4.5 | 1.4 |
| Somewhat difficult | 45.0 | 53.8 | 47.1 |
| Very difficult | 49.3 | 41.7 | 51.4 |
NOTES: 140 responses. This question was posed only to those trying to fill mid-skill postions.
| May '21 (percent) |
Aug '21 (percent) |
Nov '21 (percent) |
|
| Yes | 43.5 | 46.1 | 45.4 |
| No | 56.5 | 53.9 | 54.6 |
NOTE: 262 responses.
| May '21 (percent) |
Aug '21 (percent) |
Nov '21 (percent) |
|
| Not difficult | 19.2 | 14.5 | 2.5 |
| Somewhat difficult | 45.8 | 41.1 | 47.1 |
| Very difficult | 35.0 | 44.4 | 50.4 |
NOTES: 119 responses. This question was posed only to those trying to fill high-skill postions.
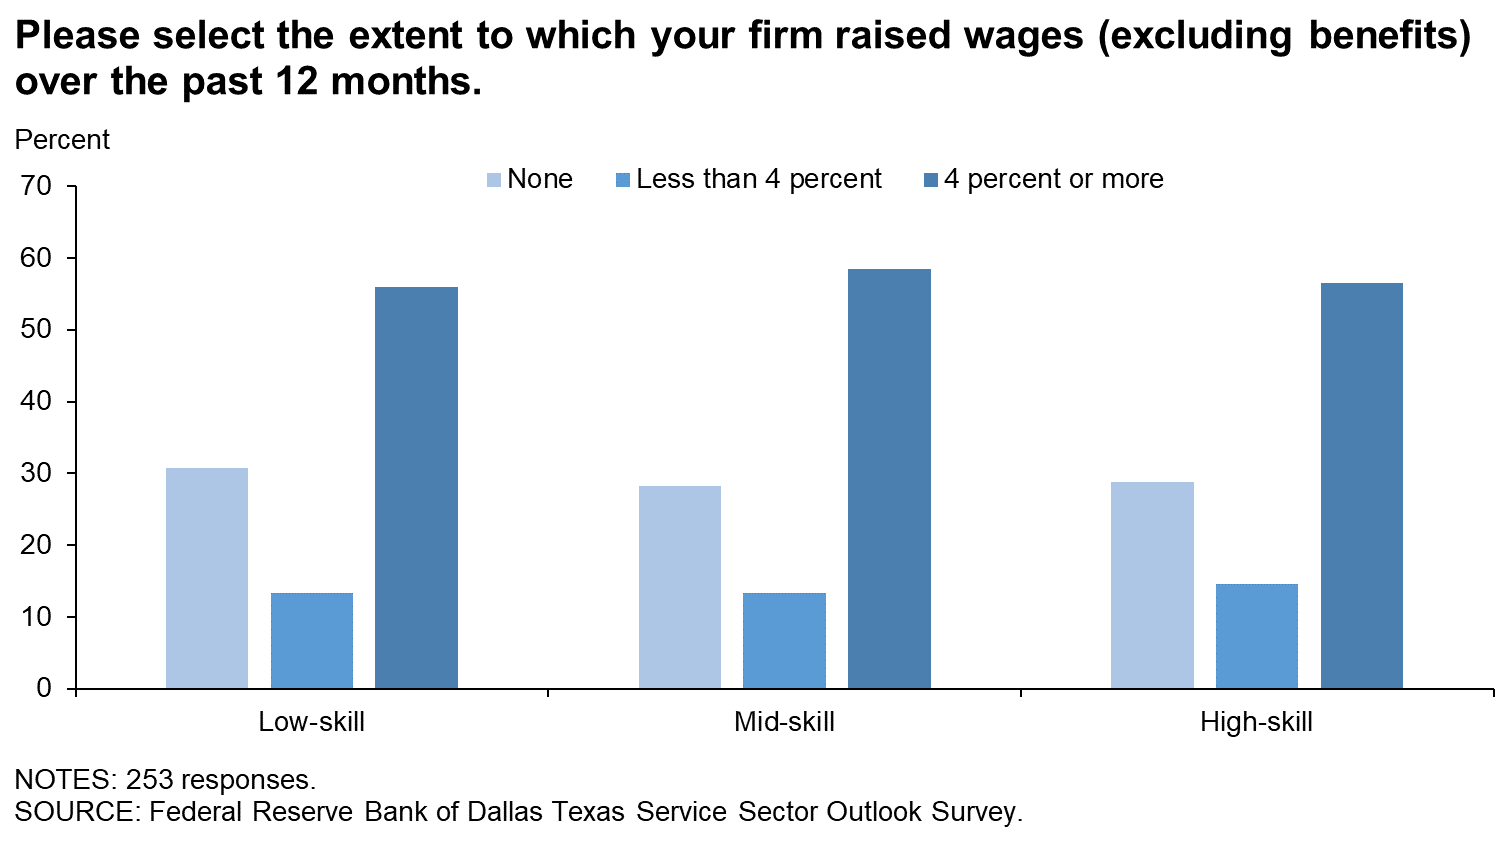
| Nov '18 (percent) |
Dec '19 (percent) |
Nov '21 (percent) |
|
| None | 29.4 | 25.8 | 30.7 |
| Less than 4 percent | 38.9 | 48.8 | 13.4 |
| 4 percent or more* | 31.7 | 25.4 | 55.9 |
| 4–7 percent | 19.3 | ||
| 8–11 percent | 14.6 | ||
| 12–15 percent | 11.4 | ||
| 16–19 percent | 4.3 | ||
| 20 percent or more | 6.3 |
*In Nov. '21, respondents were provided with more specific answer choices. We aggregated those responses into the "4 percent or more" category for comparison to prior periods and also provided the detailed breakouts.
NOTE: 254 responses.
| Nov '18 (percent) |
Dec '19 (percent) |
Nov '21 (percent) |
|
| None | 22.7 | 18.6 | 28.2 |
| Less than 4 percent | 42.8 | 47.1 | 13.3 |
| 4 percent or more* | 34.5 | 34.3 | 58.4 |
| 4–7 percent | 22.7 | ||
| 8–11 percent | 19.2 | ||
| 12–15 percent | 10.6 | ||
| 16–19 percent | 1.6 | ||
| 20 percent or more | 4.3 |
*In Nov. '21, respondents were provided with more specific answer choices. We aggregated those responses into the "4 percent or more" category for comparison to prior periods and also provided the detailed breakouts.
NOTE: 255 responses.
| Nov '18 (percent) |
Dec '19 (percent) |
Nov '21 (percent) |
|
| None | 30.4 | 18.2 | 28.9 |
| Less than 4 percent | 35.0 | 40.2 | 14.6 |
| 4 percent or more* | 34.6 | 41.6 | 56.5 |
| 4–7 percent | 26.1 | ||
| 8–11 percent | 13.8 | ||
| 12–15 percent | 9.5 | ||
| 16–19 percent | 2.4 | ||
| 20 percent or more | 4.7 |
*In Nov. '21, respondents were provided with more specific answer choices. We aggregated those responses into the "4 percent or more" category for comparison to prior periods and also provided the detailed breakouts.
NOTE: 253 responses.
Special Questions Comments
These comments have been edited for publication.
- We are now requiring vaccines for persons applying for open positions.
- We need diesel mechanics, but we’re not getting any applications.
- Any wage increases issued have been attributed to individual performance.
- Higher inflation, very limited skilled labor choice, and general uncertainty of resourcing and decisions by customer/clients are three key factors most affecting our business.
- To retain employees with the increased cost of living for 2022, our current costs are rising immediately at least 6.5 percent and reducing the profit we normally put toward growth.
- We are concentrating on our projected budget for 2022, which will be a challenging year with tighter margins, and creating a strategy for cutting costs. We do not anticipate adding any new high-skilled [employees] and will try to avoid replacing low- to mid-level employees that leave the company. We do anticipate that it will be necessary to expand cross-training and increase wages to keep skilled workers in place.
- We plan a [wage] increase of about 10 percent for the beginning of 2022 but did not have an increase in 2021.
- Health care costs have soared over the past 12 months. The company has absorbed most of these costs, and it will cause a decrease in income for the company going forward.
- As a financial institution, we’ve not experienced the same level of supply-chain disruptions as our clients have experienced. We are all feeling the impact of wage pressures and increased payroll and benefit costs without necessarily realizing similar increases in productivity/profitability.
- We need the federal government to stop with stimulus packages so people will have the need to work and be proud of their accomplishments. [I saw that] the federal government was looking to push stimulus packages out so the nation can catch up with inflation.
- We are pretty much stuck to cost-of-living increases lately.
- Like many employers, we have annual salary increases at year end. We have not yet made pay increases for 2021.
- We sell our software worldwide, and our business has started to pick up after the COVID down years. We have started the hiring process, anticipating growth in 2022 and 2023.
- We had to increase wages or we would have lose personnel. It’s very competitive. We receive no applications for employment. We have many unfilled positions and cannot afford to lose any more people.
- We expect no compensatory increase in selling prices for services, with an anticipated [price] drop in ’22.
- What has happened to the American work ethic and desire to get ahead?
- Receptionist positions (low-skill positions) were starting at $8 per hour two years ago. About six months ago, we were forced to raise that starting position to $10 per hour because we could not find enough applicants. Now we are forced to raise starting wages to $12 per hour because we cannot retain employees. Receptionists are leaving after a week or two to take low-skill positions that pay $14 per hour. The same is happening with my mid-skill positions.
- We have not increased salaries during the pandemic and expect our first increase in quite a while to occur in January.
Texas Retail Outlook Survey
Data were collected November 15–23, and 44 Texas retailers responded to the survey.
| Feb '21 (percent) |
Jun '21 (percent) |
Sep '21 (percent) |
Nov '21 (percent) |
|
| Yes | 64.4 | 87.2 | 80.9 | 93.0 |
| No | 35.6 | 12.8 | 19.1 | 7.0 |
NOTE: 43 responses.
| Jun '21 (percent) |
Sep '21 (percent) |
Nov '21 (percent) |
|
| Improved significantly | 0.0 | 0.0 | 0.0 |
| Improved slightly | 22.0 | 23.7 | 25.0 |
| No change | 17.1 | 28.9 | 30.0 |
| Worsened slightly | 34.1 | 15.8 | 32.5 |
| Worsened significantly | 26.8 | 31.6 | 12.5 |
NOTES: 40 responses. This question was posed only to those who are experiencing supply-chain disruptions or delays.
| Jun '21 (percent) |
Sep '21 (percent) |
Nov '21 (percent) |
|
| Less than a month | 0.0 | 0.0 | 0.0 |
| 1–3 months | 15.4 | 11.1 | 2.8 |
| 4–6 months | 41.0 | 16.7 | 25.0 |
| 7–9 months | 12.8 | 16.7 | 25.0 |
| 10–12 months | 23.1 | 22.2 | 16.7 |
| More than a year | 7.7 | 33.3 | 30.6 |
NOTES: 40 responses. This question was only posed to those currently experiencing any supply-chain disruptions or delays. These calculations exclude respondents that answered “Not sure,” which represented 4.9 percent of responses in June ’21, 5.3 percent in Sep. ’21 and 10 percent in Nov. ’21.
| May '21 (percent) |
Aug '21 (percent) |
Nov '21 (percent) |
|
| Yes | 66.0 | 62.8 | 62.8 |
| No | 34.0 | 37.2 | 37.2 |
NOTE: 43 responses.
| May '21 (percent) |
Aug '21 (percent) |
Nov '21 (percent) |
|
| Not difficult | 2.9 | 0.0 | 0.0 |
| Somewhat difficult | 20.6 | 44.4 | 37.0 |
| Very difficult | 76.5 | 55.6 | 63.0 |
NOTES: 27 responses. This question was posed only to those trying to fill low-skill postions.
| May '21 (percent) |
Aug '21 (percent) |
Nov '21 (percent) |
|
| Yes | 59.6 | 70.0 | 60.5 |
| No | 40.4 | 30.0 | 39.5 |
NOTE: 43 responses.
| May '21 (percent) |
Aug '21 (percent) |
Nov '21 (percent) |
|
| Not difficult | 0.0 | 0.0 | 0.0 |
| Somewhat difficult | 45.2 | 42.9 | 30.8 |
| Very difficult | 54.8 | 57.1 | 69.2 |
NOTES: 26 responses. This question was posed only to those trying to fill mid-skill postions.
| May '21 (percent) |
Aug '21 (percent) |
Nov '21 (percent) |
|
| Yes | 20.8 | 37.2 | 27.9 |
| No | 79.2 | 62.8 | 72.1 |
NOTE: 43 responses.
| May '21 (percent) |
Aug '21 (percent) |
Nov '21 (percent) |
|
| Not difficult | 9.1 | 12.5 | 0.0 |
| Somewhat difficult | 45.5 | 43.8 | 50.0 |
| Very difficult | 45.5 | 43.8 | 50.0 |
NOTES: 12 responses. This question was posed only to those trying to fill high-skill postions.
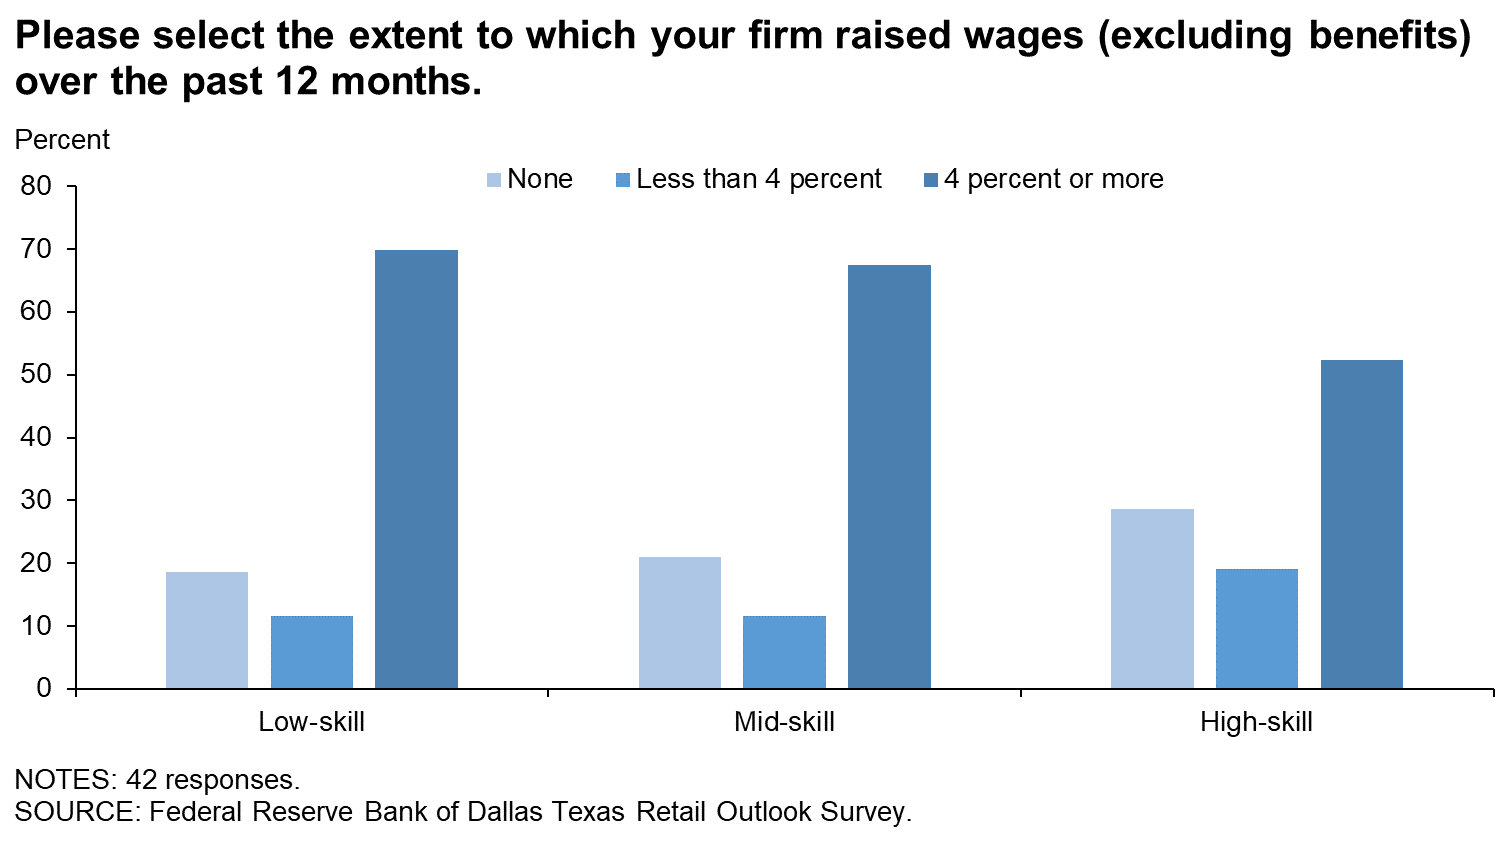
| Nov '18 (percent) |
Dec '19 (percent) |
Nov '21 (percent) |
|
| None | 16.3 | 17.8 | 18.6 |
| Less than 4 percent | 46.5 | 51.1 | 11.6 |
| 4 percent or more* | 37.2 | 31.1 | 69.8 |
| 4–7 percent | 16.3 | ||
| 8–11 percent | 23.3 | ||
| 12–15 percent | 18.6 | ||
| 16–19 percent | 4.7 | ||
| 20 percent or more | 7.0 |
*In Nov. '21, respondents were provided with more specific answer choices. We aggregated those responses into the "4 percent or more" category for comparison to prior periods and also provided the detailed breakouts.
NOTE: 43 responses.
| Nov '18 (percent) |
Dec '19 (percent) |
Nov '21 (percent) |
|
| None | 18.6 | 13.6 | 20.9 |
| Less than 4 percent | 44.2 | 54.5 | 11.6 |
| 4 percent or more* | 37.2 | 31.8 | 67.4 |
| 4–7 percent | 20.9 | ||
| 8–11 percent | 32.6 | ||
| 12–15 percent | 11.6 | ||
| 16–19 percent | 0.0 | ||
| 20 percent or more | 2.3 |
*In Nov. '21, respondents were provided with more specific answer choices. We aggregated those responses into the "4 percent or more" category for comparison to prior periods and also provided the detailed breakouts.
NOTE: 43 responses.
| Nov '18 (percent) |
Dec '19 (percent) |
Nov '21 (percent) |
|
| None | 38.5 | 20.9 | 28.6 |
| Less than 4 percent | 41.0 | 32.6 | 19.0 |
| 4 percent or more* | 20.5 | 46.5 | 52.4 |
| 4–7 percent | 23.8 | ||
| 8–11 percent | 19.0 | ||
| 12–15 percent | 7.1 | ||
| 16–19 percent | 2.4 | ||
| 20 percent or more | 0.0 |
*In Nov. '21, respondents were provided with more specific answer choices. We aggregated those responses into the "4 percent or more" category for comparison to prior periods and also provided the detailed breakouts.
NOTE: 42 responses.
Special Questions Comments
These comments have been edited for publication.
- Companywide, we will raise everyone’s pay by 4 to 5 percent before the end of this year. We will also award a year-end bonus.
- Significantly raising the hourly pay to hire low- and mid-skill positions requires a general increase in all of the existing employees with similar compensation; otherwise, you lose these people due to lack of fairness in pay scales.
Questions regarding the Texas Business Outlook Surveys can be addressed to Emily Kerr at emily.kerr@dal.frb.org.
Sign up for our email alert to be automatically notified as soon as the latest surveys are released on the web.