Special Questions

Special Questions
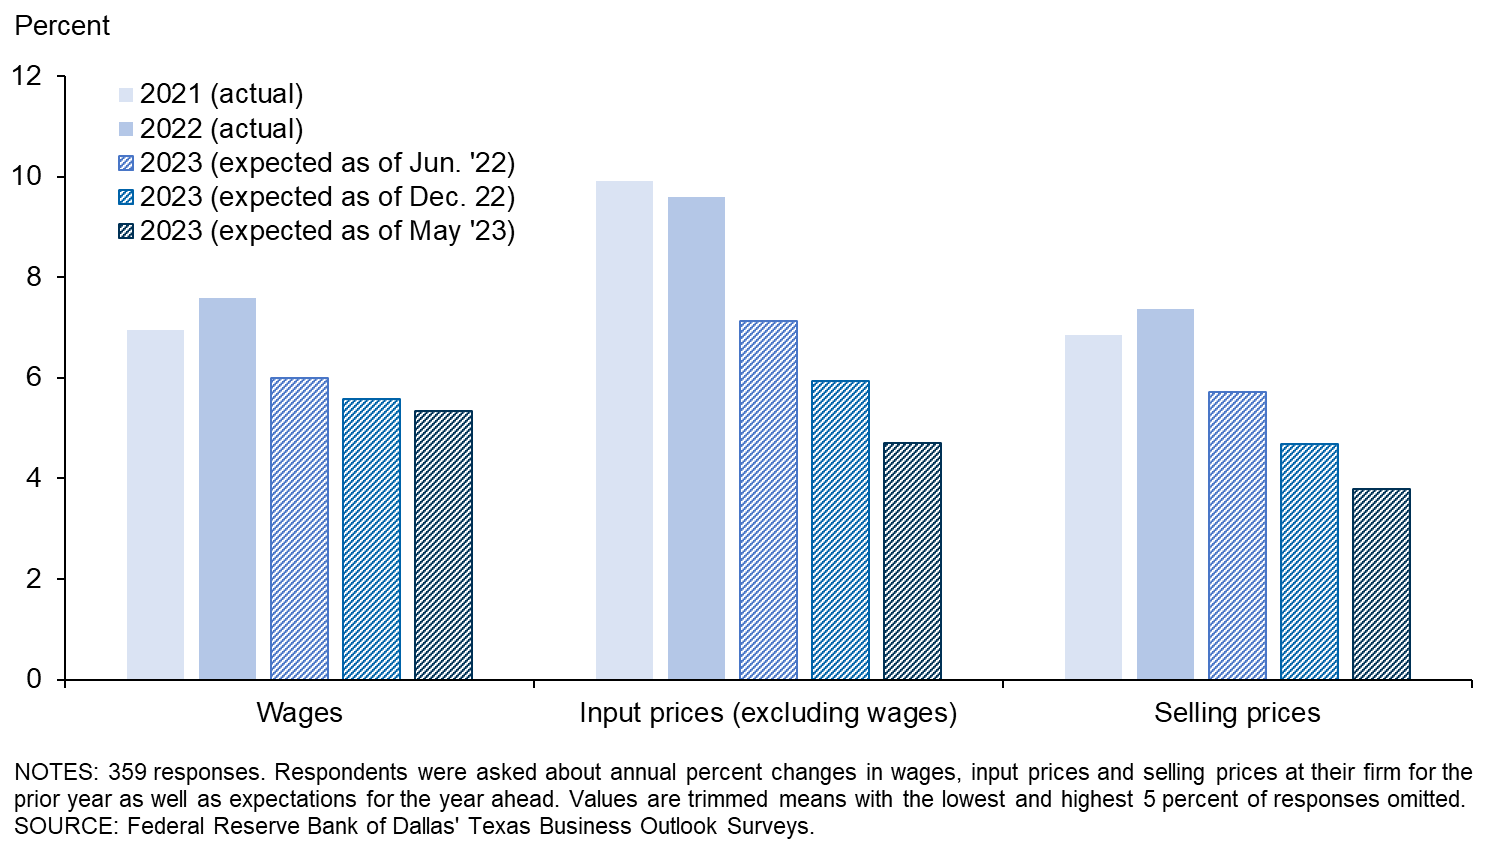
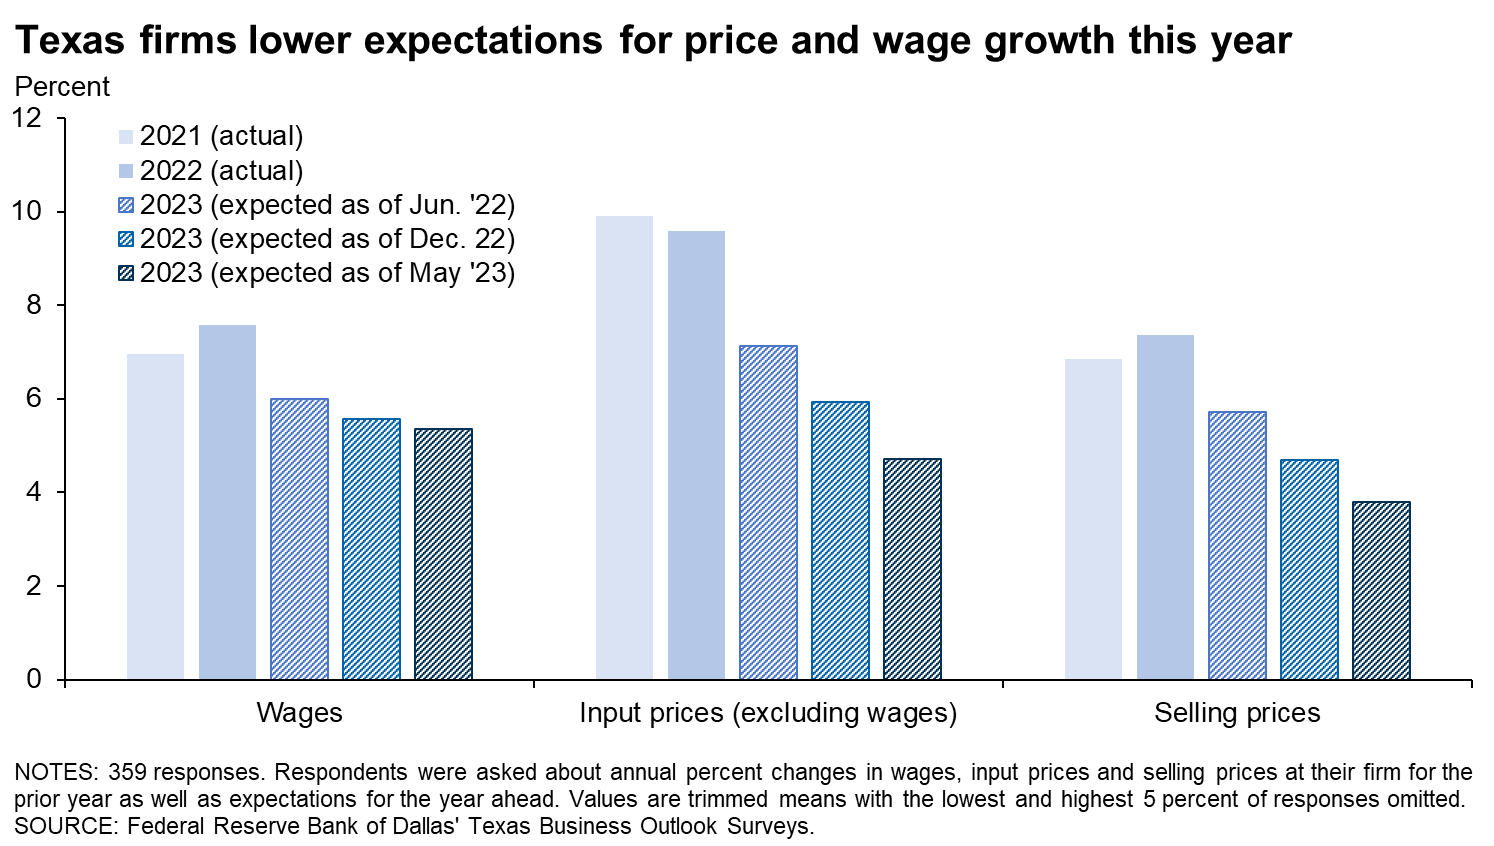
Texas Business Outlook Surveys
Data were collected May 16–24, and 387 Texas business executives responded to the surveys.
| 2021 | 2022 | 2023 | |||||
| Expected (percent) |
Actual (percent) |
Expected (percent) |
Actual (percent) |
Expected (percent) |
Expected (percent) |
Expected (percent) |
|
| Wages | 4.3 | 7.0 | 6.4 | 7.6 | 6.0 | 5.6 | 5.3 |
| Input prices (excluding wages) | 3.7 | 9.9 | 7.1 | 9.6 | 7.1 | 5.9 | 4.7 |
| Selling prices | 3.4 | 6.9 | 6.4 | 7.4 | 5.7 | 4.7 | 3.8 |
| Data collected | Dec. '20 | Dec. '21 | Dec. '21 | Dec. '22 | Jun. '22 | Dec. '22 | May '23 |
NOTES: 359 responses. Averages are calculated as trimmed means with the lowest and highest 5 percent of responses omitted.
| May '23 | |
| Higher input costs (excluding labor) | 40.4 |
| Higher labor costs | 37.2 |
| Higher demand | 8.5 |
| Higher taxes and/or more regulation | 3.1 |
| Lower productivity | 0.9 |
| Other | 9.9 |
NOTES: 223 responses. This question was only posed to those expecting an increase in selling prices.
| May '23 (percent) |
|
| Lower demand | 56.3 |
| Lower input costs (excluding labor) | 25.0 |
| Lower labor costs | 3.1 |
| Higher productivity | 0.0 |
| Lower taxes and/or less regulation | 0.0 |
| Other | 15.6 |
NOTES: 32 responses. This question was only posed to those expecting a decrease in selling prices.
| Dec. '18 (percent) |
Aug. '19 (percent) |
May '21 (percent) |
Dec. '21 (percent) |
May '22 (percent) |
Nov. '22 (percent) |
May '23 (percent) |
|
| None | 24.4 | 41.0 | 36.0 | 24.1 | 32.1 | 29.8 | 25.6 |
| Some | 49.2 | 43.9 | 38.4 | 40.6 | 43.4 | 42.5 | 40.8 |
| Most | 18.1 | 10.4 | 16.7 | 24.1 | 16.5 | 16.3 | 20.8 |
| All | 8.4 | 4.6 | 8.9 | 11.1 | 8.1 | 11.4 | 12.7 |
NOTE: 355 responses.
| May '18 (percent) |
De.c '18 (percent) |
Aug. '19 (percent) |
May '21 (percent) |
Nov. '22 (percent) |
May '23 (percent) |
|
| Much easier now | 2.5 | 1.4 | 1.8 | 7.0 | 3.6 | 3.4 |
| Somewhat easier now | 23.8 | 18.9 | 13.0 | 23.9 | 20.3 | 22.3 |
| Similar to six months ago | 38.8 | 39.5 | 46.4 | 44.2 | 40.3 | 34.5 |
| Somewhat harder now | 21.0 | 23.7 | 26.7 | 15.8 | 23.9 | 33.0 |
| Significantly harder now | 13.9 | 16.5 | 12.1 | 9.1 | 11.9 | 6.8 |
NOTE: 264 responses.
Survey respondents were given the opportunity to provide comments, which can be found in the Comments tab above.
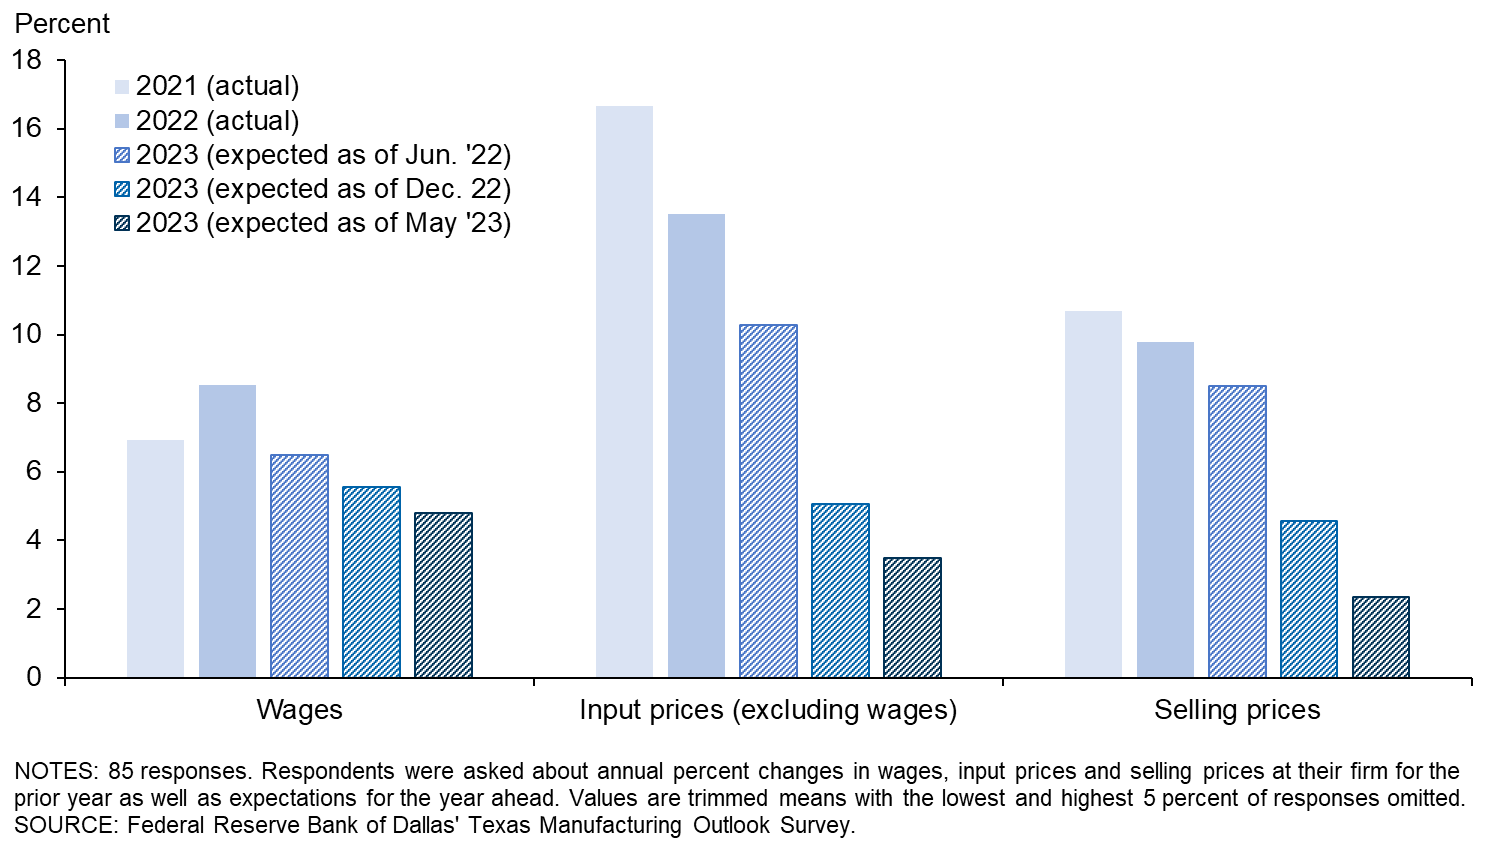
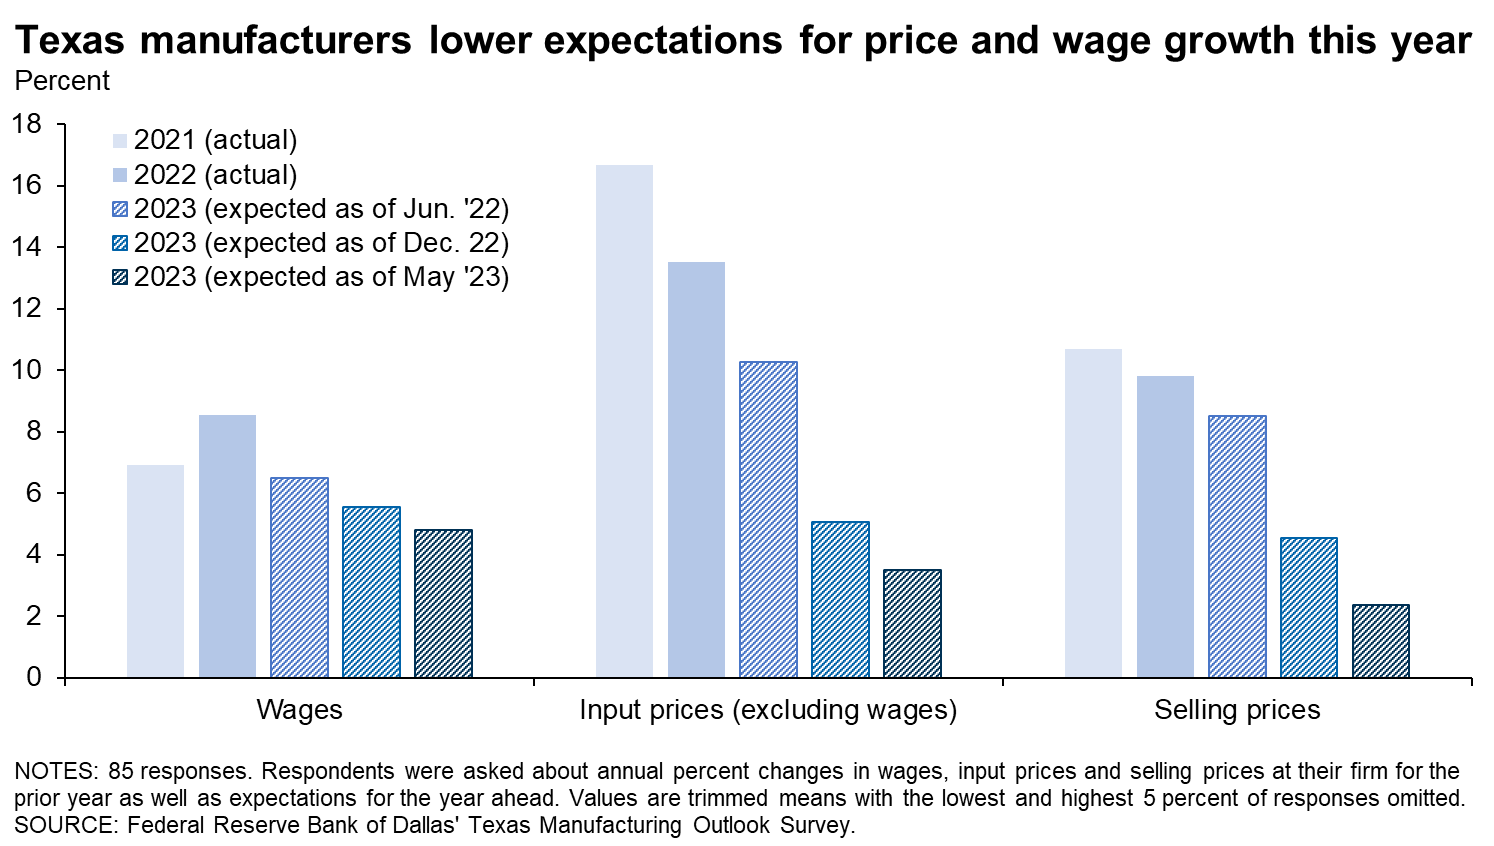
Texas Manufacturing Outlook Survey
Data were collected May 16–24, and 89 Texas manufacturers responded to the survey.
| 2021 | 2022 | 2023 | |||||
| Expected (percent) |
Actual (percent) |
Expected (percent) |
Actual (percent) |
Expected (percent) |
Expected (percent) |
Expected (percent) |
|
| Wages | 4.2 | 6.9 | 6.0 | 8.5 | 6.5 | 5.5 | 4.8 |
| Input prices (excluding wages) | 4.6 | 16.7 | 8.5 | 13.5 | 10.3 | 5.1 | 3.5 |
| Selling prices | 3.9 | 10.7 | 8.1 | 9.8 | 8.5 | 4.5 | 2.4 |
| Data collected | Dec. '20 | Dec. '21 | Dec. '21 | Dec. '22 | Jun. '22 | Dec. '22 | May '23 |
NOTES: 85 responses. Averages are calculated as trimmed means with the lowest and highest 5 percent of responses omitted.
| May '23 | |
| Higher input costs (excluding labor) | 51.1 |
| Higher labor costs | 31.1 |
| Higher demand | 11.1 |
| Lower productivity | 0.0 |
| Higher taxes and/or more regulation | 0.0 |
| Other | 6.7 |
NOTES: 45 responses. This question was only posed to those expecting an increase in selling prices.
| May '23 (percent) |
|
| Lower demand | 53.3 |
| Lower input costs (excluding labor) | 40.0 |
| Lower labor costs | 0.0 |
| Higher productivity | 0.0 |
| Lower taxes and/or less regulation | 0.0 |
| Other | 6.7 |
NOTES: 15 responses. This question was only posed to those expecting a decrease in selling prices.
| Dec. '18 (percent) |
Aug. '19 (percent) |
May '21 (percent) |
Dec. '21 (percent) |
May '22 (percent) |
Nov. '22 (percent) |
May '23 (percent) |
|
| None | 17.2 | 40.6 | 15.2 | 6.9 | 13.1 | 16.3 | 23.8 |
| Some | 50.5 | 45.5 | 44.6 | 35.6 | 42.9 | 48.9 | 34.5 |
| Most | 23.2 | 9.9 | 29.3 | 35.6 | 29.8 | 14.1 | 22.6 |
| All | 9.1 | 4.0 | 10.9 | 21.8 | 14.3 | 20.7 | 19.0 |
NOTE: 84 responses.
| May '18 (percent) |
De.c '18 (percent) |
Aug. '19 (percent) |
May '21 (percent) |
Nov. '22 (percent) |
May '23 (percent) |
|
| Much easier now | 1.2 | 1.0 | 1.0 | 15.4 | 6.6 | 7.8 |
| Somewhat easier now | 30.2 | 26.5 | 12.7 | 28.6 | 17.6 | 12.5 |
| Similar to six months ago | 31.4 | 35.7 | 45.1 | 37.4 | 39.6 | 31.3 |
| Somewhat harder now | 24.4 | 20.4 | 25.5 | 14.3 | 20.9 | 39.1 |
| Significantly harder now | 12.8 | 16.3 | 15.7 | 4.4 | 15.4 | 9.4 |
NOTE: 64 responses.
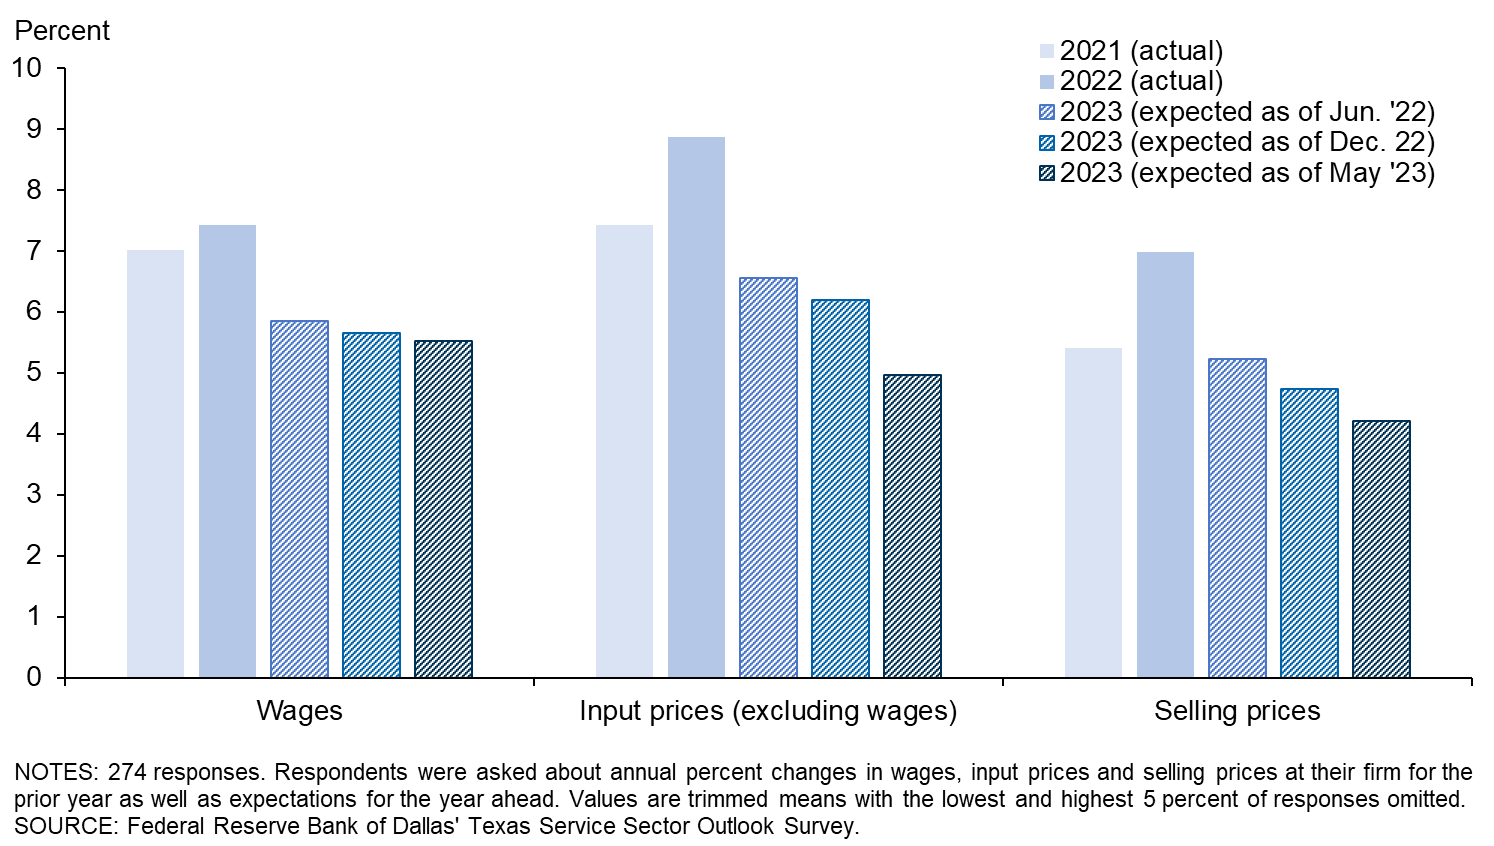
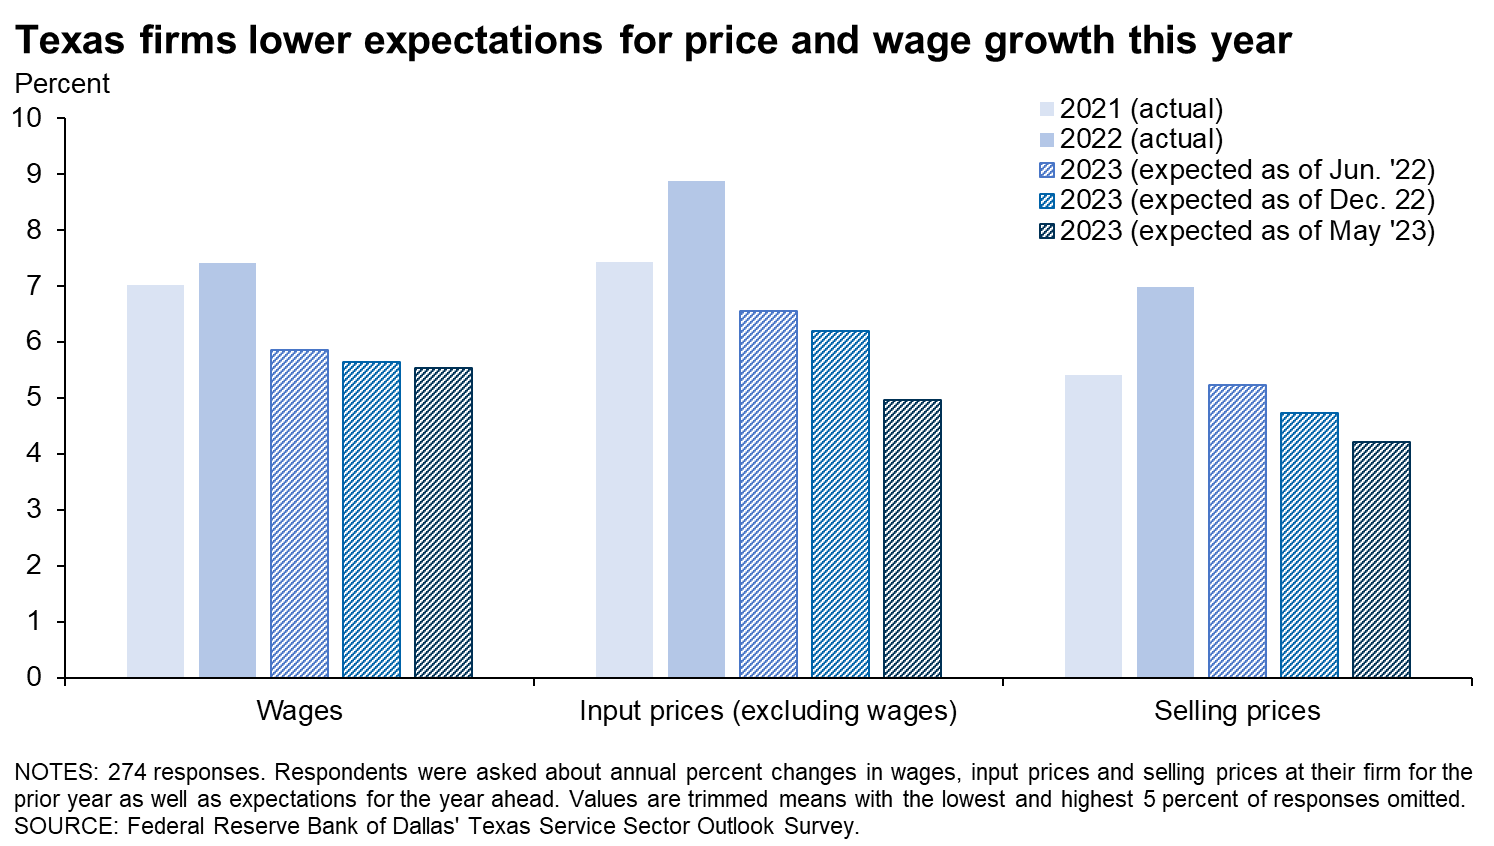
Texas Service Sector Outlook Survey
Data were collected May 16–24, and 298 Texas business executives responded to the survey.
| 2021 | 2022 | 2023 | |||||
| Expected (percent) |
Actual (percent) |
Expected (percent) |
Actual (percent) |
Expected (percent) |
Expected (percent) |
Expected (percent) |
|
| Wages | 4.4 | 7.0 | 6.7 | 7.4 | 5.9 | 5.6 | 5.5 |
| Input prices (excluding wages) | 3.2 | 7.4 | 6.5 | 8.9 | 6.6 | 6.2 | 5.0 |
| Selling prices | 3.2 | 5.4 | 5.7 | 7.0 | 5.2 | 4.7 | 4.2 |
| Data collected | Dec. '20 | Dec. '21 | Dec. '21 | Dec. '22 | Jun. '22 | Dec. '22 | May '23 |
NOTES: 274 responses. Averages are calculated as trimmed means with the lowest and highest 5 percent of responses omitted.
| May '23 | |
| Higher labor costs | 38.8 |
| Higher input costs (excluding labor) | 37.6 |
| Higher demand | 7.9 |
| Higher taxes and/or more regulation | 3.9 |
| Lower productivity | 1.1 |
| Other | 10.7 |
NOTES: 178 responses. This question was only posed to those expecting an increase in selling prices.
| May '23 (percent) |
|
| Lower demand | 58.8 |
| Lower input costs (excluding labor) | 11.8 |
| Lower labor costs | 5.9 |
| Higher productivity | 0.0 |
| Lower taxes and/or less regulation | 0.0 |
| Other | 23.5 |
NOTES: 17 responses. This question was only posed to those expecting a decrease in selling prices.
| Dec. '18 (percent) |
Aug. '19 (percent) |
May '21 (percent) |
Dec. '21 (percent) |
May '22 (percent) |
Nov. '22 (percent) |
May '23 (percent) |
|
| None | 28.0 | 41.2 | 43.9 | 30.7 | 38.2 | 34.3 | 26.2 |
| Some | 48.5 | 43.3 | 36.1 | 42.5 | 43.5 | 40.4 | 42.8 |
| Most | 15.5 | 10.6 | 11.9 | 19.7 | 12.2 | 17.0 | 20.3 |
| All | 8.0 | 4.9 | 8.2 | 7.0 | 6.1 | 8.3 | 10.7 |
NOTE: 271 responses.
| May '18 (percent) |
De.c '18 (percent) |
Aug. '19 (percent) |
May '21 (percent) |
Nov. '22 (percent) |
May '23 (percent) |
|
| Much easier now | 3.1 | 1.6 | 2.2 | 3.8 | 2.6 | 2.0 |
| Somewhat easier now | 21.0 | 15.0 | 13.2 | 22.2 | 21.2 | 25.5 |
| Similar to six months ago | 42.1 | 41.5 | 46.9 | 46.9 | 40.5 | 35.5 |
| Somewhat harder now | 19.5 | 25.4 | 27.2 | 16.3 | 24.9 | 31.0 |
| Significantly harder now | 14.4 | 16.6 | 10.5 | 10.9 | 10.8 | 6.0 |
NOTE: 200 responses.
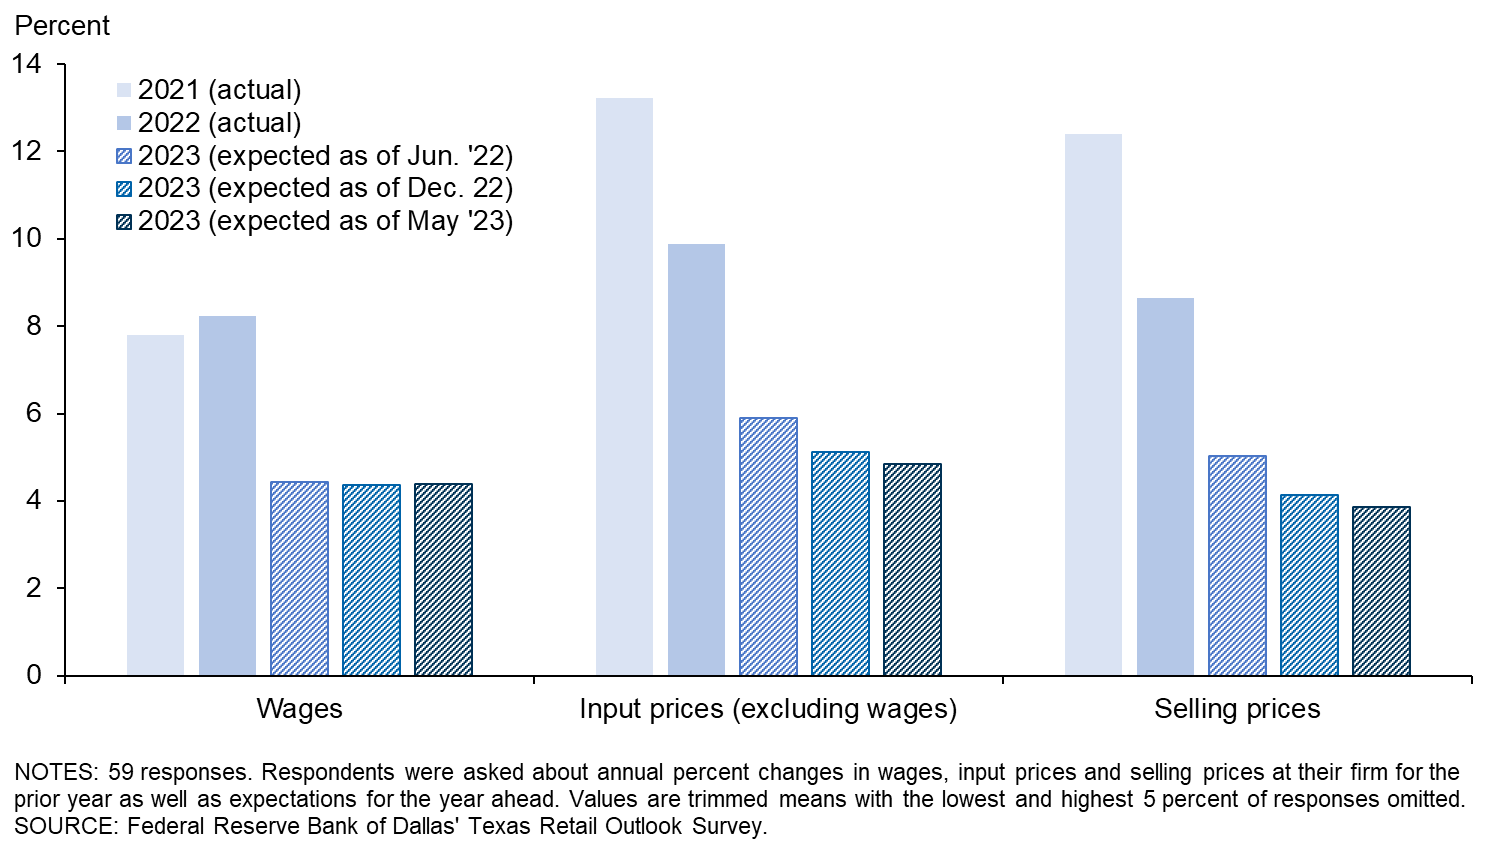
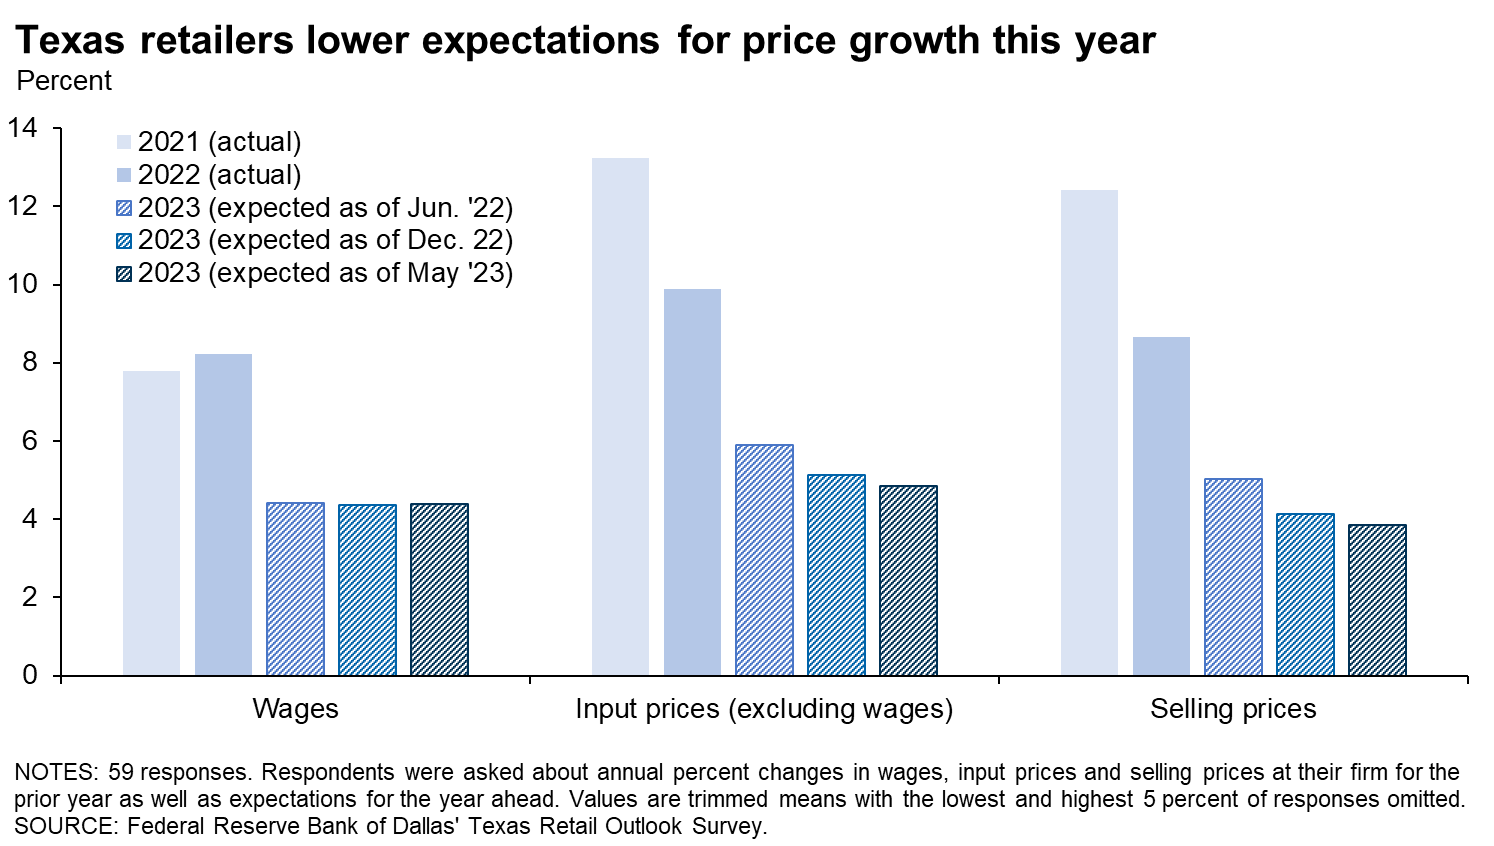
Texas Retail Outlook Survey
Data were collected May 16–24, and 62 Texas retailers responded to the survey.
| 2021 | 2022 | 2023 | |||||
| Expected (percent) |
Actual (percent) |
Expected (percent) |
Actual (percent) |
Expected (percent) |
Expected (percent) |
Expected (percent) |
|
| Wages | 3.0 | 7.8 | 8.3 | 8.2 | 4.4 | 4.4 | 4.4 |
| Input prices (excluding wages) | 2.6 | 13.2 | 8.9 | 9.9 | 5.9 | 5.1 | 4.9 |
| Selling prices | 2.9 | 12.4 | 8.7 | 8.7 | 5.0 | 4.1 | 3.9 |
| Data collected | Dec. '20 | Dec. '21 | Dec. '21 | Dec. '22 | Jun. '22 | Dec. '22 | May '23 |
NOTES: 59 responses. Averages are calculated as trimmed means with the lowest and highest 5 percent of responses omitted.
| May '23 | |
| Higher input costs (excluding labor) | 62.8 |
| Higher labor costs | 25.6 |
| Higher demand | 2.3 |
| Lower productivity | 0.0 |
| Higher taxes and/or more regulation | 0.0 |
| Other | 9.3 |
NOTES: 43 responses. This question was only posed to those expecting an increase in selling prices.
| May '23 (percent) |
|
| Lower demand | 42.9 |
| Lower input costs (excluding labor) | 28.6 |
| Lower labor costs | 0.0 |
| Higher productivity | 0.0 |
| Lower taxes and/or less regulation | 0.0 |
| Other | 28.6 |
NOTES: 7 responses. This question was only posed to those expecting a decrease in selling prices.
| Dec. '18 (percent) |
Aug. '19 (percent) |
May '21 (percent) |
Dec. '21 (percent) |
May '22 (percent) |
Nov. '22 (percent) |
May '23 (percent) |
|
| None | 18.4 | 26.5 | 20.4 | 14.3 | 14.0 | 19.7 | 21.7 |
| Some | 52.6 | 53.1 | 51.0 | 34.3 | 44.2 | 36.1 | 38.3 |
| Most | 15.8 | 10.2 | 18.4 | 40.0 | 27.9 | 31.1 | 21.7 |
| All | 13.2 | 10.2 | 10.2 | 11.4 | 14.0 | 13.1 | 18.3 |
NOTE: 60 responses.
| May '18 (percent) |
De.c '18 (percent) |
Aug. '19 (percent) |
May '21 (percent) |
Nov. '22 (percent) |
May '23 (percent) |
|
| Much easier now | 2.4 | 5.3 | 2.1 | 6.4 | 3.3 | 4.3 |
| Somewhat easier now | 24.4 | 7.9 | 14.6 | 44.7 | 23.0 | 23.4 |
| Similar to six months ago | 31.7 | 28.9 | 39.6 | 27.7 | 32.8 | 31.9 |
| Somewhat harder now | 24.4 | 36.8 | 33.3 | 14.9 | 29.5 | 29.8 |
| Significantly harder now | 17.1 | 21.1 | 10.4 | 6.4 | 11.5 | 10.6 |
NOTE: 47 responses.
Questions regarding the Texas Business Outlook Surveys can be addressed to Emily Kerr at emily.kerr@dal.frb.org.
Sign up for our email alert to be automatically notified as soon as the latest surveys are released on the web.
Special Questions Comments
These comments have been edited for publication.
Texas Manufacturing Outlook Survey
Texas Service Sector Outlook Survey
Texas Retail Outlook Survey