Special Questions

Special Questions
For this month’s survey, Texas business executives were asked supplemental questions on wages, prices and outlook concerns. Results below include responses from participants of all three surveys: Texas Manufacturing Outlook Survey, Texas Service Sector Outlook Survey and Texas Retail Outlook Survey.
Texas Business Outlook Surveys
Data were collected June 17–25, and 330 Texas business executives responded to the surveys.
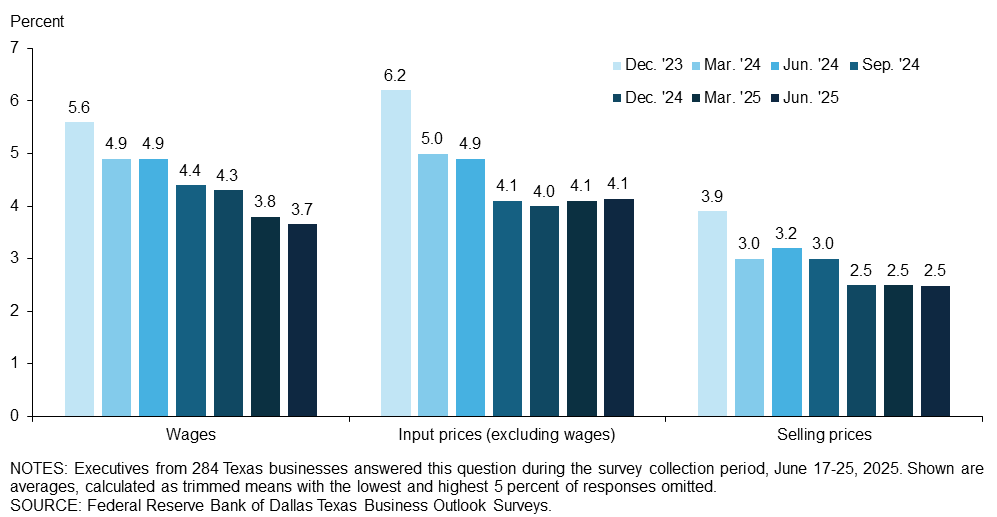
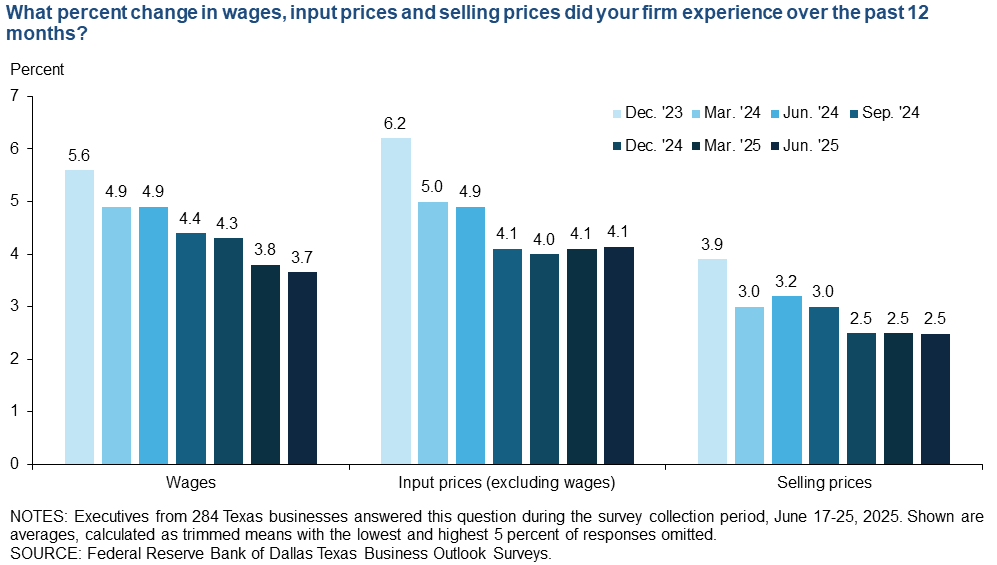
Wage growth continues to edge down, while price growth is holding steady overall. Texas firms reported wage growth of 3.7 percent over the past 12 months, 4.1 percent growth in input prices and 2.5 percent growth in selling prices. Price growth picked up in the manufacturing sector but eased in services.
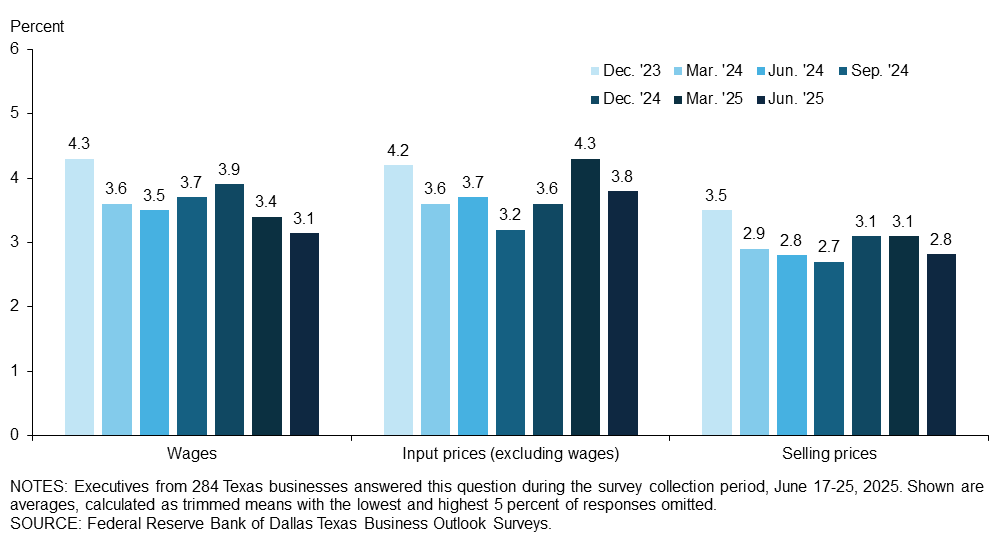
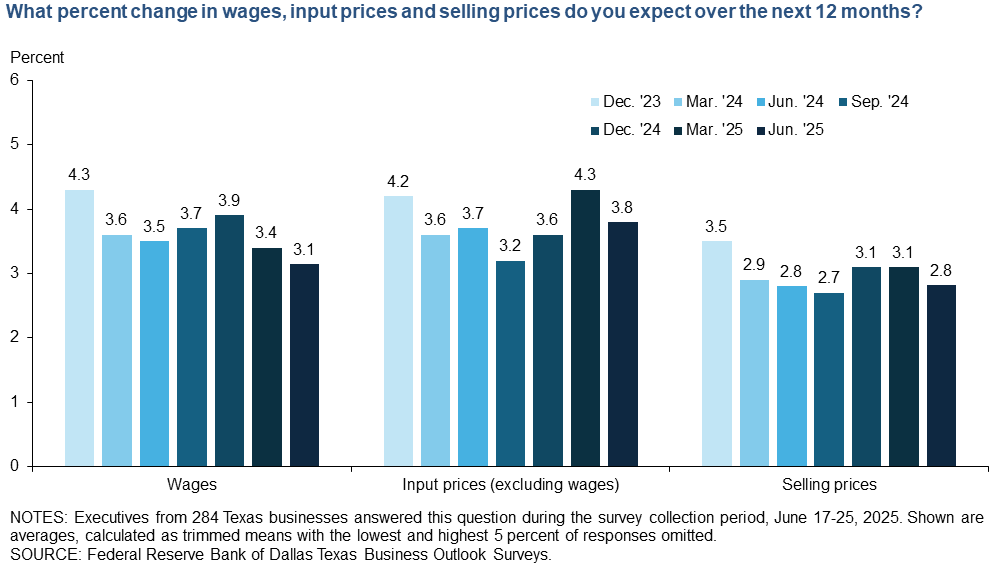
Wage and price growth expectations eased in June. Texas firms surveyed expect wages to increase 3.1 percent over the next 12 months. They expect input prices to increase 3.8 percent and selling prices to increase 2.8 percent.
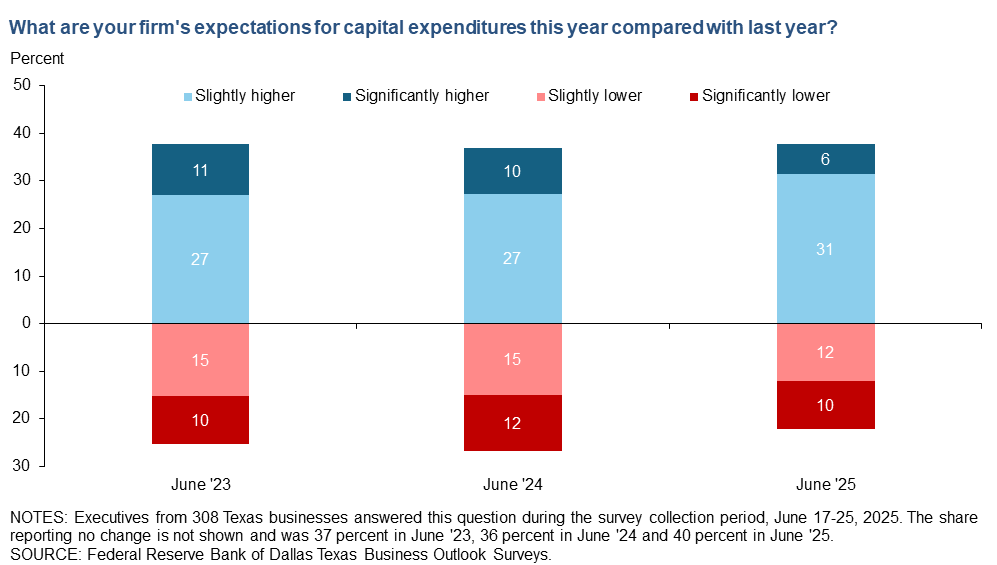
Of the Texas firms surveyed, 37 percent expect growth in capital expenditures this year, exceeding the 22 percent share expecting lower spending. This represents a slightly more positive capital expenditures outlook on net than the prior two years, particularly in the service sector.

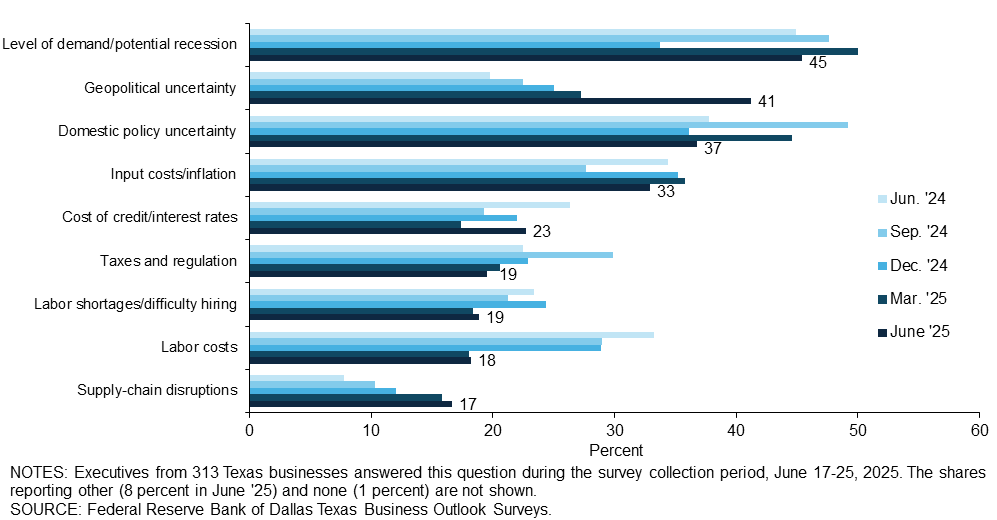
Demand remains the top outlook concern among Texas firms surveyed. Geopolitical uncertainty rose to the No. 2 concern in June, with domestic policy uncertainty now holding the No. 3 spot. Inflation remains a top concern as well.
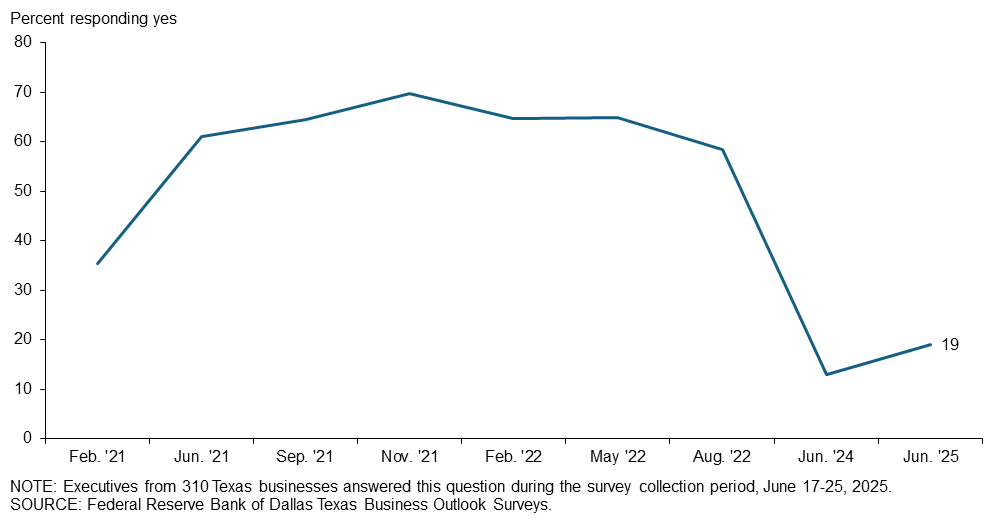
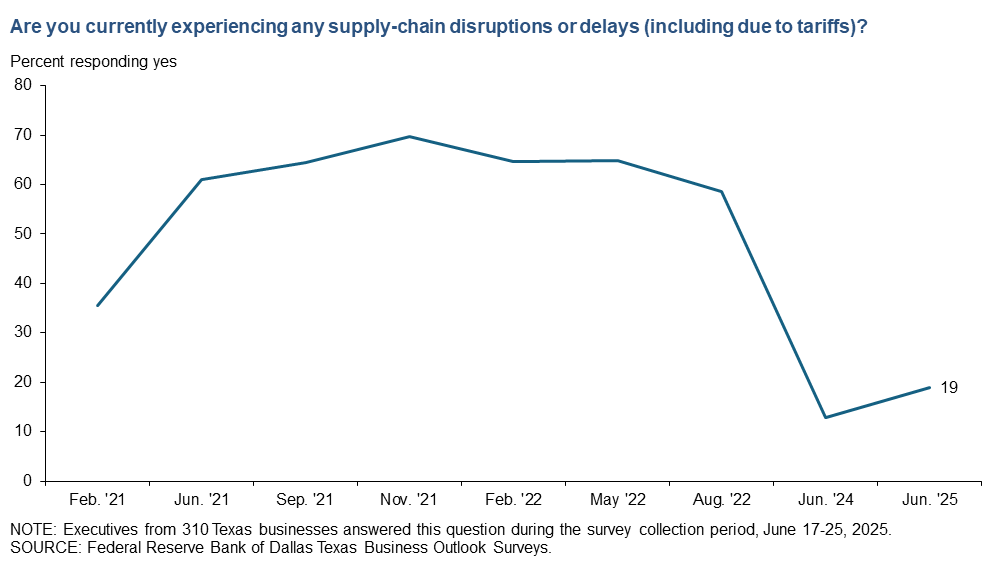
Just under 20 percent of Texas firms surveyed note supply-chain disruptions or delays, up from 13 percent last June but well below the 70 percent share in late 2021. Supply-chain issues are most widespread in the manufacturing sector, where 32 percent of respondents cite disruptions or delays.
Survey respondents were given the opportunity to also provide comments, which can be found in the Comments tab above.
Texas Manufacturing Outlook Survey
Data were collected June 17–25, and 77 Texas manufacturers responded to the survey.
| Sept. '24 | Dec. '24 | March '25 | June '25 | |||||
| Past 12 months (percent) |
Next 12 months (percent) |
Past 12 months (percent) |
Next 12 months (percent) |
Past 12 months (percent) |
Next 12 months (percent) |
Past 12 months (percent) |
Next 12 months (percent) |
|
| Wages | 4.1 | 3.4 | 4.0 | 3.4 | 3.6 | 3.2 | 3.3 | 3.1 |
| Input prices (excluding wages) | 3.6 | 2.9 | 3.8 | 3.7 | 4.5 | 4.9 | 5.5 | 4.5 |
| Selling prices | 2.8 | 2.7 | 2.0 | 3.3 | 2.0 | 3.8 | 3.0 | 3.7 |
NOTES: 67 responses. Shown are averages, calculated as trimmed means with the lowest and highest 5 percent of responses omitted.
| June '23 (percent) |
June '24 (percent) |
June '25 (percent) |
|
| Significantly higher | 13.6 | 16.0 | 8.3 |
| Slightly higher | 27.2 | 27.2 | 36.1 |
| No change | 30.9 | 25.9 | 23.6 |
| Slightly lower | 12.3 | 11.1 | 15.3 |
| Significantly lower | 16.0 | 19.8 | 16.7 |
NOTE: 72 responses.
| Mar. '24 (percent) |
June '24 (percent) |
Sept. '24 (percent) |
Dec. '24 (percent) |
Mar. '25 (percent) |
June '25 (percent) |
|
| Level of demand/potential recession | 52.5 | 52.4 | 63.2 | 37.5 | 50.0 | 47.9 |
| Input costs/inflation | 33.8 | 30.5 | 28.9 | 37.5 | 43.8 | 45.2 |
| Geopolitical uncertainty | 22.5 | 23.2 | 27.6 | 35.0 | 30.0 | 43.8 |
| Supply-chain disruptions | 7.5 | 13.4 | 19.7 | 20.0 | 17.5 | 30.1 |
| Domestic policy uncertainty | 46.3 | 41.5 | 56.6 | 45.0 | 40.0 | 27.4 |
| Taxes and regulation | 23.8 | 30.5 | 31.6 | 16.3 | 23.8 | 23.3 |
| Labor shortages/difficulty hiring | 17.5 | 25.6 | 14.5 | 22.5 | 18.8 | 17.8 |
| Cost of credit/interest rates | 20.0 | 19.5 | 13.2 | 13.8 | 10.0 | 13.7 |
| Labor costs | 28.8 | 26.8 | 26.3 | 25.0 | 15.0 | 13.7 |
| Other | 0.0 | 2.4 | 1.3 | 8.8 | 15.0 | 11.0 |
| None | 2.5 | 2.4 | 0.0 | 2.5 | 2.5 | 0.0 |
NOTE: 73 responses.
| Feb. '21 (percent) |
Sept. '21 (percent) |
Feb. '22 (percent) |
Aug. '22 (percent) |
June '24 (percent) |
June '25 (percent) |
|
| Yes | 61.8 | 92.0 | 92.5 | 70.9 | 18.3 | 32.4 |
| No | 38.2 | 8.0 | 7.5 | 29.1 | 81.7 | 67.6 |
NOTE: 74 responses.
The following question was posed to those indicating they are currently experiencing supply-chain disruptions/delays in question 4.
- Longer lead times at the factory and port.
- Price increases due to tariffs.
- Items from Japan and Europe.
- We are seeing delays for batteries and magnets.
- Uncertainty in the manufacturing of electronics products, increased costs for chips and other issues have created uncertain demand. We have also seen a 100 percent drop in customer business-to-business order volume due to uncertainty. The increase in parts costs has also delayed customer demand.
- Shortages due to tariffs. We are unable to find product or can only find it at a prohibitive cost. Vendors are not able to price products and have to go through additional hoops for procurement approval for regular items.
- There is no certainty of prices (as they are subject to fluctuating tariffs) for imported supplies.
- Fresh vegetables from Mexico have been disrupted or delayed. We also source new machinery from Europe and have seen increased costs from tariffs and delayed delivery times.
- Customers spent too much time trying to game the shipping and arrival of certain items from China to try and avoid tariff costs.
- Lots held up because of tariffs.
- Adding to the complexity and slow recovery of our global supply chain, the tariffs are creating an impossible environment to plan, both for our business activity and resources including labor, as well as pricing for our products and services.
- Lower availability of raw materials produced domestically, resulting in international purchases and increased prices, including tariff-related charges, as well as longer lead times.
- Tungsten, which is virtually unavailable in the U.S., is required to be imported. Due to tariff increases from China (primary supplier of tungsten), delays have been initiated pending further negotiations with the administration.
- Offshore partners are trying to minimize the disruption of the constantly evolving tariff environment. Place orders, cancel orders, arrange shipping, look for a domestic source. This is silly. Sure, remove barriers to free trade, but play chess not checkers. It's indisputable that the tariffs are being paid by domestic fabricators and consumers, not bad apples offshore.
- Tariff uncertainty and already higher rates are having a negative impact on our business and seemingly affecting consumer spending.
- Tariffs with no option to purchase items from U.S. It will take a while for U.S. factories to be able to produce the raw materials needed.
Survey respondents were given the opportunity to also provide comments, which can be found in the Comments tab above.
Texas Service Sector Outlook Survey
Data were collected June 17–25, and 253 Texas business executives responded to the survey.
| Sept. '24 | Dec. '24 | March '25 | June '25 | |||||
| Past 12 months (percent) |
Next 12 months (percent) |
Past 12 months (percent) |
Next 12 months (percent) |
Past 12 months (percent) |
Next 12 months (percent) |
Past 12 months (percent) |
Next 12 months (percent) |
|
| Wages | 4.6 | 3.9 | 4.5 | 4.1 | 3.8 | 3.5 | 3.8 | 3.2 |
| Input prices (excluding wages) | 4.4 | 3.4 | 4.0 | 3.5 | 4.0 | 4.1 | 3.8 | 3.6 |
| Selling prices | 3.1 | 2.7 | 2.6 | 3.0 | 2.7 | 2.9 | 2.3 | 2.5 |
NOTES: 217 responses. Shown are averages, calculated as trimmed means with the lowest and highest 5 percent of responses omitted.
| June '23 (percent) |
June '24 (percent) |
June '25 (percent) |
|
| Significantly higher | 9.8 | 7.5 | 5.5 |
| Slightly higher | 26.9 | 27.4 | 30.1 |
| No change | 38.9 | 39.7 | 45.3 |
| Slightly lower | 16.0 | 16.3 | 11.0 |
| Significantly lower | 8.4 | 9.1 | 8.1 |
NOTE: 72 responses.
| Mar. '24 (percent) |
June '24 (percent) |
Sept. '24 (percent) |
Dec. '24 (percent) |
Mar. '25 (percent) |
June '25 (percent) |
|
| Level of demand/potential recession | 38.6 | 42.5 | 42.6 | 32.5 | 50.0 | 44.6 |
| Geopolitical uncertainty | 15.5 | 18.7 | 20.9 | 21.8 | 26.3 | 40.4 |
| Domestic policy uncertainty | 38.6 | 36.5 | 46.8 | 33.3 | 46.2 | 39.6 |
| Input costs/inflation | 29.1 | 35.7 | 27.2 | 34.5 | 33.1 | 29.2 |
| Cost of credit/interest rates | 28.3 | 28.6 | 21.3 | 24.6 | 19.9 | 25.4 |
| Labor costs | 36.3 | 35.3 | 29.8 | 30.2 | 19.1 | 19.6 |
| Labor shortages/difficulty hiring | 27.9 | 22.6 | 23.4 | 25.0 | 18.2 | 19.2 |
| Taxes and regulation | 24.7 | 19.8 | 29.4 | 25.0 | 19.5 | 18.3 |
| Supply-chain disruptions | 8.8 | 6.0 | 7.2 | 9.5 | 15.3 | 12.5 |
| Other | 3.6 | 2.4 | 2.6 | 6.0 | 6.8 | 7.1 |
| None | 4.8 | 4.8 | 3.4 | 2.4 | 1.7 | 1.7 |
NOTE: 240 responses.
| Feb. '21 (percent) |
Sept. '21 (percent) |
Feb. '22 (percent) |
Aug. '22 (percent) |
June '24 (percent) |
June '25 (percent) |
|
| Yes | 25.5 | 55.3 | 55.2 | 54.7 | 11.2 | 14.8 |
| No | 74.5 | 44.7 | 44.8 | 45.3 | 88.8 | 85.2 |
NOTE: 236 responses.
The following question was posed to those indicating they are currently experiencing supply-chain disruptions/delays in question 4.
- Electronic testing equipment from overseas suppliers has become harder to source and secure delivery times.
- Eggs continue to be limited on some deliveries.
- Delay in container delivery, delays or uncertainty in receiving restaurant equipment and furniture.
- We purchase all of our green coffee supplies internationally, as well as all of our coffee packaging, cups and most of our supplies. There have only been minor interruptions in the past few months, but the pressure is building as inventories are running lower and competition for product is slightly increasing, likely due to short-buying over the past several months in anticipation of tariff relief and lower prices.
- Our company's offerings include third-party logistics services, which are responsible for arranging transportation, receiving, storing, and distributing inventory. Some customers have shifted inventory or are lowering production of certain items in anticipation of tariffs, particularly those on China. However, in other cases, customers have pulled inventory forward. While the volume balance nets out close to even, a more protectionist tariff regime will likely reduce overall volumes in the long term as pulled-forward inventory dwindles.
- Lead time for many commercial items is running weeks to months longer than normal.
- Our customers are canceling projects.
- Longer lead times on some computer-related equipment due to tariffs on China.
- Construction costs are up due to steel and aluminum tariffs. It is difficult to forecast budgets due to uncertainty of tariff impacts. This causes project owners problems and may lead to delayed or canceled building projects.
- There are projects we have abandoned altogether due to supply-chain disruptions, solar energy being one of the most difficult.
- Needed parts for repair or maintenance have an eight-week backorder or delay. Most of these parts are sourced from Asia.
- Our clients are experiencing disruptions primarily due to pricing changes impacting demand (ex: U.S. steel and aluminum companies jacking up prices when tariffs were going up or down.) Also, efforts to front load materials and components ahead of expected tariffs, which were then not necessary after schizophrenic decisions to postpone them. All this inconsistency causes manufacturing companies to jump through hoops unnecessarily.
- General uncertainty is causing our clients to source from various regions, which adds complexity to the supply chain.
- Parts needed are taking two months longer to produce.
- Liberation Day was like kicking an ant hill in the HVAC industry supply chain. It has been crazy ever since. Price hikes from many suppliers. We expect delays later because so much stuff did not hit the water like it normally does.
- Refrigerant transition to R-454B.
Survey respondents were given the opportunity to also provide comments, which can be found in the Comments tab above.
Texas Retail Outlook Survey
Data were collected June 17–25, and 42 Texas retailers responded to the survey.
| Sept. '24 | Dec. '24 | March '25 | June '25 | |||||
| Past 12 months (percent) |
Next 12 months (percent) |
Past 12 months (percent) |
Next 12 months (percent) |
Past 12 months (percent) |
Next 12 months (percent) |
Past 12 months (percent) |
Next 12 months (percent) |
|
| Wages | 4.6 | 3.8 | 4.3 | 2.9 | 3.7 | 3.4 | 3.3 | 2.7 |
| Input prices (excluding wages) | 3.4 | 2.5 | 3.5 | 3.3 | 4.1 | 4.7 | 4.6 | 4.8 |
| Selling prices | 2.0 | 2.3 | 1.3 | 2.6 | 3.1 | 3.9 | 2.9 | 3.7 |
NOTES: 38 responses. Shown are averages, calculated as trimmed means with the lowest and highest 5 percent of responses omitted.
| June '23 (percent) |
June '24 (percent) |
June '25 (percent) |
|
| Significantly higher | 10.0 | 5.7 | 2.6 |
| Slightly higher | 30.0 | 32.1 | 21.1 |
| No change | 33.3 | 35.8 | 44.7 |
| Slightly lower | 20.0 | 13.2 | 23.7 |
| Significantly lower | 6.7 | 13.2 | 7.9 |
NOTE: 38 responses.
| Mar. '24 (percent) |
June '24 (percent) |
Sept. '24 (percent) |
Dec. '24 (percent) |
Mar. '25 (percent) |
June '25 (percent) |
|
| Geopolitical uncertainty | 14.0 | 15.1 | 19.2 | 25.5 | 23.1 | 55.3 |
| Level of demand/potential recession | 36.0 | 45.3 | 48.1 | 42.6 | 43.6 | 42.1 |
| Input costs/inflation | 34.0 | 37.7 | 26.9 | 38.3 | 46.2 | 39.5 |
| Domestic policy uncertainty | 34.0 | 28.3 | 42.3 | 31.9 | 33.3 | 34.2 |
| Supply-chain disruptions | 16.0 | 7.5 | 13.5 | 17.0 | 25.6 | 28.9 |
| Cost of credit/interest rates | 30.0 | 45.3 | 26.9 | 25.5 | 17.9 | 21.1 |
| Labor costs | 30.0 | 34.0 | 23.1 | 21.3 | 15.4 | 21.1 |
| Labor shortages/difficulty hiring | 34.0 | 18.9 | 25.0 | 27.7 | 23.1 | 15.8 |
| Taxes and regulation | 26.0 | 11.3 | 26.9 | 14.9 | 17.9 | 7.9 |
| Other | 2.0 | 1.9 | 0.0 | 6.4 | 5.1 | 10.5 |
| None | 4.0 | 3.8 | 3.8 | 2.1 | 2.6 | 0.0 |
NOTE: 38 responses.
| Feb. '21 (percent) |
Sept. '21 (percent) |
Feb. '22 (percent) |
Aug. '22 (percent) |
June '24 (percent) |
June '25 (percent) |
|
| Yes | 64.4 | 80.9 | 84.4 | 80.4 | 15.1 | 36.8 |
| No | 35.6 | 19.1 | 15.6 | 19.6 | 84.9 | 63.2 |
NOTE: 38 responses.
The following question was posed to those indicating they are currently experiencing supply-chain disruptions/delays in question 4.
- Tariffs.
- Clothing items that originate in China but mostly South Korea. Metal items such as posts and metal water troughs.
- Vehicles and components produced in foreign countries are being held at their plants until clarity on pricing is resolved.
- Vehicles built outside the U.S. are delayed or resulted in canceled production. Continued delays with parts in the distribution chain.
- Vendors have been unwilling to send items we need as they have held them hoping that tariffs will go down.
- Not sure why other than the tariff scare. Vendors have been going back and forth with available units.
- Imported costs have been added to our wholesale cost.
- Delays.
- Some brands tried to move production to other countries and quickly. The goods won't be ready on time, and it is uncertain if the quality will be the same.
Survey respondents were given the opportunity to also provide comments, which can be found in the Comments tab above.
Questions regarding the Texas Business Outlook Surveys can be addressed to Emily Kerr at emily.kerr@dal.frb.org.
Sign up for our email alert to be automatically notified as soon as the latest surveys are released on the web.
Special Questions Comments
Survey participants are given the opportunity to submit comments. Some comments have been edited for grammar and clarity.