Special Questions

Special Questions
For this month’s survey, Texas business executives were asked supplemental questions on labor market conditions. Results below include responses from participants of all three surveys: Texas Manufacturing Outlook Survey, Texas Service Sector Outlook Survey and Texas Retail Outlook Survey.
Texas Business Outlook Surveys
Data were collected July 15–23, and 331 Texas business executives responded to the surveys.
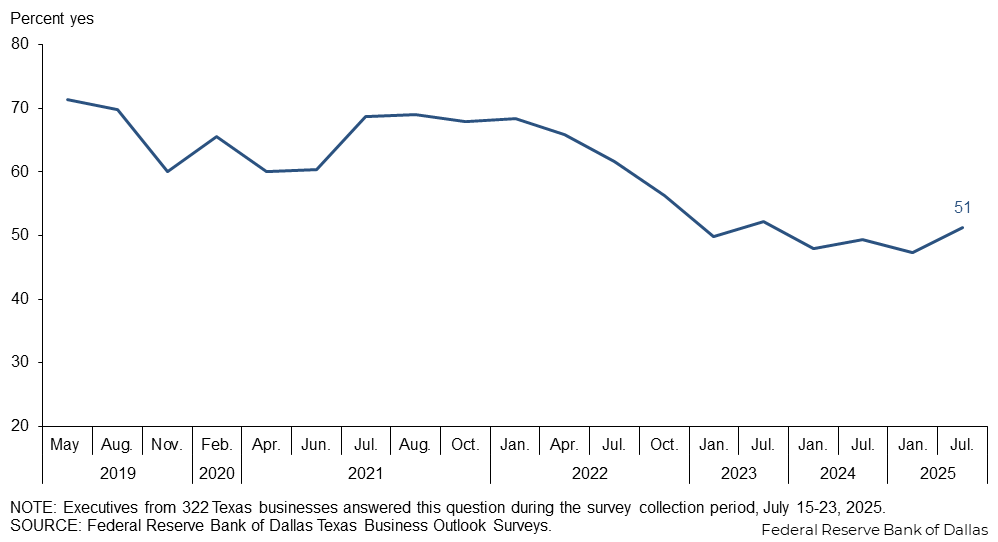
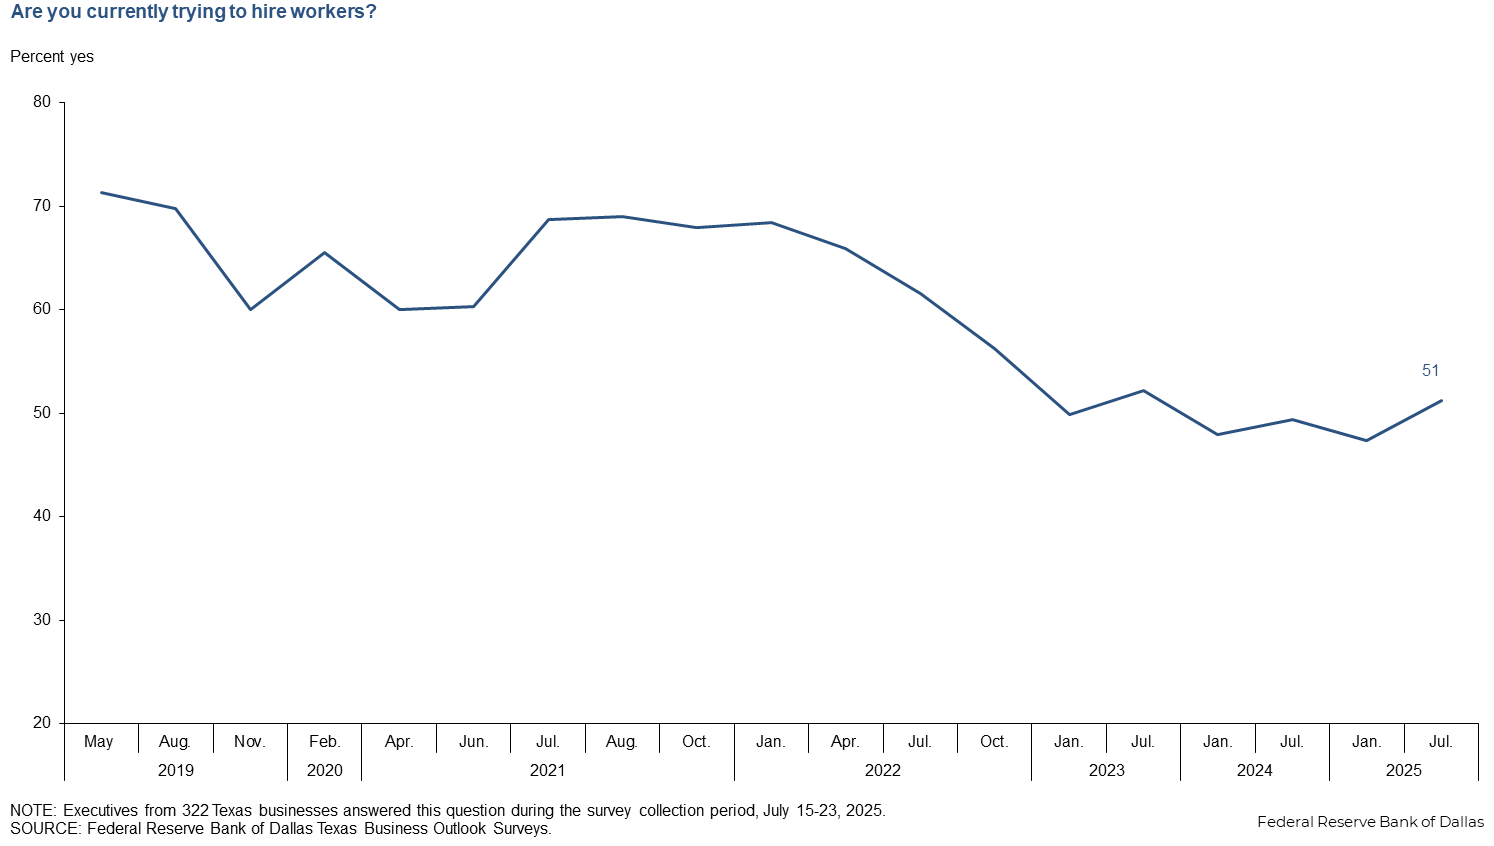
Just over half of firms are currently trying to hire, up from 47 percent in January but below what was seen in 2019-2021. Hiring is most widespread among retailers (67 percent), and most limited among manufacturers (43 percent).
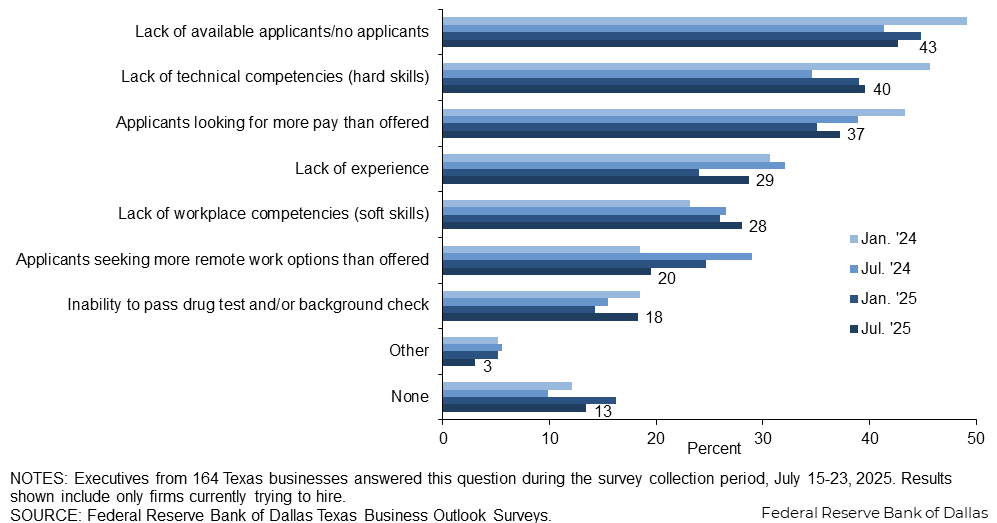
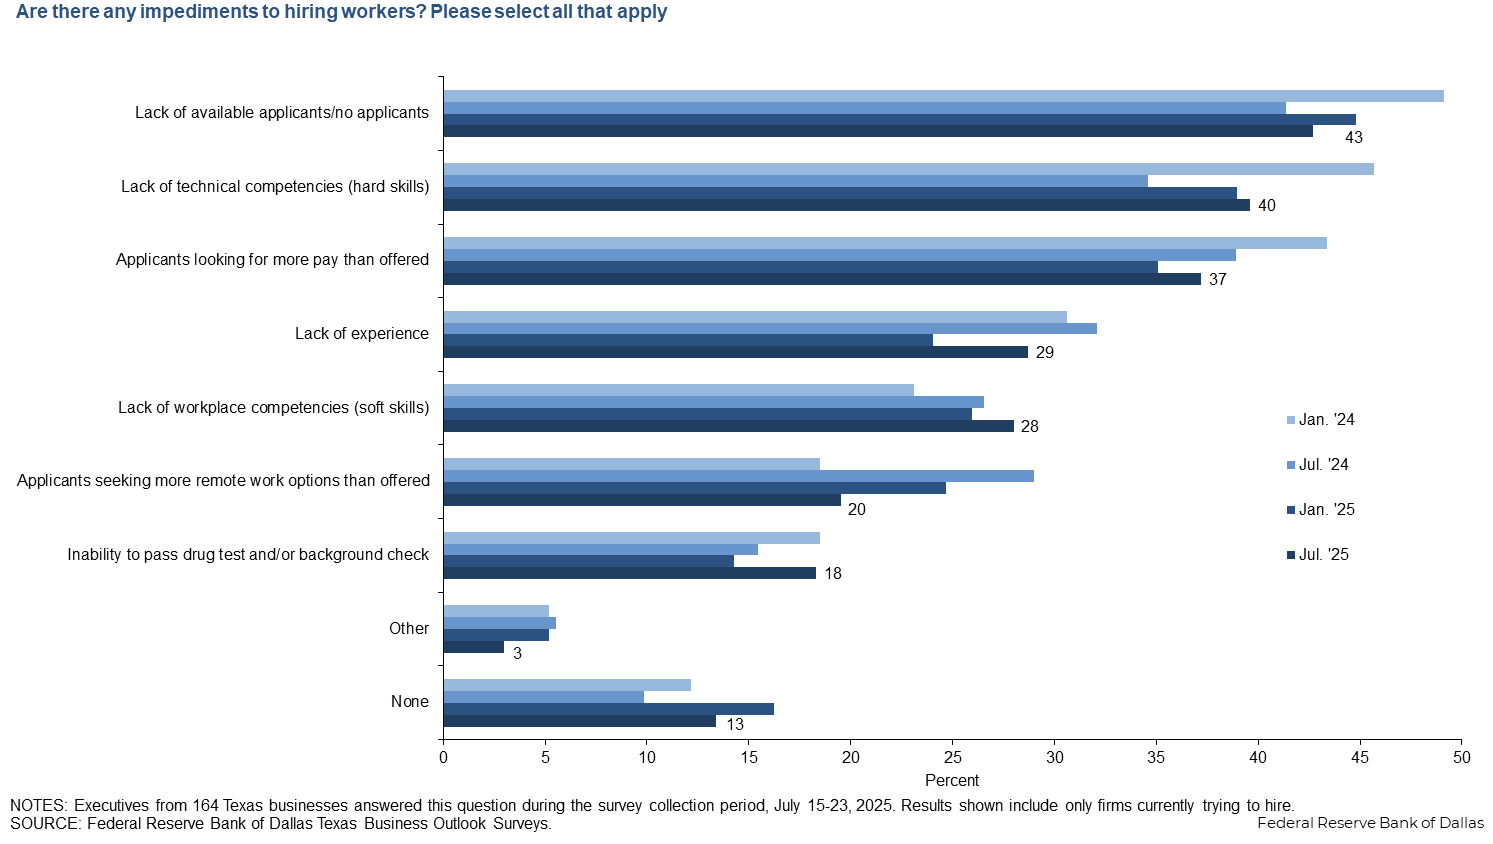
Lack of applicants remains the top hiring impediment, followed by a lack of hard skills among applicants and applicants looking for more pay than offered. Applicants seeking more remote work than offered retreated as an obstacle, while the share of respondents citing lack of experience and inability to pass drug test and/or background check as hiring impediments increased from January.
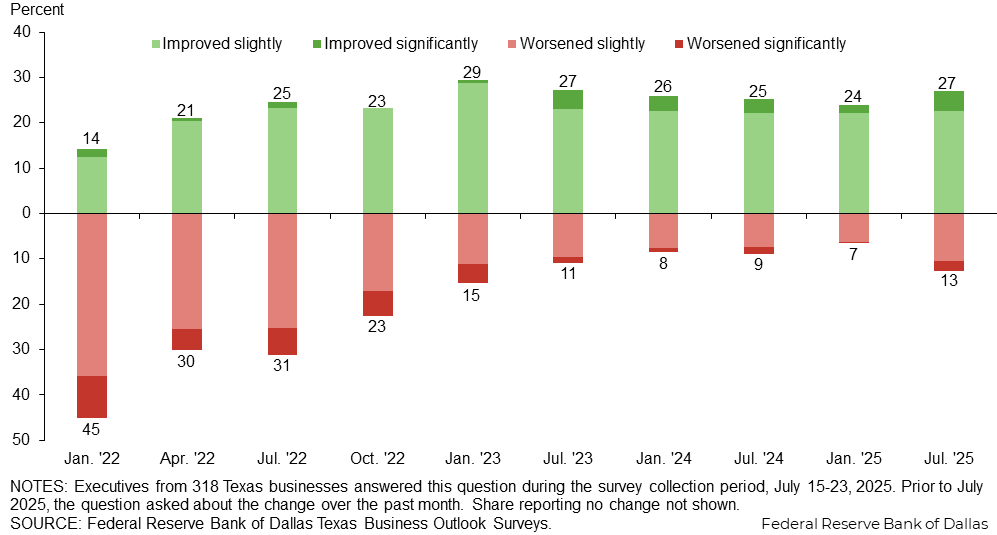
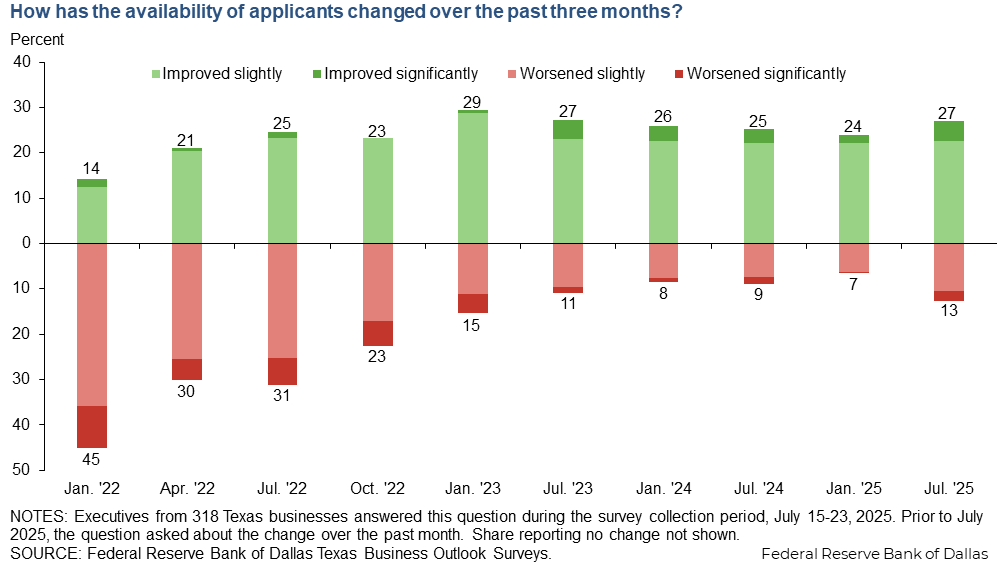
Availability of applicants improved on net over the past three months, a continuation of the trend seen since the beginning of 2023.
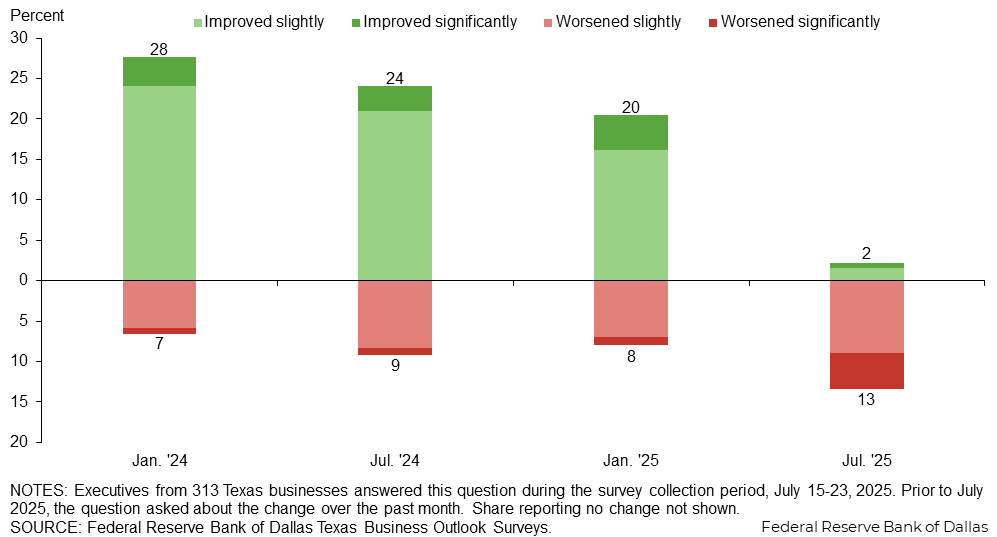
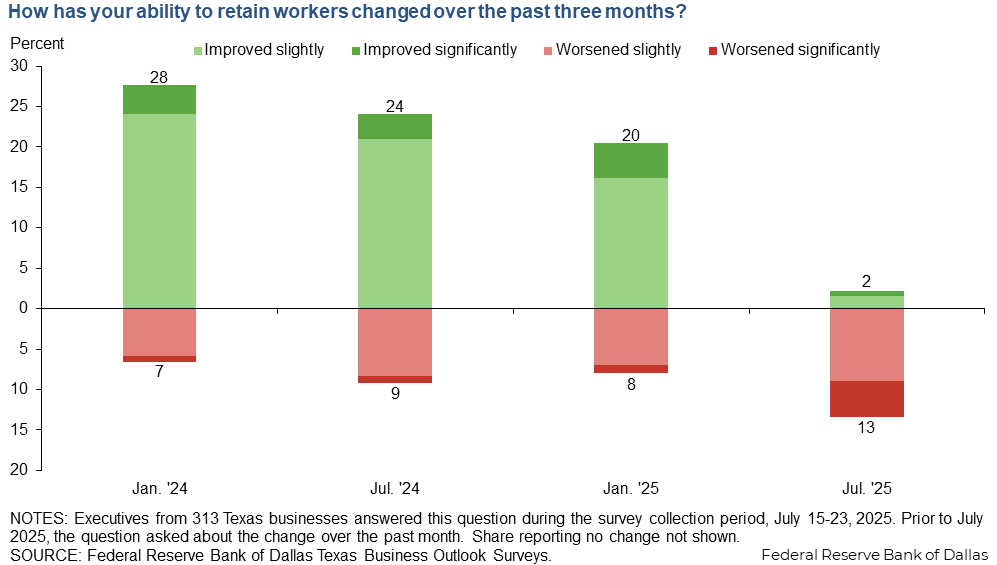
Worker retention has become more difficult over the past three months on net, a change from the beginning of the year, though the vast majority of firms (84 percent) notes no change in their ability to retain workers.
Thirteen percent of firms reported an impact from immigration policy changes. There was some variation by sector, with the most widespread effect reported in the service sector (14 percent) followed by retail (10 percent) then manufacturing (7 percent).
| Jul. '25 (percent) |
|
| Yes | 12.6 |
| No | 87.4 |
NOTES: 317 responses. The survey posed a similar question in February.
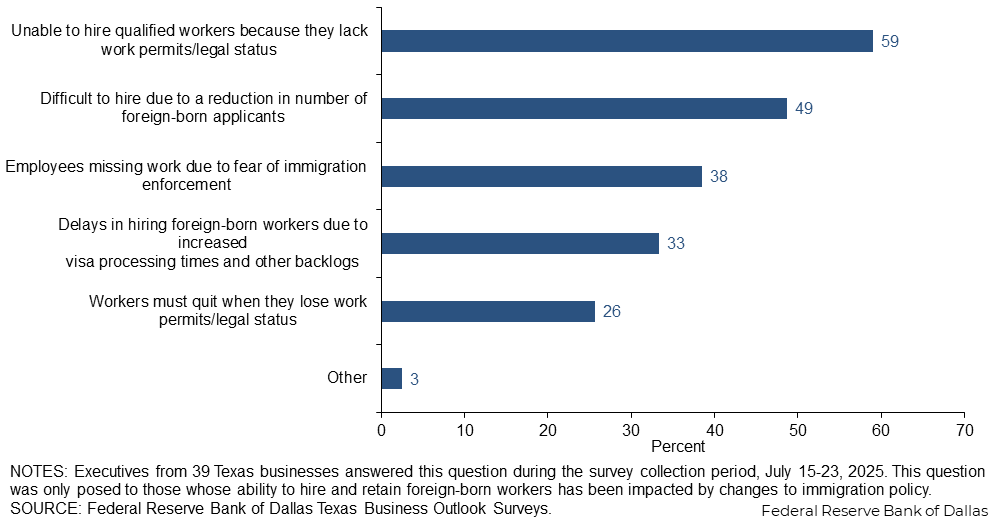
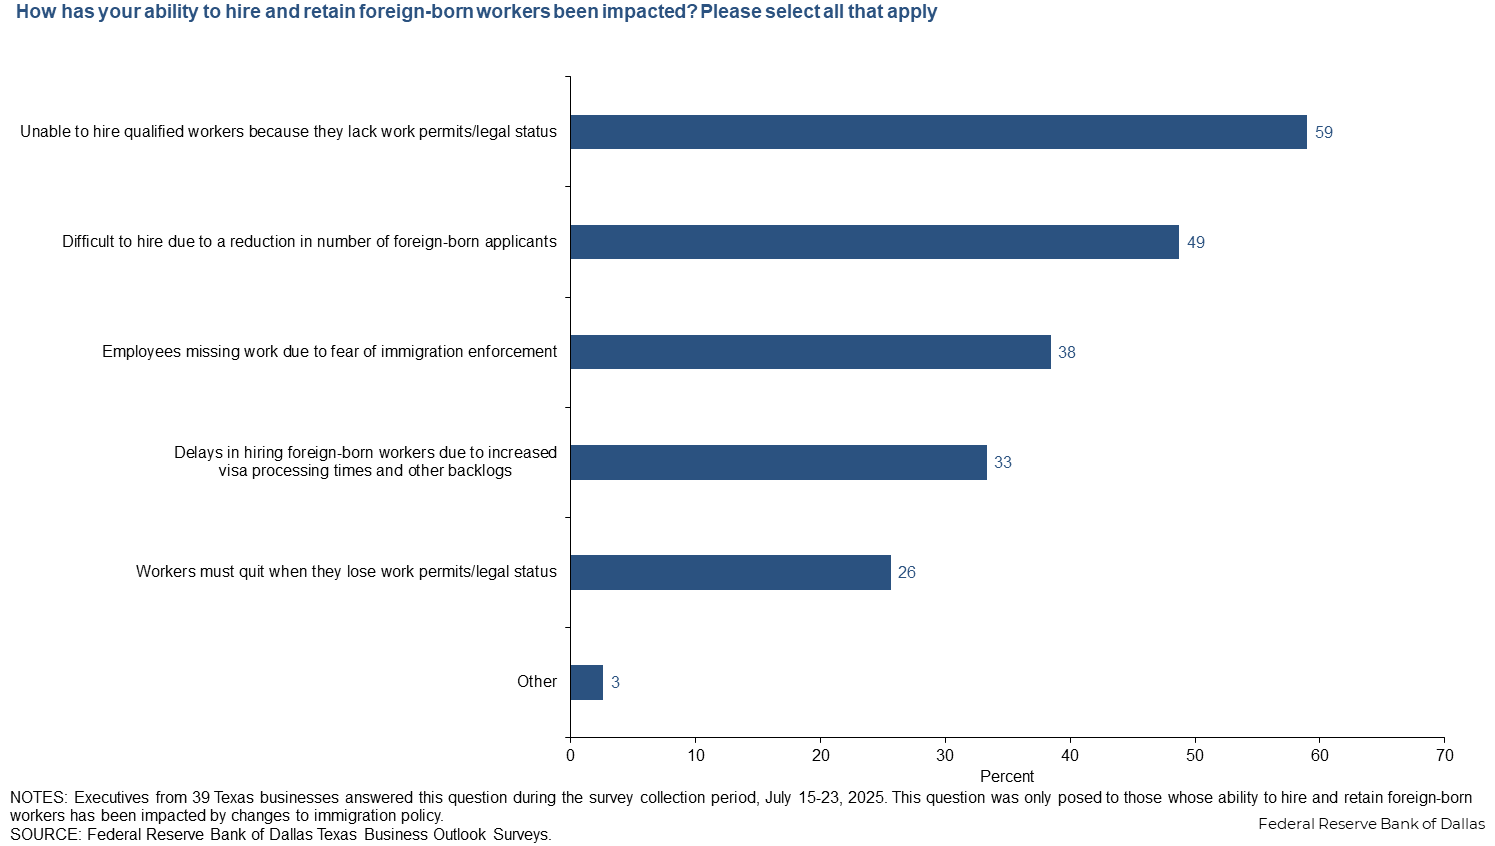
Among firms experiencing workforce disruption from changes to immigration policy, the inability to hire qualified workers because they lack work permits or legal status was the most widespread impact noted. It was followed by difficulty hiring due to a reduction in the number of foreign-born applicants.
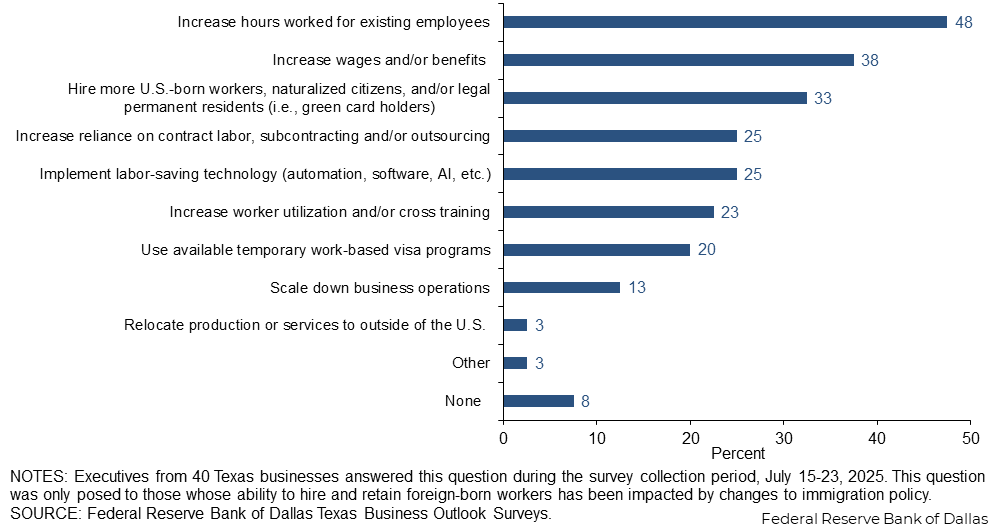
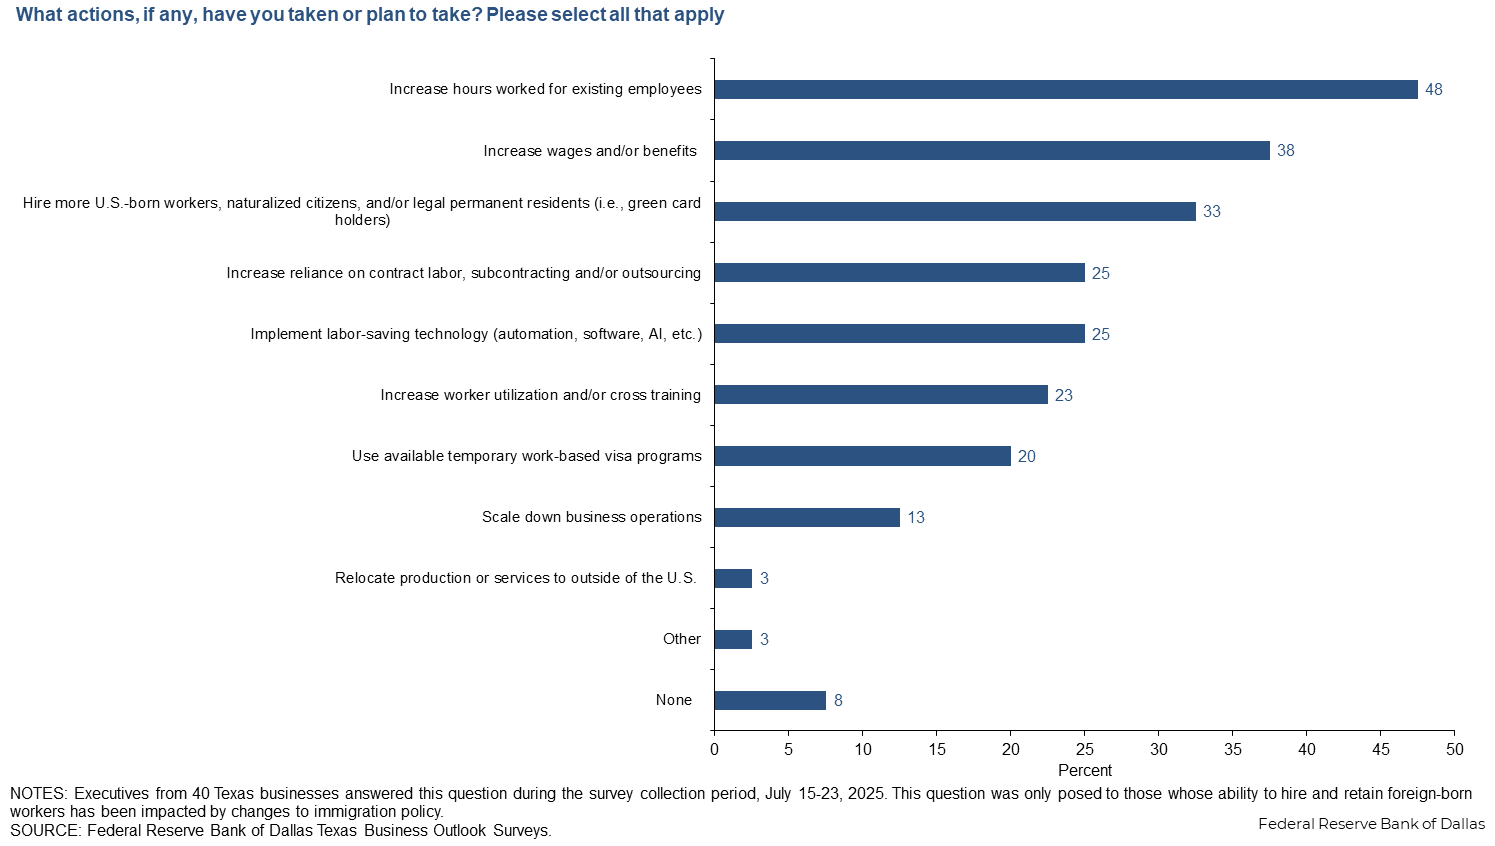
Among firms whose ability to hire and retain foreign-born workers has been impacted by changes to immigration policy, the top two actions taken are increasing hours worked for existing employees and increasing wages and/or benefits.
The survey posed a similar question in February.
In addition to the 13 percent of firms reporting they have already experienced impacts from changes to immigration policy, 7 percent expect an impact in their ability to hire and retain foreign-born workers this year.
| Jul. '25 (percent) |
|
| Yes | 7.1 |
| No | 92.9 |
NOTES: 269 responses. This question was only posed to those answering no to question 5. The survey posed a similar question in February.
Among firms who expect their ability to hire and retain foreign-born workers to be impacted by changes to immigration policy, the top two actions planned are implementing labor-saving technology and hiring more U.S.-born workers, naturalized citizens and/or legal permanent residents.
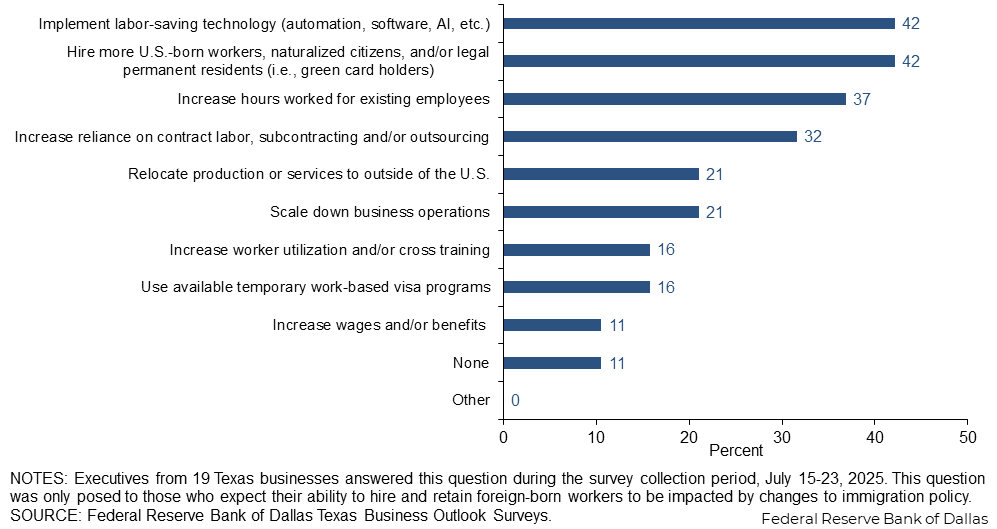
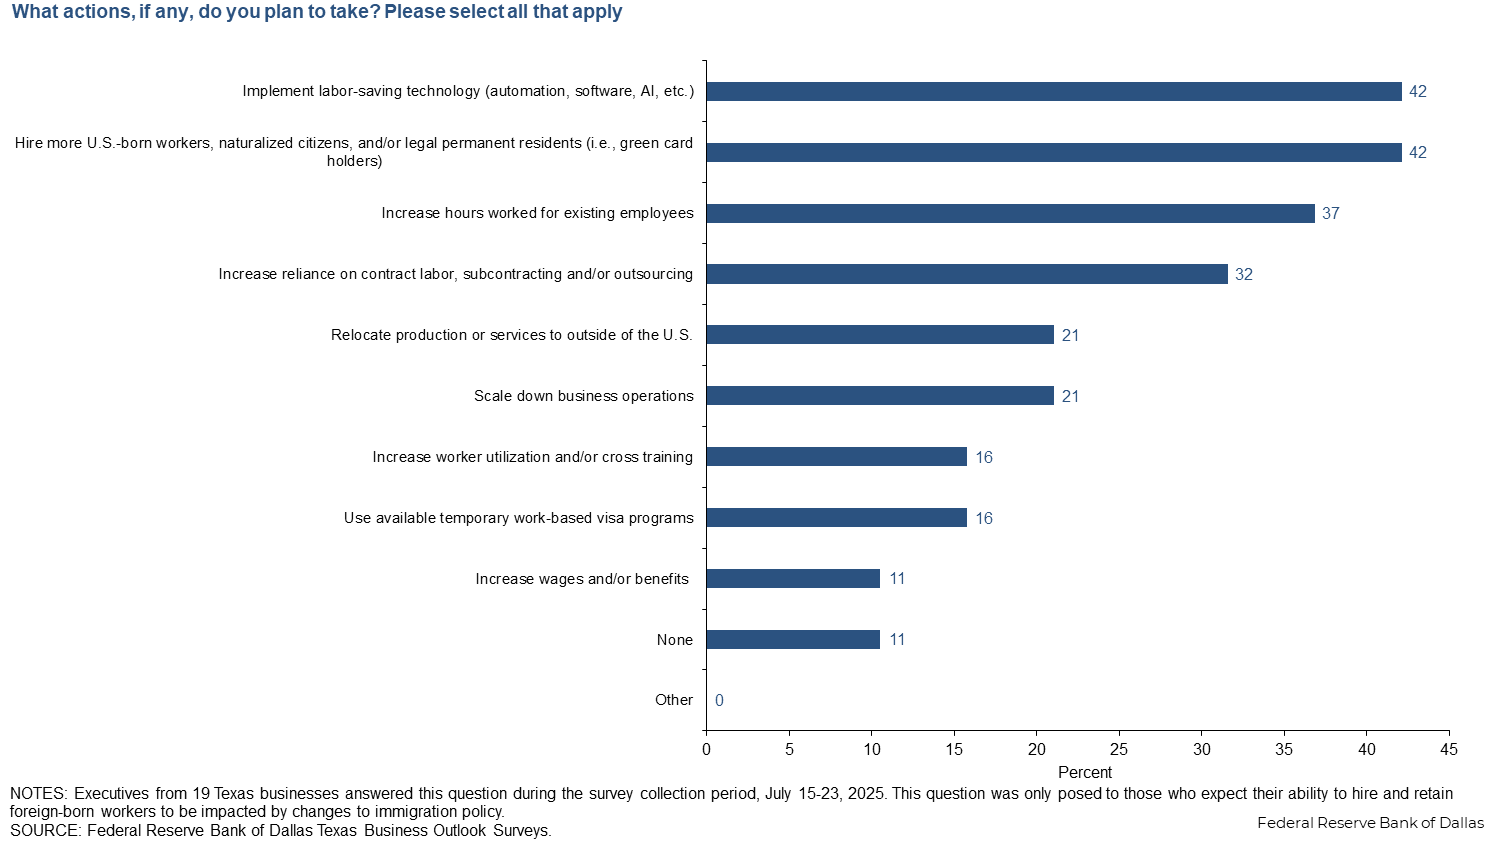
The survey posed a similar question in February.
This prompt was given to those whose ability to hire and retain foreign-born workers has been or is expected to be impacted by changes to immigration policy. Responses can be found on the individual survey Special Questions results pages, accessible in the tabs above.
Survey respondents were given the opportunity to also provide comments, which can be found in the Comments tab above.
Texas Manufacturing Outlook Survey
Data were collected July 15–23, and 79 Texas manufacturers responded to the survey.
| Jan. '23 (percent) |
Jul. '23 (percent) |
Jan. '24 (percent) |
Jul. '24 (percent) |
Jan. '25 (percent) |
Jul.'25 (percent) |
|
| Yes | 52.0 | 55.4 | 46.1 | 46.2 | 42.5 | 43.4 |
| No | 48.0 | 44.6 | 53.9 | 53.8 | 57.5 | 56.6 |
NOTE: 76 responses.
| Jan. '23 (percent) |
Jul. '23 (percent) |
Jan. '24 (percent) |
Jul. '24 (percent) |
Jan. '25 (percent) |
Jul.'25 (percent) |
|
| Lack of technical competencies (hard skills) | 69.2 | 60.9 | 63.4 | 41.7 | 52.9 | 51.5 |
| Lack of available applicants/no applicants | 69.2 | 56.5 | 53.7 | 36.1 | 35.3 | 42.4 |
| Applicants looking for more pay than offered | 44.2 | 45.7 | 31.7 | 33.3 | 35.3 | 36.4 |
| Lack of experience | 50.0 | 56.5 | 39.0 | 25.0 | 32.4 | 27.3 |
| Lack of workplace competencies (soft skills) | 46.2 | 30.4 | 29.3 | 19.4 | 29.4 | 24.2 |
| Inability to pass drug test and/or background check | 40.4 | 23.9 | 19.5 | 19.4 | 20.6 | 24.2 |
| Applicants seeking more remote work options than offered | 12.2 | 22.2 | 20.6 | 9.1 | ||
| Other | 1.9 | 0.0 | 2.4 | 5.6 | 2.9 | 6.1 |
| None | 1.9 | 4.3 | 9.8 | 16.7 | 23.5 | 18.2 |
NOTES: 33 responses. Results shown include only firms answering yes to question 1.
| Jan. '23 (percent) |
Jul. '23 (percent) |
Jan. '24 (percent) |
Jul. '24 (percent) |
Jan. '25 (percent) |
Jul.'25 (percent) |
|
| Improved significantly | 0.0 | 4.9 | 3.4 | 3.9 | 1.2 | 5.4 |
| Improved slightly | 22.9 | 22.2 | 25.0 | 23.7 | 21.0 | 23.0 |
| No change | 60.0 | 65.4 | 64.8 | 59.2 | 69.1 | 56.8 |
| Worsened slightly | 11.4 | 7.4 | 4.5 | 9.2 | 7.4 | 12.2 |
| Worsened significantly | 5.7 | 0.0 | 2.3 | 3.9 | 1.2 | 2.7 |
NOTE: 74 responses. Prior to July 2025, the question asked about the change over the past month.
| Jan. '24 (percent) |
Jul. '24 (percent) |
Jan. '25 (percent) |
Jul. '25 (percent) |
|
| Improved significantly | 7.9 | 3.9 | 6.2 | 0.0 |
| Improved slightly | 24.7 | 27.6 | 19.8 | 0.0 |
| No change | 59.6 | 63.2 | 65.4 | 90.1 |
| Worsened slightly | 6.7 | 3.9 | 8.6 | 8.5 |
| Worsened significantly | 1.1 | 1.3 | 0.0 | 1.4 |
NOTES: 71 responses. Prior to July 2025, the question asked about the change over the past month.
| Jul. '25 (percent) |
|
| Yes | 6.8 |
| No | 93.2 |
NOTES: 74 responses. The survey posed a similar question in February 2025.
| Jul. '25 (percent) |
|
| Yes | 9.0 |
| No | 91.0 |
NOTES: 67 responses. This question was only posed to those answering no to question 5. The survey posed a similar question in February 2025.
The following was posed to those whose ability to hire and retain foreign-born workers has been or is expected to be impacted by changes to immigration policy.
- The immigration policy will increase the overall wage rate and also increase reliance on contract labor.
- The federal E-Verify system needs to be improved with facial recognition. We need to increase guest worker programs to allow people to legally work and have non-citizen legal status.
- There is more fear of ICE [U.S. Immigration and Customs Enforcement] intervention. We have had no issues with this, since we believe all of our employees are properly documented.
Survey respondents were given the opportunity to also provide comments, which can be found in the Comments tab above.
Texas Service Sector Outlook Survey
Data were collected July 15–23, and 252 Texas business executives responded to the survey.
| Jan. '23 (percent) |
Jul. '23 (percent) |
Jan. '24 (percent) |
Jul. '24 (percent) |
Jan. '25 (percent) |
Jul.'25 (percent) |
|
| Yes | 49.2 | 51.3 | 48.6 | 50.4 | 49.0 | 53.7 |
| No | 50.8 | 48.7 | 51.4 | 49.6 | 51.0 | 46.3 |
NOTE: 246 responses.
| Jan. '23 (percent) |
Jul. '23 (percent) |
Jan. '24 (percent) |
Jul. '24 (percent) |
Jan. '25 (percent) |
Jul.'25 (percent) |
|
| Lack of available applicants/no applicants | 70.1 | 54.7 | 47.7 | 42.9 | 47.5 | 42.7 |
| Applicants looking for more pay than offered | 53.2 | 57.6 | 47.0 | 40.5 | 35.0 | 37.4 |
| Lack of technical competencies (hard skills) | 44.2 | 43.9 | 40.2 | 32.5 | 35.0 | 36.6 |
| Lack of workplace competencies (soft skills) | 29.9 | 26.6 | 21.2 | 28.6 | 25.0 | 29.0 |
| Lack of experience | 40.3 | 40.3 | 28.0 | 34.1 | 21.7 | 29.0 |
| Applicants seeking more remote work options than offered | 20.5 | 31.0 | 25.8 | 22.1 | ||
| Inability to pass drug test and/or background check | 16.2 | 16.5 | 18.2 | 14.3 | 12.5 | 16.8 |
| Other | 5.8 | 5.0 | 6.1 | 5.6 | 5.8 | 2.3 |
| None | 4.5 | 5.8 | 12.9 | 7.9 | 14.2 | 12.2 |
NOTES: 131 responses. Results shown include only firms answering yes to question 1.
| Jan. '23 (percent) |
Jul. '23 (percent) |
Jan. '24 (percent) |
Jul. '24 (percent) |
Jan. '25 (percent) |
Jul.'25 (percent) |
|
| Improved significantly | 0.9 | 4.0 | 3.4 | 2.8 | 2.1 | 4.1 |
| Improved slightly | 30.6 | 23.2 | 21.8 | 21.8 | 22.4 | 22.5 |
| No change | 53.7 | 60.9 | 65.8 | 67.7 | 69.7 | 61.5 |
| Worsened slightly | 11.1 | 10.1 | 8.6 | 6.9 | 5.8 | 9.8 |
| Worsened significantly | 3.7 | 1.8 | 0.4 | 0.8 | 0.0 | 2.0 |
NOTE: 244 responses. Prior to July 2025, the question asked about the change over the past month.
| Jan. '24 (percent) |
Jul. '24 (percent) |
Jan. '25 (percent) |
Jul. '25 (percent) |
|
| Improved significantly | 2.2 | 2.8 | 3.7 | 0.8 |
| Improved slightly | 23.8 | 19.0 | 15.0 | 2.1 |
| No change | 67.8 | 67.7 | 73.6 | 82.6 |
| Worsened slightly | 5.5 | 9.7 | 6.5 | 9.1 |
| Worsened significantly | 0.7 | 0.8 | 1.2 | 5.4 |
NOTES: 242 responses. Prior to July 2025, the question asked about the change over the past month.
| Jul. '25 (percent) |
|
| Yes | 14.4 |
| No | 85.6 |
NOTES: 243 responses. The survey posed a similar question in February 2025.
| Jul. '25 (percent) |
|
| Yes | 6.4 |
| No | 93.6 |
NOTES: 202 responses. This question was only posed to those answering no to question 5. The survey posed a similar question in February 2025.
The following was posed to those whose ability to hire and retain foreign-born workers has been or is expected to be impacted by changes to immigration policy.
- The hospitality community relies on considerable labor-intensive work — housekeeping, landscape, food and beverage, etc. Workers and contractors are more and more fearful of coming in to work in hotels and restaurants.
- The temporary work-based visa programs are almost virtually impossible to navigate and are expensive. There is no guarantee of success. We also fear that companies that have illegally hired in the past will now seek our employees. We fear they will push wages up.
- If Washington clamps down hard on immigrants, it will be yet another unknown we will deal with, and all options will be on the table to address the issue.
- A lot of focus has been on the impact of immigration policy on blue collar labor, but we have started seeing early signs of its impact on white collar, educated positions as well. Top recent graduates are rethinking whether they want to stay in the U.S. or move home to their countries of origin, with many of them choosing to return home.
- It is having a larger effect on our clients, which is slowing us down. For us, we have not seen it but are worried about the end of this year and next.
- A tip circulated just this morning that a convoy of officers was moving through Pasadena. The news spread like wildfire, sent folks into hiding and killed our productivity as everyone we know became obsessed with the activity. The stories from our community managers about how roundups are actually being conducted are reminiscent of the way dissidents disappear in third-world countries. It is not good.
- Uncertainty with regulations has led us to pause any new H-1Bs.
- About 8 to 10 percent of our workforce is H-1B. We are seeing that the unpredictable nature of the process, unpredictable rejections and revoking, etc. has led to a lack of mobility in the workforce. We are also seeing that many companies don't want to deal with it and are turning more and more to outsourcing to nearshore and offshore. This results in the job being sent abroad and most likely this job will never come back to the U.S.
- Immigration challenges and changes in policies are directly impacting the company. We like less regulations and flexibility as business owners and leaders.
- Since I am not trying to hire, I don't have a problem. However, the companies I consult for do. Construction will be significantly impacted, as foreign-born workers do so much of the manual labor required. The restrictions and the ICE raids are destroying the construction workplace. Now, if it can't be built, there is no need for my services, which means my revenue goes down.
- Since we manufacture in Mexico, the biggest implication is the inability of the U.S. manufacturing base to support needed raw materials in the supply chain and companies looking to other areas of the globe for their supply chain as well as their final product market. The U.S. is quickly being looked at as an alternative market if we can get our act together.
- Visa changes and processing delays significantly affected our revenue, as did a perception that immigrants are not welcome even if they are legally here.
Survey respondents were given the opportunity to also provide comments, which can be found in the Comments tab above.
Texas Retail Outlook Survey
Data were collected July 15–23, and 44 Texas retailers responded to the survey.
| Jan. '23 (percent) |
Jul. '23 (percent) |
Jan. '24 (percent) |
Jul. '24 (percent) |
Jan. '25 (percent) |
Jul.'25 (percent) |
|
| Yes | 48.6 | 57.1 | 46.4 | 39.2 | 48.8 | 67.4 |
| No | 51.4 | 42.9 | 53.6 | 60.8 | 51.2 | 32.6 |
NOTE: 43 responses.
| Jan. '23 (percent) |
Jul. '23 (percent) |
Jan. '24 (percent) |
Jul. '24 (percent) |
Jan. '25 (percent) |
Jul.'25 (percent) |
|
| Lack of available applicants/no applicants | 79.4 | 62.5 | 57.7 | 45.0 | 47.6 | 51.7 |
| Lack of technical competencies (hard skills) | 55.9 | 46.9 | 42.3 | 30.0 | 42.9 | 44.8 |
| Applicants looking for more pay than offered | 50.0 | 43.8 | 38.5 | 25.0 | 23.8 | 34.5 |
| Lack of workplace competencies (soft skills) | 32.4 | 40.6 | 30.8 | 30.0 | 38.1 | 27.6 |
| Lack of experience | 41.2 | 31.3 | 26.9 | 30.0 | 14.3 | 27.6 |
| Inability to pass drug test and/or background check | 26.5 | 28.1 | 38.5 | 20.0 | 19.0 | 27.6 |
| Applicants seeking more remote work options than offered | 11.5 | 30.0 | 23.8 | 27.6 | ||
| Other | 2.9 | 9.4 | 3.8 | 10.0 | 9.5 | 3.4 |
| None | 0.0 | 6.3 | 11.5 | 5.0 | 9.5 | 6.9 |
NOTES: 29 responses. Results shown include only firms answering yes to question 1.
| Jan. '23 (percent) |
Jul. '23 (percent) |
Jan. '24 (percent) |
Jul. '24 (percent) |
Jan. '25 (percent) |
Jul.'25 (percent) |
|
| Improved significantly | 0.0 | 1.8 | 0.0 | 4.0 | 2.4 | 2.3 |
| Improved slightly | 25.9 | 19.6 | 18.5 | 18.0 | 14.3 | 25.6 |
| No change | 51.9 | 62.5 | 68.5 | 72.0 | 78.6 | 55.8 |
| Worsened slightly | 18.5 | 16.1 | 11.1 | 6.0 | 4.8 | 14.0 |
| Worsened significantly | 3.7 | 0.0 | 1.9 | 0.0 | 0.0 | 2.3 |
NOTE: 43 responses. Prior to July 2025, the question asked about the change over the past month.
| Jan. '24 (percent) |
Jul. '24 (percent) |
Jan. '25 (percent) |
Jul. '25 (percent) |
|
| Improved significantly | 1.8 | 3.9 | 2.3 | 0.0 |
| Improved slightly | 21.4 | 23.5 | 11.6 | 2.4 |
| No change | 71.4 | 66.7 | 83.7 | 92.9 |
| Worsened slightly | 5.4 | 5.9 | 2.3 | 2.4 |
| Worsened significantly | 0.0 | 0.0 | 0.0 | 2.4 |
NOTES: 42 responses. Prior to July 2025, the question asked about the change over the past month.
| Jul. '25 (percent) |
|
| Yes | 9.52 |
| No | 90.5 |
NOTES: 42 responses. The survey posed a similar question in February 2025.
| Jul. '25 (percent) |
|
| Yes | 10.5 |
| No | 89.5 |
NOTES: 38 responses. This question was only posed to those answering no to question 5. The survey posed a similar question in February 2025.
The following was posed to those whose ability to hire and retain foreign-born workers has been or is expected to be impacted by changes to immigration policy.
- Reduced sales to foreign-born customers, customer counts down periodically due to raids by ICE in the area.
Survey respondents were given the opportunity to also provide comments, which can be found in the Comments tab above.
Questions regarding the Texas Business Outlook Surveys can be addressed to Jesus Cañas at jesus.canas@dal.frb.org.
Sign up for our email alert to be automatically notified as soon as the latest surveys are released on the web.
Special Questions Comments
Survey participants are given the opportunity to submit comments. Some comments have been edited for grammar and clarity.