Special Questions

Special Questions
For this month’s survey, Texas business executives were asked supplemental questions on margins, demand, employment and productivity. Results below include responses from participants of all three surveys: Texas Manufacturing Outlook Survey, Texas Service Sector Outlook Survey and Texas Retail Outlook Survey.
Texas Business Outlook Surveys
Data were collected November 10-18 and 310 Texas business executives responded to the surveys.
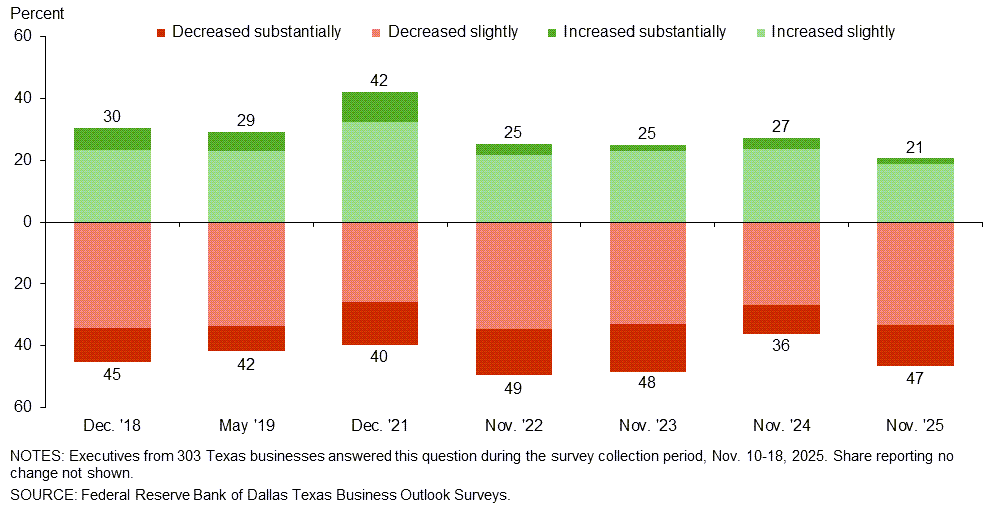
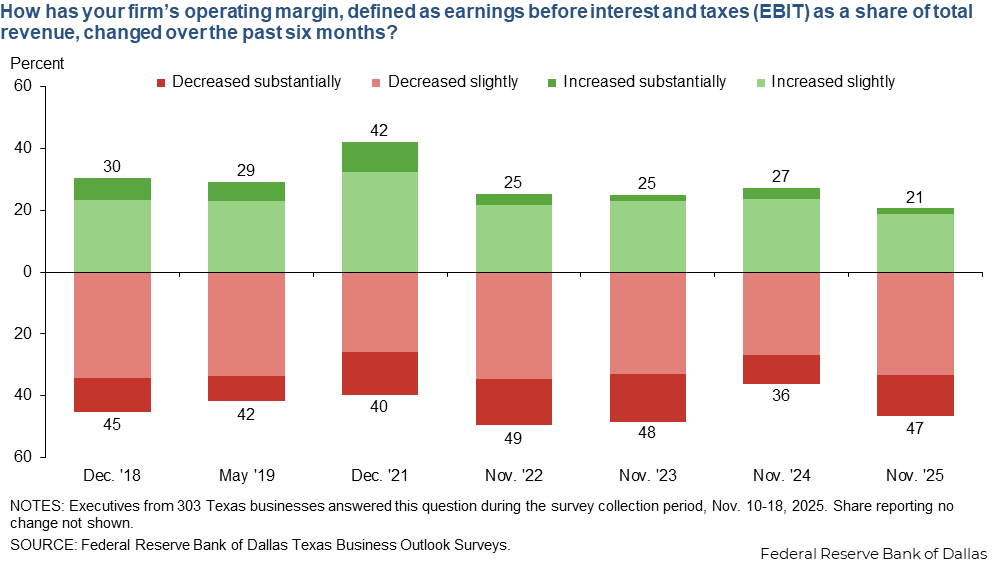
Reports of margin declines are more widespread than a year ago, and the share of Texas businesses citing decreases in margins exceeds the share citing increases. Reports of declining margins over the past six months were most common among retailers (53 percent).
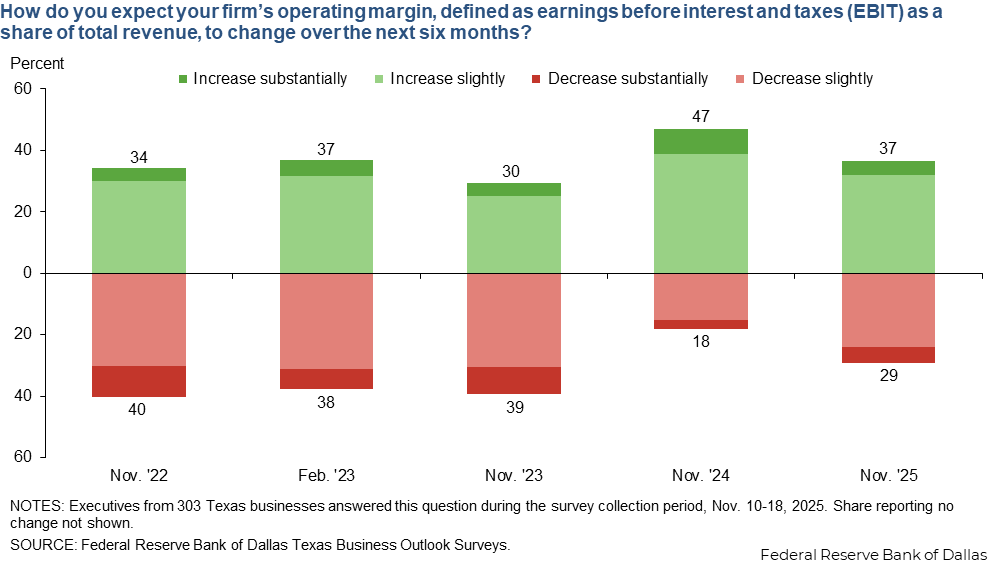
Looking ahead, more Texas businesses expect increases in margins over the next six months than expect decreases. However, the balance of expectations is tilted more to the downside than what was reported a year ago. Margin expectations are weakest among retailers, where 21 percent expect increases versus 43 percent expecting decreases.

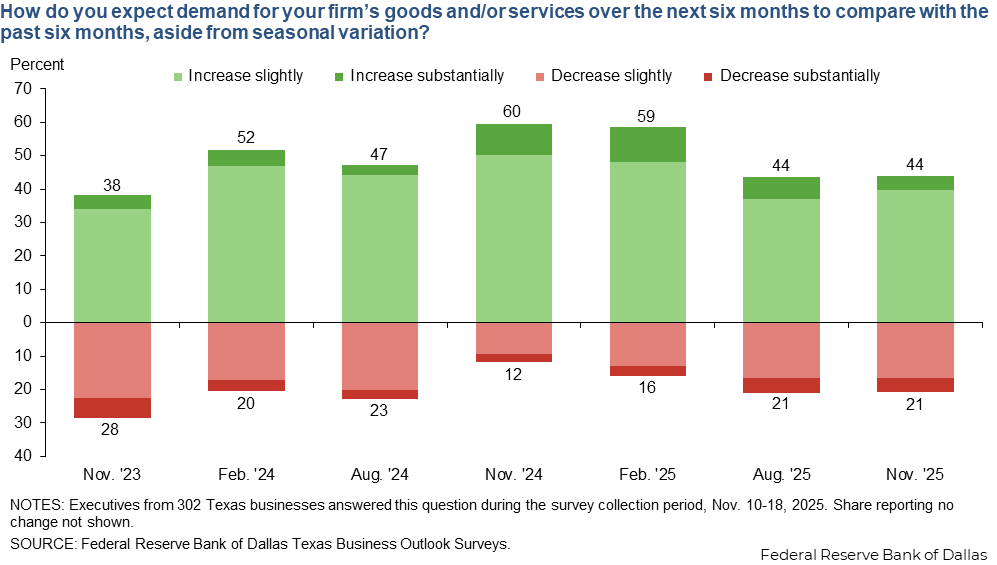
Demand expectations among Texas businesses remain bullish. Of responding firms, 44 percent expect increases in demand over the next six months, exceeding the 21 percent share expecting decreases. The balance of responses is unchanged from August but less optimistic than in February.

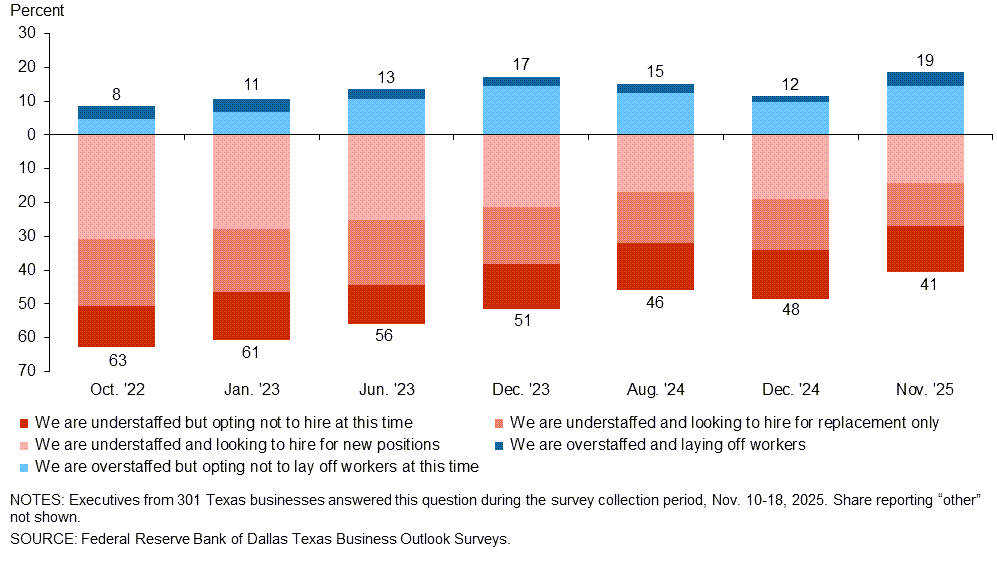
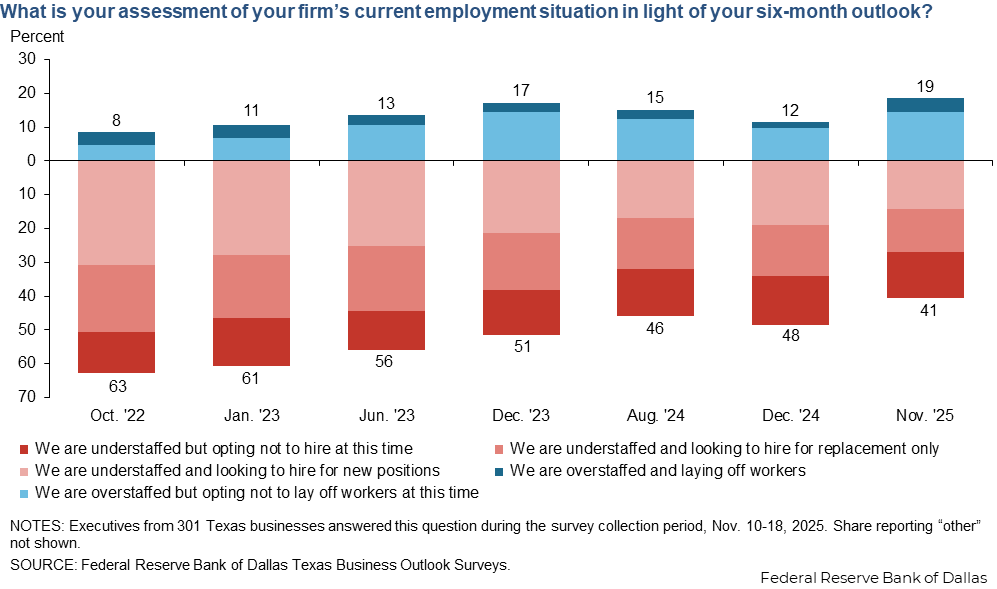
About 40 percent of Texas businesses say they are currently understaffed, with 27 percent intending to hire—either for replacement or for new positions. Overall, this represents the smallest hiring share since this question was first posed in October 2022. On the flip side, about 20 percent of responding firms say they are overstaffed, representing the largest share seen thus far. Among overstaffed firms, most are opting not to lay off workers at this time.
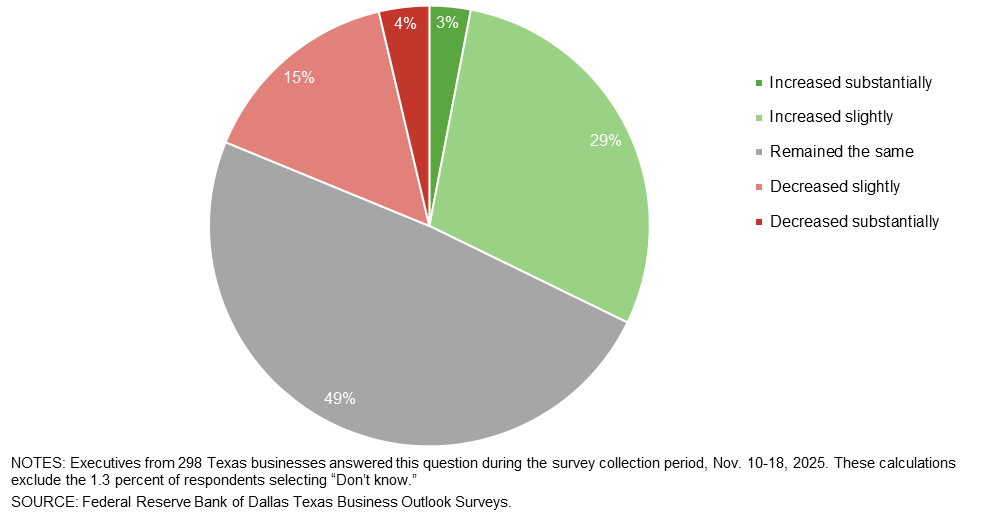
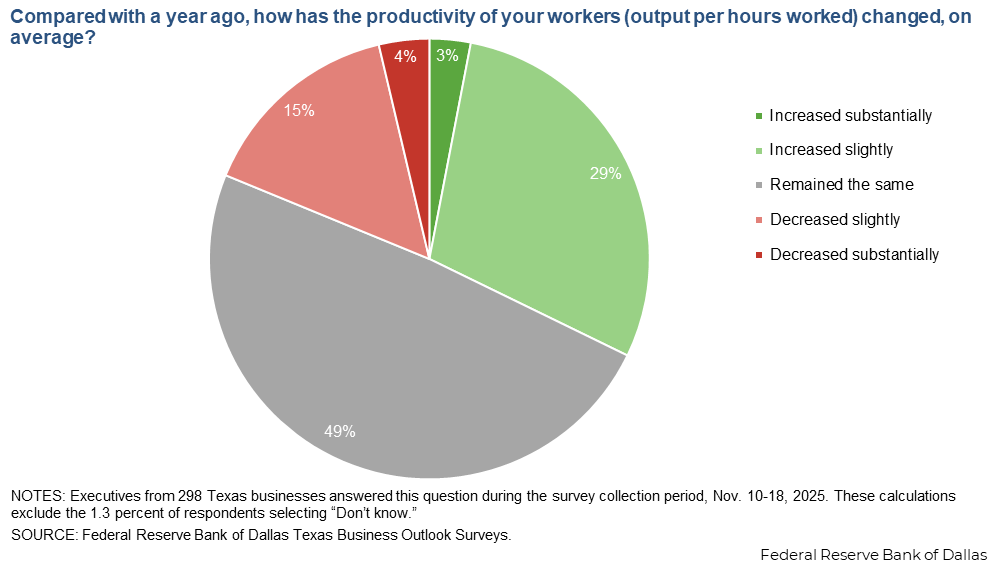
Worker productivity has increased for nearly a third of responding Texas businesses and declined for just under 20 percent. About half of respondents note no change in worker productivity over the past year.
Among firms reporting increased worker productivity compared with a year ago, most say the pace of productivity increases is about the same as usual. Still, a sizable share—38 percent—say productivity is increasing faster than usual.
| Nov. '25 (percent) |
|
| Productivity is increasing faster than usual | 37.6 |
| Productivity is increasing at about the same pace as usual | 51.6 |
| Productivity is increasing slower than usual | 5.4 |
| Productivity had not been increasing but now is | 5.4 |
NOTES: 93 responses. This question was only posed to those noting increased productivity. These calculations exclude the 3.1 percent of respondents selecting “Don’t know.”
The following was posed to those indicating increased productivity in question 5.
Commentary from respondents regarding productivity increases largely points to technology as the driving force, namely the use of AI tools, particularly in the service sector, and also new equipment and machinery, particularly in manufacturing. Several business executives cited benefits from increased training. Some also pointed to productivity improvements from having fewer workers or increased workload, leading to higher output per hour worked across the business.
Responses can be found on the individual survey Special Questions results pages, accessible by the tabs above.
Survey respondents were given the opportunity to also provide comments, which can be found in the Comments tab above.
Texas Business Outlook Surveys
Data were collected November 10-18 and 67 Texas manufacturers responded to the survey.
| Dec. '18 (percent) |
May '19 (percent) |
Dec. '21 (percent) |
Nov. '22 (percent) |
Nov. '23 (percent |
Nov. '24 (percent |
Nov. '25 (percent |
|
| Increased substantially | 11.1 | 11.4 | 4.6 | 5.3 | 2.3 | 4.8 | 1.5 |
| Increased slightly | 24.2 | 23.8 | 26.4 | 14.7 | 32.2 | 21.4 | 19.4 |
| Remained the same | 17.2 | 22.9 | 19.5 | 20.0 | 18.4 | 28.6 | 28.4 |
| Decreased slightly | 35.4 | 33.3 | 25.3 | 38.9 | 27.6 | 32.1 | 34.3 |
| Decreased substantially | 12.1 | 8.6 | 24.1 | 21.1 | 19.5 | 13.1 | 16.4 |
NOTE: 67 responses.
| Nov. '22 (percent) |
Feb. '23 (percent) |
Nov. '23 (percent) |
Nov. '24 (percent) |
Nov. '25 (percent) |
|
| Increase substantially | 5.3 | 3.0 | 4.6 | 16.7 | 6.0 |
| Increase slightly | 32.6 | 37.0 | 24.1 | 35.7 | 35.8 |
| Remain the same | 20.0 | 21.0 | 28.7 | 35.7 | 31.3 |
| Decrease slightly | 28.4 | 31.0 | 28.7 | 10.7 | 19.4 |
| Decrease substantially | 13.7 | 8.0 | 13.8 | 1.2 | 7.5 |
NOTE: 67 responses.
| Nov. '23 (percent) |
Feb. '24 (percent) |
Aug. '24 (percent) |
Nov. '24 (percent) |
Feb. '25 (percent) |
Aug. '25 (percent) |
Nov. '25 (percent) |
|
| Increase substantially | 5.7 | 5.5 | 1.3 | 14.3 | 19.8 | 12.3 | 7.5 |
| Increase slightly | 33.0 | 46.2 | 53.8 | 58.3 | 43.0 | 37.0 | 41.8 |
| Remain the same | 29.5 | 23.1 | 20.0 | 17.9 | 15.1 | 29.6 | 32.8 |
| Decrease slightly | 20.5 | 17.6 | 22.5 | 8.3 | 18.6 | 16.0 | 13.4 |
| Decrease substantially | 11.4 | 7.7 | 2.5 | 1.2 | 3.5 | 4.9 | 4.5 |
NOTE: 67 responses.
| Oct. '22 (percent) |
Jan. '23 (percent) |
Jun. '23 (percent) |
Dec. '23 (percent) |
Aug. '24 (percent) |
Dec. '24 (percent) |
Nov. '25 (percent) |
|
| We are understaffed and looking to hire for new positions | 29.8 | 29.0 | 23.2 | 18.9 | 17.3 | 20.0 | 23.9 |
| We are understaffed and looking to hire for replacement only | 21.3 | 19.0 | 23.2 | 16.7 | 19.8 | 11.3 | 6.0 |
| We are understaffed but opting not to hire at this time | 13.8 | 17.0 | 8.5 | 16.7 | 16.0 | 21.3 | 14.9 |
| We are at our ideal staffing level | 14.9 | 17.0 | 26.8 | 27.8 | 27.2 | 30.0 | 23.9 |
| We are overstaffed but opting not to lay off workers at this time | 8.5 | 9.0 | 13.4 | 18.9 | 13.6 | 13.8 | 23.9 |
| We are overstaffed and laying off workers | 4.3 | 3.0 | 2.4 | 1.1 | 2.5 | 1.3 | 3.0 |
| Other | 7.4 | 6.0 | 2.4 | 0.0 | 3.7 | 2.5 | 4.5 |
NOTE: 67 responses.
| Nov. '25 (percent) |
|
| Increased substantially | 1.5 |
| Increased slightly | 30.8 |
| Remained the same | 46.2 |
| Decreased slightly | 12.3 |
| Decreased substantially | 9.2 |
NOTES: 65 responses. These calculations exclude the 1.5 percent of respondents selecting “Don’t know.”
| Nov. '25 (percent) |
|
| Productivity is increasing faster than usual | 38.1 |
| Productivity is increasing at about the same pace as usual | 57.1 |
| Productivity is increasing slower than usual | 0.0 |
| Productivity had not been increasing but now is | 4.8 |
NOTES: 21 responses. This question was only posed to those noting increased productivity.
The following was posed to those indicating increased productivity in question 5.
- We have put equipment in place to make things more efficient.
- Capital investments in new equipment have made our workforce more productive.
- Productivity is increasing due to new machinery and processes installed and implemented. We are focusing on lower-priced products to service the lower end of the new home construction business. Volume/sales are increasing, as is productivity and profit. But we are gaining market share; the market is not increasing.
- We send employees to class to gain skills.
- Increased orders have added to the need to increase production. We are now working on plans to purchase new equipment to increase production capacity with the same number of employees.
- Our workers are highly trained for their jobs and have become more efficient.
- Continuous improvement initiatives are often offset with required savings in our contracts with customers. The expectation is 3 to 5 percent year-over-year cost reductions, so we try to meet or exceed such.
- The use of AI is improving certain areas of the business as far as efficiency.
- We have implemented RPA (robotic process automation) in many areas of the supply chain, and people are utilizing other AI tools to become more efficient. We expect efficiencies to increase as we invest more in our AI and process automation technology.
- We have implemented flexible work hours with our employees when there is less work to do, which allows us to retain our employees and lower our labor costs, and our employees also like this because it allows them time off to do personal things that they want to do.
- Having a large, visual, work in process has motivated our production folks to push for more production via new ideas for programs and tooling.
- We hired more experienced programmers, which has led to improved output.
Survey respondents were given the opportunity to also provide comments, which can be found in the Comments tab above.
Texas Business Outlook Surveys
Data were collected November 10-18 and 243 Texas business executives responded to the survey.
| Dec. '18 (percent) |
May '19 (percent) |
Dec. '21 (percent) |
Nov. '22 (percent) |
Nov. '23 (percent |
Nov. '24 (percent |
Nov. '25 (percent |
|
| Increased substantially | 5.3 | 4.0 | 11.9 | 3.0 | 1.8 | 3.2 | 2.1 |
| Increased slightly | 22.6 | 22.5 | 34.3 | 24.0 | 19.9 | 24.2 | 18.6 |
| Remained the same | 27.9 | 31.7 | 17.8 | 27.0 | 29.4 | 39.3 | 33.9 |
| Decreased slightly | 33.7 | 33.7 | 25.8 | 33.0 | 34.6 | 25.0 | 33.1 |
| Decreased substantially | 10.6 | 8.0 | 10.2 | 13.0 | 14.3 | 8.3 | 12.3 |
NOTE: 236 responses.
| Nov. '22 (percent) |
Feb. '23 (percent) |
Nov. '23 (percent) |
Nov. '24 (percent) |
Nov. '25 (percent) |
|
| Increase substantially | 4.0 | 5.7 | 4.4 | 5.2 | 4.2 |
| Increase slightly | 29.2 | 30.0 | 25.4 | 39.8 | 30.9 |
| Remain the same | 27.2 | 27.0 | 32.0 | 34.7 | 35.2 |
| Decrease slightly | 30.6 | 31.3 | 30.9 | 16.7 | 25.4 |
| Decrease substantially | 9.0 | 6.0 | 7.4 | 3.6 | 4.2 |
NOTE: 236 responses.
| Nov. '23 (percent) |
Feb. '24 (percent) |
Aug. '24 (percent) |
Nov. '24 (percent) |
Feb. '25 (percent) |
Aug. '25 (percent) |
Nov. '25 (percent) |
|
| Increase substantially | 3.6 | 4.5 | 3.5 | 7.9 | 7.2 | 4.5 | 3.4 |
| Increase slightly | 34.3 | 47.4 | 41.2 | 47.4 | 50.0 | 37.2 | 39.1 |
| Remain the same | 34.7 | 29.3 | 33.3 | 32.0 | 29.2 | 37.2 | 35.7 |
| Decrease slightly | 23.0 | 16.9 | 19.2 | 9.9 | 11.0 | 16.6 | 17.4 |
| Decrease substantially | 4.4 | 1.9 | 2.7 | 2.8 | 2.5 | 4.5 | 4.3 |
NOTE: 235 responses.
| Oct. '22 (percent) |
Jan. '23 (percent) |
Jun. '23 (percent) |
Dec. '23 (percent) |
Aug. '24 (percent) |
Dec. '24 (percent) |
Nov. '25 (percent) |
|
| We are understaffed and looking to hire for new positions | 31.1 | 27.5 | 25.8 | 22.3 | 16.9 | 18.8 | 11.5 |
| We are understaffed and looking to hire for replacement only | 19.3 | 18.5 | 17.8 | 16.9 | 13.3 | 16.0 | 14.5 |
| We are understaffed but opting not to hire at this time | 11.8 | 13.1 | 12.7 | 11.9 | 13.3 | 12.4 | 13.2 |
| We are at our ideal staffing level | 23.0 | 24.9 | 29.1 | 30.4 | 39.2 | 40.0 | 41.0 |
| We are overstaffed but opting not to lay off workers at this time | 3.7 | 6.1 | 9.8 | 13.1 | 12.2 | 8.4 | 12.0 |
| We are overstaffed and laying off workers | 3.4 | 4.2 | 2.9 | 3.1 | 2.7 | 2.0 | 4.3 |
| Other | 7.8 | 5.8 | 1.8 | 2.3 | 2.4 | 2.4 | 3.4 |
NOTE: 234 responses.
| Nov. '25 (percent) |
|
| Increased substantially | 3.4 |
| Increased slightly | 28.8 |
| Remained the same | 49.8 |
| Decreased slightly | 15.9 |
| Decreased substantially | 2.1 |
NOTES: 233 responses. These calculations exclude the 1.3 percent of respondents selecting “Don’t know.”
| Nov. '25 (percent) |
|
| Productivity is increasing faster than usual | 37.5 |
| Productivity is increasing at about the same pace as usual | 50.0 |
| Productivity is increasing slower than usual | 6.9 |
| Productivity had not been increasing but now is | 5.6 |
NOTES: 72 responses. This question was only posed to those noting increased productivity. These calculations exclude the 4.0 percent of respondents selecting “Don’t know.”
The following was posed to those indicating increased productivity in question 5.
- Productivity improved as efficiencies improved. Training of new staff members and seasonal staff has also led to improved productivity.
- Our young sales people are growing into their sales roles nicely, neither more quickly than we thought nor more slowly than we feared.
- AI tools helped increase productivity slightly in the last six months.
- We have put a lot of emphasis on productivity to try to improve it. We have also spent a lot of money on training and education to help our workers improve their productivity.
- AI.
- AI is increasing productivity.
- LLMs [large language models] are helping us do things better or faster, sometimes. This includes coding.
- In-house training is beginning to pay off, coupled with increased workload.
- We let some low-performing employees go. We now have a much better staff.
- The gloomy economic outlook is making staff work more seriously and better. AI tool use is allowing staff to do things in a much shorter time and better.
- Our productivity increases are due to improved skills and technology advancements.
- We are utilizing AI tools where we weren't before.
- We are using AI for some basic tasks.
- Due to staff shortages, we are trying work-arounds and procedure changes to increase productivity with some positive impact.
- We have made improvements to our processes that have driven significant productivity improvements.
- Our team is getting more cohesive.
- As revenues have dropped and costs have increased, we are not replacing workers who leave, so during peak hours less staff has to work more.
Survey respondents were given the opportunity to also provide comments, which can be found in the Comments tab above.
Texas Business Outlook Surveys
Data were collected November 10-18 and 47 Texas retailers responded to the survey.
| Dec. '18 (percent) |
May '19 (percent) |
Dec. '21 (percent) |
Nov. '22 (percent) |
Nov. '23 (percent |
Nov. '24 (percent |
Nov. '25 (percent |
|
| Increased substantially | 2.6 | 2.3 | 16.2 | 3.1 | 0.0 | 0.0 | 2.2 |
| Increased slightly | 10.3 | 15.9 | 32.4 | 13.8 | 19.3 | 25.0 | 11.1 |
| Remained the same | 23.1 | 27.3 | 21.6 | 21.5 | 17.5 | 35.4 | 33.3 |
| Decreased slightly | 41.0 | 43.2 | 21.6 | 47.7 | 49.1 | 31.3 | 37.8 |
| Decreased substantially | 23.1 | 11.4 | 8.1 | 13.8 | 14.0 | 8.3 | 15.6 |
NOTE: 45 responses.
| Nov. '22 (percent) |
Feb. '23 (percent) |
Nov. '23 (percent) |
Nov. '24 (percent) |
Nov. '25 (percent) |
|
| Increase substantially | 0.0 | 4.4 | 0.0 | 2.1 | 2.3 |
| Increase slightly | 10.8 | 16.2 | 15.8 | 31.3 | 18.2 |
| Remain the same | 33.8 | 29.4 | 38.6 | 35.4 | 36.4 |
| Decrease slightly | 43.1 | 38.2 | 35.1 | 27.1 | 34.1 |
| Decrease substantially | 12.3 | 11.8 | 10.5 | 4.2 | 9.1 |
NOTE: 44 responses.
| Nov. '23 (percent) |
Feb. '24 (percent) |
Aug. '24 (percent) |
Nov. '24 (percent) |
Feb. '25 (percent) |
Aug. '25 (percent) |
Nov. '25 (percent) |
|
| Increase substantially | 3.5 | 1.8 | 2.1 | 6.1 | 2.4 | 4.8 | 2.3 |
| Increase slightly | 31.6 | 36.4 | 29.2 | 40.8 | 54.8 | 33.3 | 22.7 |
| Remain the same | 33.3 | 30.9 | 39.6 | 30.6 | 26.2 | 38.1 | 54.5 |
| Decrease slightly | 28.1 | 30.9 | 25.0 | 18.4 | 16.7 | 19.0 | 18.2 |
| Decrease substantially | 3.5 | 0.0 | 4.2 | 4.1 | 0.0 | 4.8 | 2.3 |
NOTE: 44 responses.
| Oct. '22 (percent) |
Jan. '23 (percent) |
Jun. '23 (percent) |
Dec. '23 (percent) |
Aug. '24 (percent) |
Dec. '24 (percent) |
Nov. '25 (percent) |
|
| We are understaffed and looking to hire for new positions | 31.8 | 24.3 | 26.7 | 20.0 | 6.3 | 19.1 | 4.5 |
| We are understaffed and looking to hire for replacement only | 19.7 | 24.3 | 18.3 | 20.0 | 18.8 | 12.8 | 15.9 |
| We are understaffed but opting not to hire at this time | 9.1 | 11.4 | 8.3 | 10.9 | 12.5 | 14.9 | 13.6 |
| We are at our ideal staffing level | 22.7 | 31.4 | 33.3 | 30.9 | 31.3 | 36.2 | 43.2 |
| We are overstaffed but opting not to lay off workers at this time | 7.6 | 8.6 | 13.3 | 12.7 | 18.8 | 12.8 | 13.6 |
| We are overstaffed and laying off workers | 3.0 | 0.0 | 0.0 | 1.8 | 8.3 | 0.0 | 2.3 |
| Other | 6.1 | 0.0 | 0.0 | 3.6 | 4.2 | 4.3 | 6.8 |
NOTE: 44 responses.
| Nov. '25 (percent) |
|
| Increased substantially | 0.0 |
| Increased slightly | 36.4 |
| Remained the same | 47.7 |
| Decreased slightly | 15.9 |
| Decreased substantially | 0.0 |
NOTES: 44 responses.
| Nov. '25 (percent) |
|
| Productivity is increasing faster than usual | 20.0 |
| Productivity is increasing at about the same pace as usual | 73.3 |
| Productivity is increasing slower than usual | 0.0 |
| Productivity had not been increasing but now is | 6.7 |
NOTES: 15 responses. This question was only posed to those noting increased productivity. These calculations exclude the 6.3 percent of respondents selecting “Don’t know.”
The following was posed to those indicating increased productivity in question 5.
- We are deploying technology tools to improve our worker productivity.
- Increase of service business has improved our productivity.
- Utilization of our new ERP [enterprise resource planning] system, ChatGPT and AI have enabled our teams to focus on more opportunities. We also improved organization, cleanliness and focus on safety.
- Fewer employees are working here. The remaining employees have to do more work in the same amount of time.
- More emphasis on training and AI tools.
- We have been installing new equipment to enhance worker productivity, and we have been reaping the benefit from that.
Survey respondents were given the opportunity to also provide comments, which can be found in the Comments tab above.
Questions regarding the Texas Business Outlook Surveys can be addressed to Emily Kerr at emily.kerr@dal.frb.org.
Sign up for our email alert to be automatically notified as soon as the latest surveys are released on the web.
Special Questions Comments
Survey participants are given the opportunity to submit comments. Some comments have been edited for grammar and clarity.