Special Questions

Special Questions
For this month’s survey, Texas business executives were asked supplemental questions on wages, prices, outlook concerns and artificial intelligence. Results below include responses from participants of all three surveys: Texas Manufacturing Outlook Survey, Texas Service Sector Outlook Survey and Texas Retail Outlook Survey.
Texas Business Outlook Surveys
Data were collected Dec. 15-23 and 300 Texas business executives responded to the surveys.
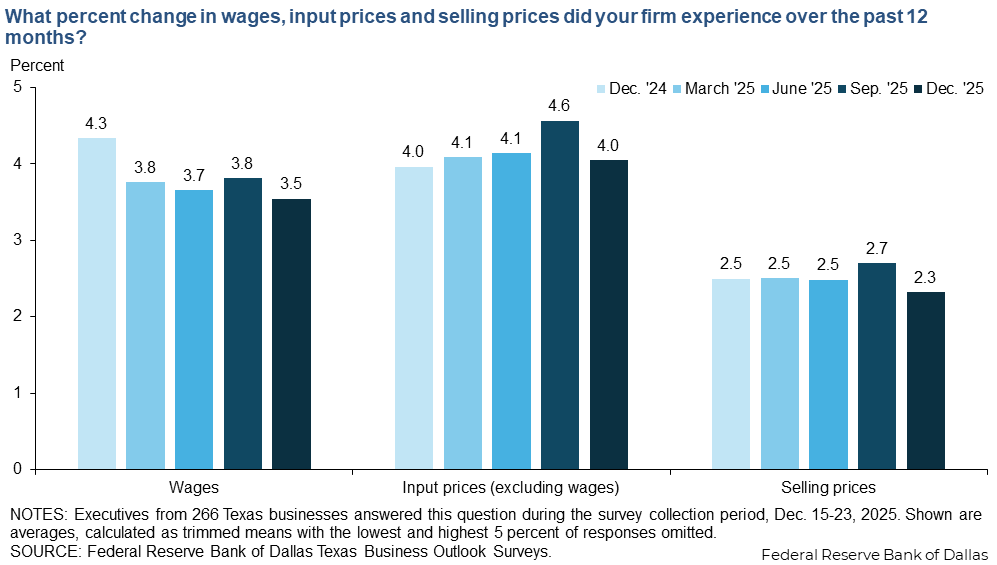
Wage and price growth has slowed after the acceleration seen in the September data. Texas firms surveyed report wage growth of 3.5 percent over the past 12 months, on average, 4.0 percent growth in input prices and 2.3 percent growth in selling prices. The deceleration was broad based across the manufacturing, services and retail sectors.

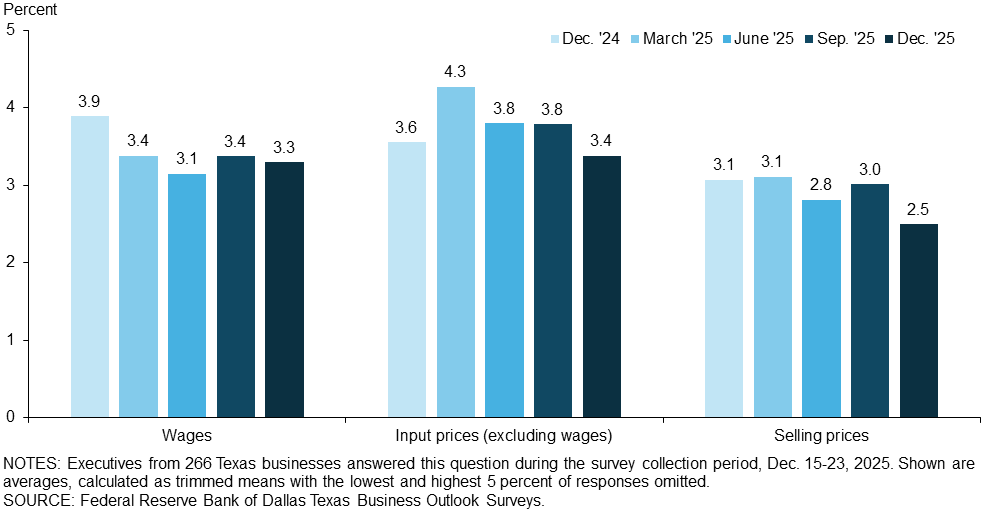
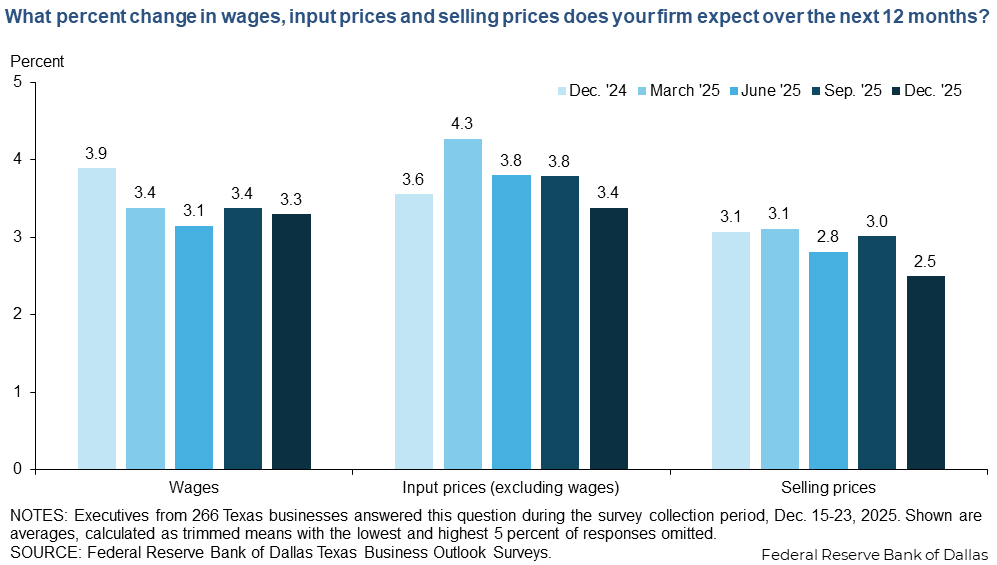
Wage and price growth expectations eased somewhat in December. Texas firms surveyed expect wages to increase 3.3 percent over the next 12 months, on average. They expect input prices to increase 3.4 percent and selling prices to increase 2.5 percent.
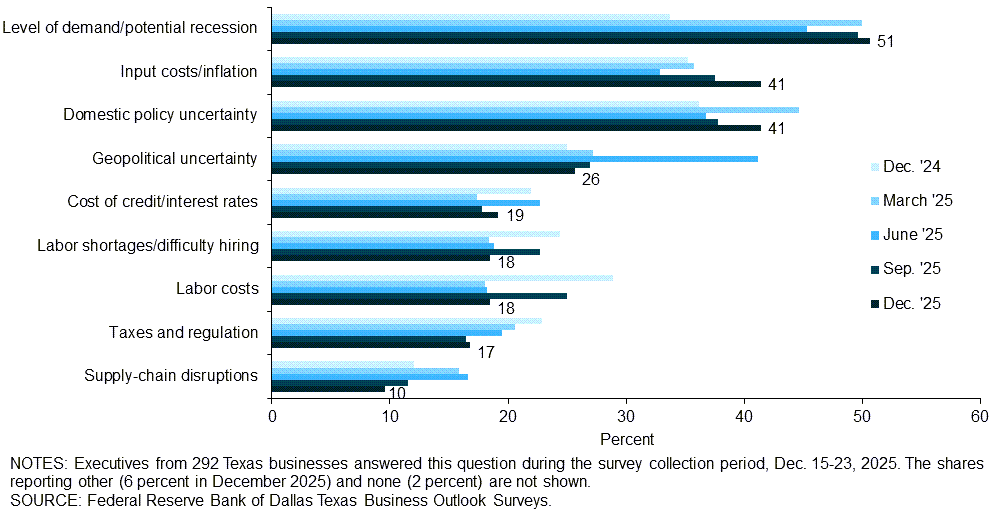
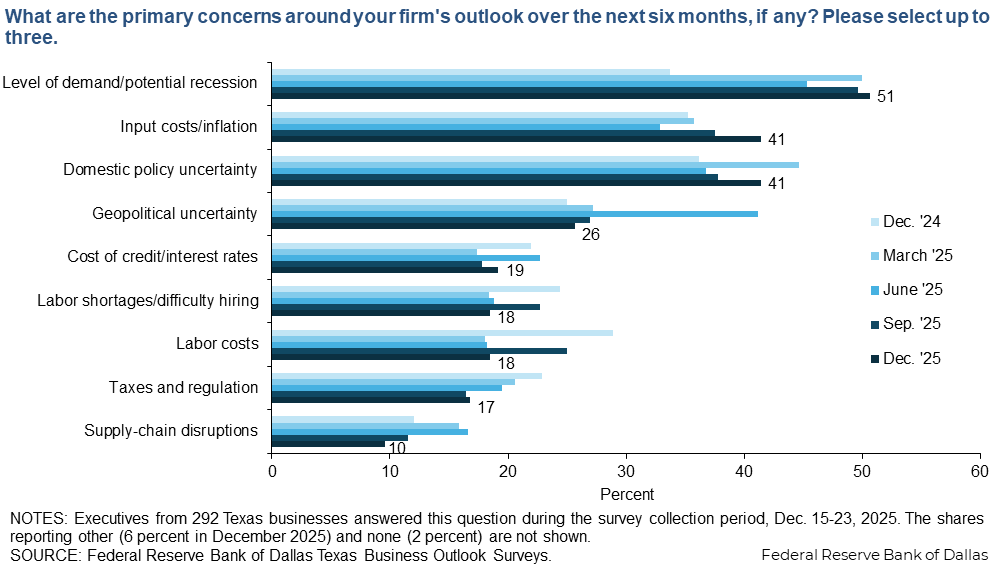
Demand remains the top outlook concern among Texas firms surveyed, followed by inflation and domestic policy uncertainty. The shares of firms citing labor shortages and labor costs fell notably in December.
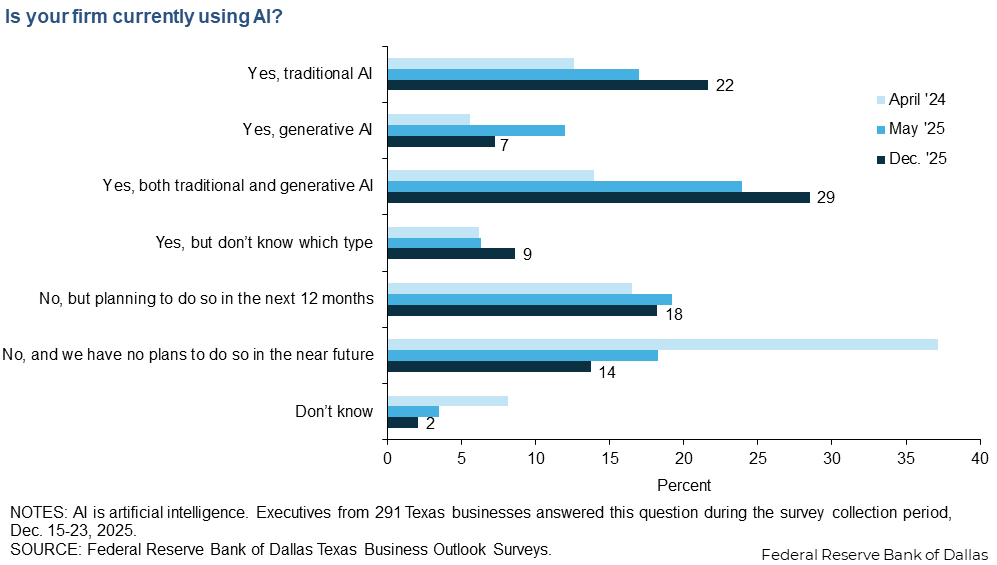
For the next question, respondents were provided the following definitions: Traditional AI relies on explicit programming to execute specific tasks. Examples include search algorithms and recommendations or predictions based on past trends. These AIs have been trained to follow given rules and perform tasks, but they don’t create anything new. Generative AI is distinct from traditional AI in that it autonomously generates new content. Examples include written content creation like ChatGPT, question answering like sales or customer service chatbots, and enhanced code and software development.
Two-thirds of responding firms report they are currently using AI, up from 59 percent in May and 38 percent in April 2024.

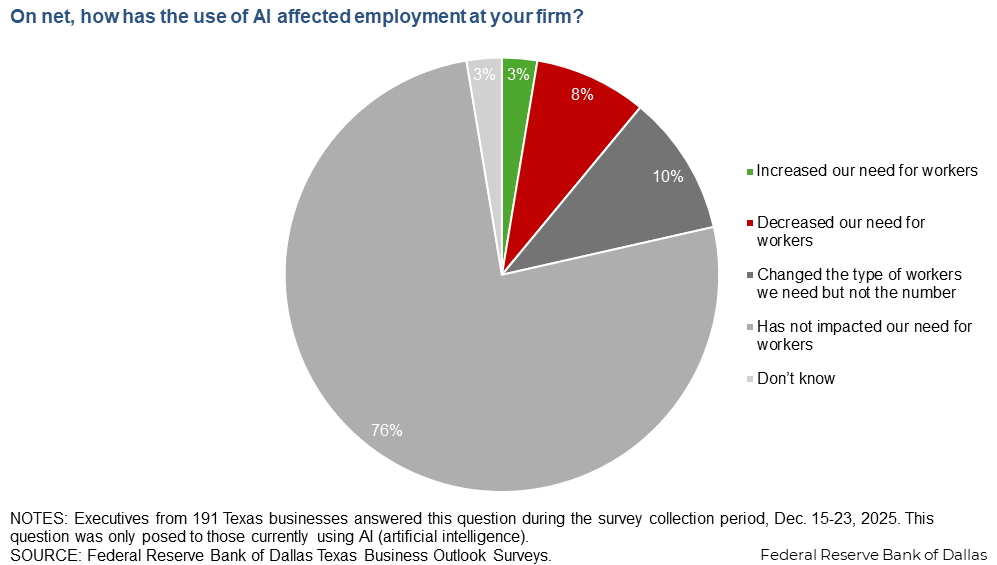
Among firms using AI, most report it has not impacted their need for workers. Three percent say it increased their need for workers and 8 percent say it decreased their need for workers.

Among firms noting an employment effect from the use of AI, the most widespread impact is to mid-skill workers. Still, there was not a consensus in the direction—a third noted a decrease, while about 20 percent noted an increase. Respondents were mixed on the impact to high-skill workers as well. For low-skill workers the direction of impact was clearer—nearly thirty percent of firms reported a decrease in employment in those positions, while very few reported an increase.
| Increased (percent) |
No change (percent) |
Decreased (percent) |
Don’t know (percent) |
|
| Low-skill positions (typically require high school diploma or less) | 2.6 | 60.5 | 28.9 | 7.9 |
| Mid-skill positions (typically require some college or technical training) | 20.5 | 38.5 | 33.3 | 7.7 |
| High-skill positions (typically require college degree or higher) | 26.3 | 55.3 | 15.8 | 2.6 |
NOTES: 39 responses. This question was only posed to those noting a change in employment due to the use of AI.
Among firms noting an employment effect from the use of AI, the most widespread impact is to employment among workers with little to no work experience, as nearly 30 percent of firms reported a decrease.
| Increased (percent) |
No change (percent) |
Decreased (percent) |
Don’t know (percent) |
|
| Little to no work experience | 7.3 | 46.3 | 29.3 | 17.1 |
| 5 to 10 years of work experience | 15.0 | 52.5 | 25.0 | 7.5 |
| More than 10 years of work experience | 15.0 | 65.0 | 12.5 | 7.5 |
NOTES: 41 responses. This question was only posed to those noting a change in employment due to the use of AI.
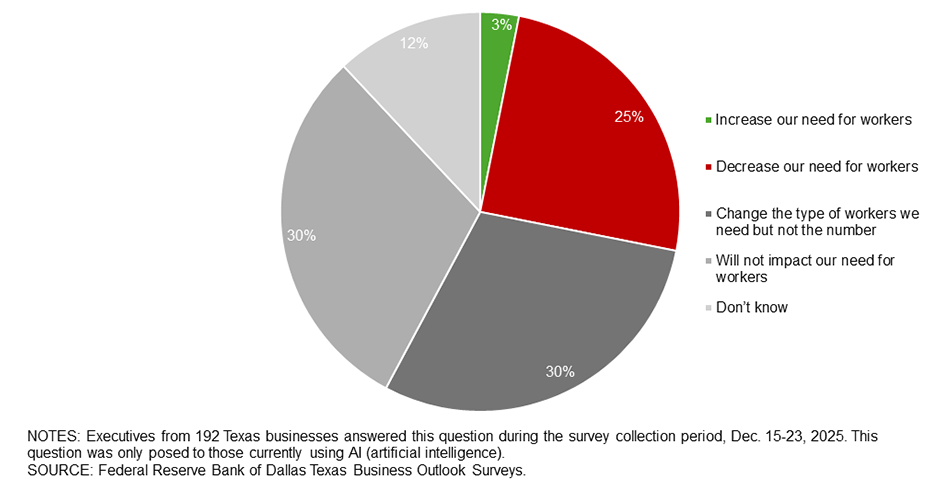
Among AI-using firms, a quarter expect AI to decrease their need for workers in the medium term. Thirty percent expect AI to change the type of workers they need but not the number. The employment impact is expected to be more widespread in the manufacturing sector than in services, where more firms are uncertain about the future employment effect.
Survey respondents were given the opportunity to also provide comments, which can be found in the Comments tab above.
Texas Manufacturing Outlook Survey
Data were collected Dec. 15-23 and 69 Texas business executives responded to the surveys.
| Mar. '25 (percent) |
Jun. '25 (percent) |
Sep. '25 (percent) |
Dec. '25 (percent) |
|||||
| Past 12 months | Next 12 months | Past 12 months | Next 12 months | Past 12 months | Next 12 months | Past 12 months | Next 12 months | |
| Wages | 3.6 | 3.2 | 3.3 | 3.1 | 3.8 | 3.2 | 3.4 | 3.3 |
| Input prices (excluding wages) | 4.5 | 4.9 | 5.5 | 4.5 | 5.8 | 4.2 | 5.5 | 4.1 |
| Selling prices | 2.0 | 3.8 | 3.0 | 3.7 | 3.8 | 3.8 | 2.7 | 2.7 |
NOTES: 66 responses. Shown are averages, calculated as trimmed means with the lowest and highest 5 percent of responses omitted.
| Sep. '24 (percent) |
Dec. '24 (percent) |
Mar. '25 (percent) |
Jun. '25 (percent) |
Sep. '25 (percent) |
Dec. '25 (percent) |
|
| Level of demand/potential recession | 63.2 | 37.5 | 50.0 | 47.9 | 50.0 | 53.6 |
| Input costs/inflation | 28.9 | 37.5 | 43.8 | 45.2 | 45.5 | 46.4 |
| Domestic policy uncertainty | 56.6 | 45.0 | 40.0 | 27.4 | 40.9 | 39.1 |
| Geopolitical uncertainty | 27.6 | 35.0 | 30.0 | 43.8 | 31.8 | 30.4 |
| Labor shortages/difficulty hiring | 14.5 | 22.5 | 18.8 | 17.8 | 22.7 | 18.8 |
| Supply-chain disruptions | 19.7 | 20.0 | 17.5 | 30.1 | 19.7 | 17.4 |
| Labor costs | 26.3 | 25.0 | 15.0 | 13.7 | 27.3 | 17.4 |
| Cost of credit/interest rates | 13.2 | 13.8 | 10.0 | 13.7 | 10.6 | 13.0 |
| Taxes and regulation | 31.6 | 16.3 | 23.8 | 23.3 | 12.1 | 11.6 |
| Other | 1.3 | 8.8 | 15.0 | 11.0 | 7.6 | 7.2 |
| None | 0.0 | 2.5 | 2.5 | 0.0 | 1.5 | 2.9 |
NOTES: 69 responses.
| Apr. '24 (percent) |
May '25 (percent) |
Dec. '25 (percent) |
|
| Yes, traditional AI | 8.2 | 20.8 | 18.8 |
| Yes, generative AI | 3.5 | 10.4 | 2.9 |
| Yes, both traditional and generative AI | 10.6 | 14.3 | 21.7 |
| Yes, but don’t know which type | 5.9 | 3.9 | 11.6 |
| No, but planning to do so in the next 12 months | 15.3 | 20.8 | 18.8 |
| No, and we have no plans to do so in the near future | 47.1 | 24.7 | 23.2 |
| Don’t know | 9.4 | 5.2 | 2.9 |
NOTES: 69 responses.
| Dec. '25 (percent) |
|
| Increased our need for workers | 2.6 |
| Decreased our need for workers | 7.9 |
| Changed the type of workers we need but not the number | 7.9 |
| Has not impacted our need for workers | 78.9 |
| Don’t know | 2.6 |
NOTES: 38 responses. This question was only posed to those currently using AI.
| Dec. '25 (percent) |
|
| Increase our need for workers | 5.3 |
| Decrease our need for workers | 31.6 |
| Change the type of workers we need but not the number | 34.2 |
| Will not impact our need for workers | 26.3 |
| Don’t know | 2.6 |
NOTES: 38 responses. This question was only posed to those currently using AI.
Survey respondents were given the opportunity to also provide comments, which can be found in the Comments tab above.
Texas Service Sector Outlook Survey
Data were collected Dec. 15-23 and 231 Texas business executives responded to the surveys.
| Mar. '25 (percent) |
Jun. '25 (percent) |
Sep. '25 (percent) |
Dec. '25 (percent) |
|||||
| Past 12 months | Next 12 months | Past 12 months | Next 12 months | Past 12 months | Next 12 months | Past 12 months | Next 12 months | |
| Wages | 3.8 | 3.5 | 3.8 | 3.2 | 3.8 | 3.4 | 3.6 | 3.3 |
| Input prices (excluding wages) | 4.0 | 4.1 | 3.8 | 3.6 | 4.2 | 3.7 | 3.7 | 3.1 |
| Selling prices | 2.7 | 2.9 | 2.3 | 2.5 | 2.4 | 2.8 | 2.2 | 2.4 |
NOTES: 200 responses. Shown are averages, calculated as trimmed means with the lowest and highest 5 percent of responses omitted.
| Sep. '24 (percent) |
Dec. '24 (percent) |
Mar. '25 (percent) |
Jun. '25 (percent) |
Sep. '25 (percent) |
Dec. '25 (percent) |
|
| Level of demand/potential recession | 42.6 | 32.5 | 50.0 | 44.6 | 49.6 | 49.8 |
| Domestic policy uncertainty | 46.8 | 33.3 | 46.2 | 39.6 | 37.0 | 42.2 |
| Input costs/inflation | 27.2 | 34.5 | 33.1 | 29.2 | 35.3 | 39.9 |
| Geopolitical uncertainty | 20.9 | 21.8 | 26.3 | 40.4 | 25.6 | 24.2 |
| Cost of credit/interest rates | 21.3 | 24.6 | 19.9 | 25.4 | 19.7 | 21.1 |
| Labor costs | 29.8 | 30.2 | 19.1 | 19.6 | 24.4 | 18.8 |
| Labor shortages/difficulty hiring | 23.4 | 25.0 | 18.2 | 19.2 | 22.7 | 18.4 |
| Taxes and regulation | 29.4 | 25.0 | 19.5 | 18.3 | 17.6 | 18.4 |
| Supply-chain disruptions | 7.2 | 9.5 | 15.3 | 12.5 | 9.2 | 7.2 |
| Other | 2.6 | 6.0 | 6.8 | 7.1 | 7.1 | 6.7 |
| None | 3.4 | 2.4 | 1.7 | 1.7 | 3.4 | 2.7 |
NOTES: 233 responses.
| Apr. '24 (percent) |
May '25 (percent) |
Dec. '25 (percent) |
|
| Yes, traditional AI | 13.9 | 15.8 | 22.5 |
| Yes, generative AI | 6.2 | 12.4 | 8.6 |
| Yes, both traditional and generative AI | 15.0 | 27.0 | 30.6 |
| Yes, but don’t know which type | 6.2 | 7.1 | 7.7 |
| No, but planning to do so in the next 12 months | 16.8 | 18.7 | 18.0 |
| No, and we have no plans to do so in the near future | 34.1 | 16.2 | 10.8 |
| Don’t know | 7.7 | 2.9 | 1.8 |
NOTES: 222 responses.
| Dec. '25 (percent) |
|
| Increased our need for workers | 2.6 |
| Decreased our need for workers | 8.5 |
| Changed the type of workers we need but not the number | 11.1 |
| Has not impacted our need for workers | 75.2 |
| Don’t know | 2.6 |
NOTES: 153 responses. This question was only posed to those currently using AI.
| Dec. '25 (percent) |
|
| Increase our need for workers | 2.6 |
| Decrease our need for workers | 23.4 |
| Change the type of workers we need but not the number | 28.6 |
| Will not impact our need for workers | 31.2 |
| Don’t know | 14.3 |
NOTES: 154 responses. This question was only posed to those currently using AI.
Survey respondents were given the opportunity to also provide comments, which can be found in the Comments tab above.
Texas Retail Outlook Survey
Data were collected Dec. 15-23 and 41 Texas business executives responded to the surveys.
| Mar. '25 (percent) |
Jun. '25 (percent) |
Sep. '25 (percent) |
Dec. '25 (percent) |
|||||
| Past 12 months | Next 12 months | Past 12 months | Next 12 months | Past 12 months | Next 12 months | Past 12 months | Next 12 months | |
| Wages | 3.7 | 3.4 | 3.3 | 2.7 | 4.2 | 3.2 | 3.1 | 2.3 |
| Input prices (excluding wages) | 4.1 | 4.7 | 4.6 | 4.8 | 4.4 | 4.6 | 3.8 | 3.5 |
| Selling prices | 3.1 | 3.9 | 2.9 | 3.7 | 3.3 | 3.7 | 2.9 | 3.1 |
NOTES: 35 responses. Shown are averages, calculated as trimmed means with the lowest and highest 5 percent of responses omitted.
| Sep. '24 (percent) |
Dec. '24 (percent) |
Mar. '25 (percent) |
Jun. '25 (percent) |
Sep. '25 (percent) |
Dec. '25 (percent) |
|
| Level of demand/potential recession | 48.1 | 42.6 | 43.6 | 42.1 | 47.7 | 53.8 |
| Input costs/inflation | 26.9 | 38.3 | 46.2 | 39.5 | 43.2 | 43.6 |
| Domestic policy uncertainty | 42.3 | 31.9 | 33.3 | 34.2 | 25.0 | 33.3 |
| Supply-chain disruptions | 13.5 | 17.0 | 25.6 | 28.9 | 20.5 | 23.1 |
| Geopolitical uncertainty | 19.2 | 25.5 | 23.1 | 55.3 | 34.1 | 20.5 |
| Taxes and regulation | 26.9 | 14.9 | 17.9 | 7.9 | 20.5 | 20.5 |
| Labor shortages/difficulty hiring | 25.0 | 27.7 | 23.1 | 15.8 | 25.0 | 17.9 |
| Labor costs | 23.1 | 21.3 | 15.4 | 21.1 | 31.8 | 15.4 |
| Cost of credit/interest rates | 26.9 | 25.5 | 17.9 | 21.1 | 13.6 | 12.8 |
| Other | 0.0 | 6.4 | 5.1 | 10.5 | 4.5 | 7.7 |
| None | 3.8 | 2.1 | 2.6 | 0.0 | 2.3 | 0.0 |
NOTES: 39 responses.
| Apr. '24 (percent) |
May '25 (percent) |
Dec. '25 (percent) |
|
| Yes, traditional AI | 13.7 | 13.6 | 13.2 |
| Yes, generative AI | 7.8 | 6.8 | 2.6 |
| Yes, both traditional and generative AI | 9.8 | 20.5 | 23.7 |
| Yes, but don’t know which type | 2.0 | 4.5 | 18.4 |
| No, but planning to do so in the next 12 months | 13.7 | 25.0 | 26.3 |
| No, and we have no plans to do so in the near future | 47.1 | 22.7 | 13.2 |
| Don’t know | 5.9 | 6.8 | 2.6 |
NOTES: 38 responses.
| Dec. '25 (percent) |
|
| Increased our need for workers | 4.5 |
| Decreased our need for workers | 4.5 |
| Changed the type of workers we need but not the number | 13.6 |
| Has not impacted our need for workers | 72.7 |
| Don’t know | 4.5 |
NOTES: 22 responses. This question was only posed to those currently using AI.
| Dec. '25 (percent) |
|
| Increase our need for workers | 4.5 |
| Decrease our need for workers | 9.1 |
| Change the type of workers we need but not the number | 31.8 |
| Will not impact our need for workers | 31.8 |
| Don’t know | 22.7 |
NOTES: 22 responses. This question was only posed to those currently using AI.
Survey respondents were given the opportunity to also provide comments, which can be found in the Comments tab above.
Questions regarding the Texas Business Outlook Surveys can be addressed to Isabel Brizuela..
Sign up for our email alert to be automatically notified as soon as the latest surveys are released on the web.
Special Questions Comments
Survey participants are given the opportunity to submit comments. Some comments have been edited for grammar and clarity.