Special Questions

Special Questions
For this month’s survey, Texas business executives were asked supplemental questions on demand, regulation and hiring. Results below include responses from participants from both the Texas Manufacturing Outlook Survey and Texas Service Sector Outlook Survey.
Texas Business Outlook Surveys
Data were collected February 10-18, and 315 Texas business executives responded to the surveys.
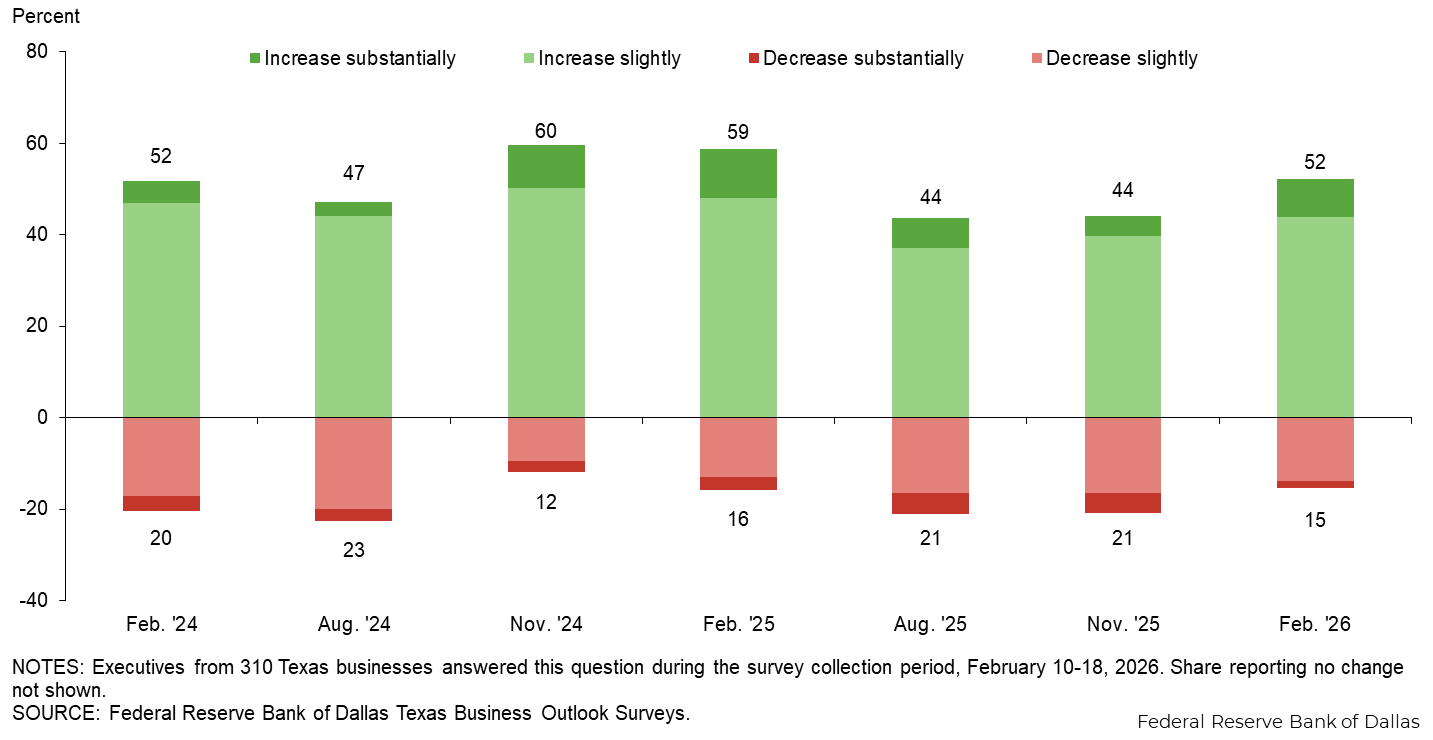
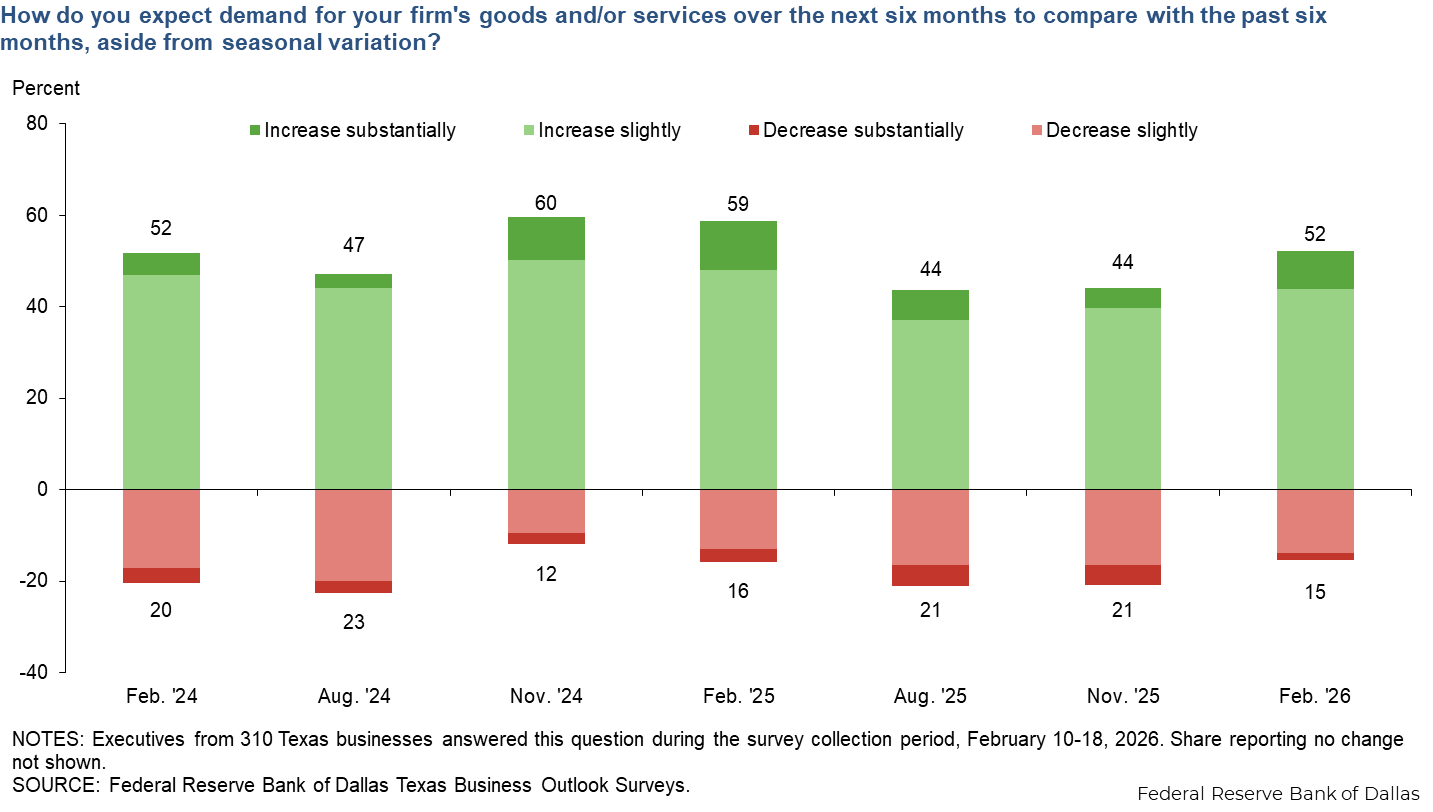
Demand expectations among Texas businesses are now slightly more bullish than what was reported last November. Of responding firms, 52 percent expect increases in demand over the next six months, exceeding the 15 percent share expecting decreases. Manufacturers in particular report optimism regarding future demand.
Most Texas businesses say they have not been impacted by recent regulatory changes. Thirteen percent say they’ve seen a positive impact, with the share higher among services firms (15 percent) and lower among manufacturers (6 percent). Nearly a quarter say they’ve been negatively impacted, though the adverse impact was largely from tariffs, according to respondent commentary.
| Feb. '26 (percent) |
|
| Yes, positively on net | 12.8 |
| Yes, negatively on net | 23.7 |
| No | 54.5 |
| Don’t know | 9.0 |
NOTES: 312 responses. While respondents were asked to exclude changes in tariff and tax policy, many who responded ‘Yes, negatively on net’ cited tariffs when explaining the changes affecting their firm.
Among firms positively affected by recent regulatory changes, the majority cite changes in financial regulations as a driver, followed by changes in regulatory compliance/reporting requirements and enforcement.
| Feb. '26 (percent) |
|
| Financial regulations | 64.1 |
| Regulatory compliance/reporting requirements and enforcement | 43.6 |
| Permitting and licensing process | 25.6 |
| Environmental and/or land use regulations | 25.6 |
| Mergers and acquisitions review process | 17.9 |
| Technology and data regulations | 17.9 |
| Labor regulations | 7.7 |
| Other | 12.8 |
NOTES: 39 responses. This question was only posed to those who responded ‘Yes, positively on net’ to question 2.
Among firms positively affected by recent regulatory changes, nearly a quarter say they are entering new markets/geographical regions or implementing efficiency improvements as a result. More than 40 percent of responding firms are not taking any action in response.
| Feb. '26 (percent) |
|
| Entering new markets or geographic regions | 23.1 |
| Implementing efficiency improvements | 23.1 |
| Increasing capital expenditures | 20.5 |
| Increasing innovation and/or research and development | 20.5 |
| Pursuing mergers or acquisitions | 15.4 |
| Launching new products or services | 12.8 |
| Other | 5.1 |
| None | 43.6 |
NOTES: 39 responses. This question was only posed to those who responded ‘Yes, positively on net’ to question 2.
A smaller share of Texas firms relied on hiring workers from other states or countries than what was seen a year ago.
| Workers from a different U.S. state | Workers from a different country | |||||
| Feb. '24 | Feb. '25 | Feb. '26 | Feb. '24 | Feb. '25 | Feb. '26 | |
| Significant reliance | 5.1 | 4.6 | 3.3 | 2.4 | 6.6 | 4.0 |
| Some reliance | 24.7 | 27.8 | 21.3 | 12.9 | 17.7 | 16.4 |
| No reliance | 59.9 | 54.3 | 58.5 | 64.7 | 56.3 | 58.2 |
| Not applicable; did not hire | 10.2 | 13.2 | 16.9 | 19.9 | 19.4 | 21.5 |
NOTE: 301 responses.
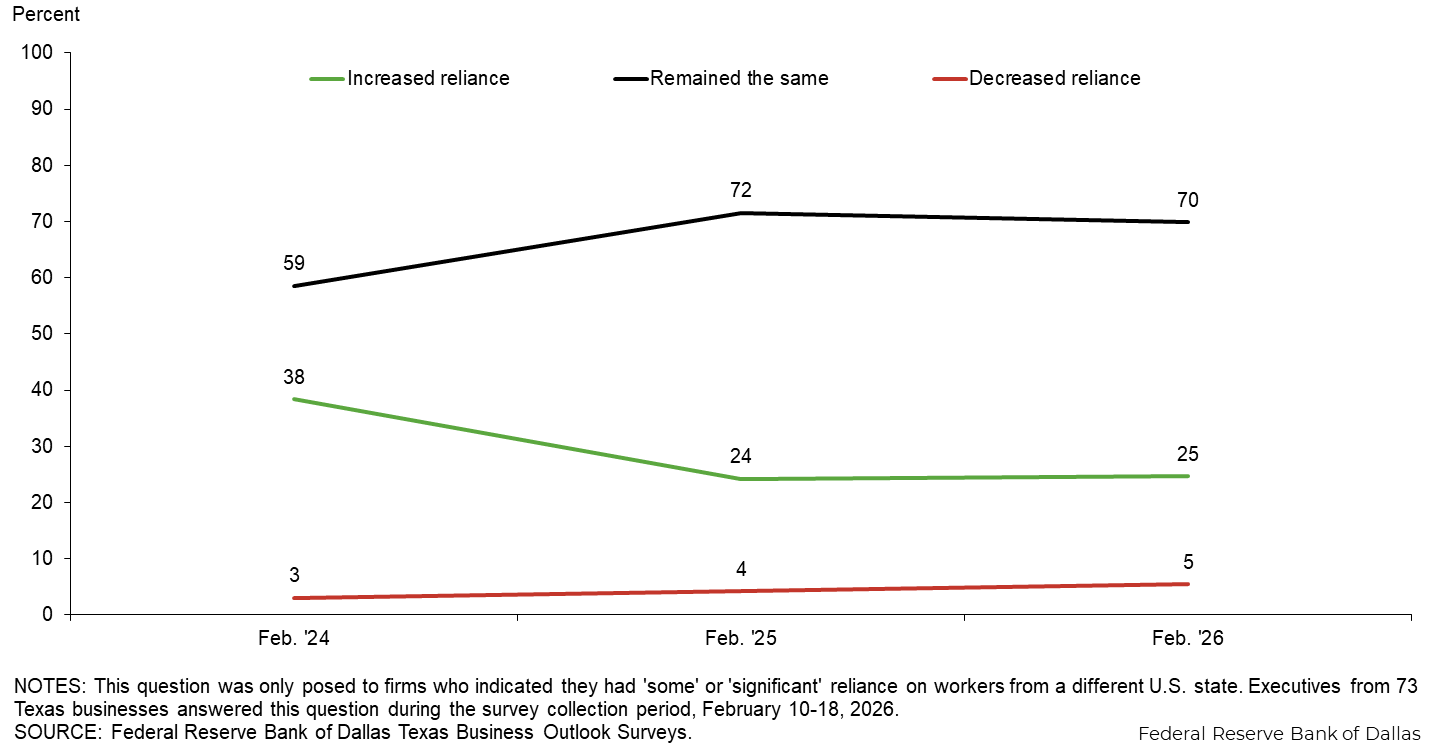
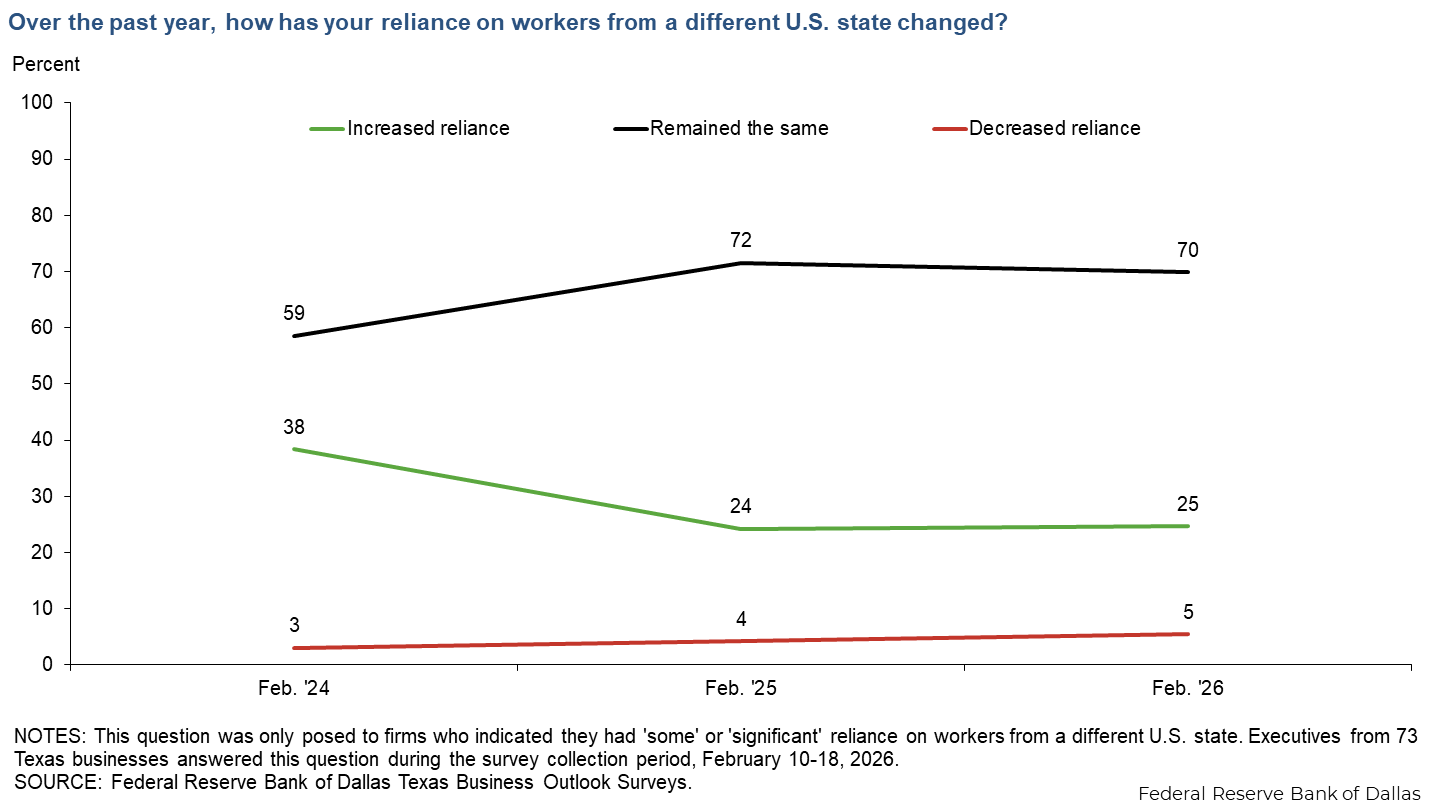
Among firms hiring workers from different states, reliance on these domestic migrants continues to increase on net.
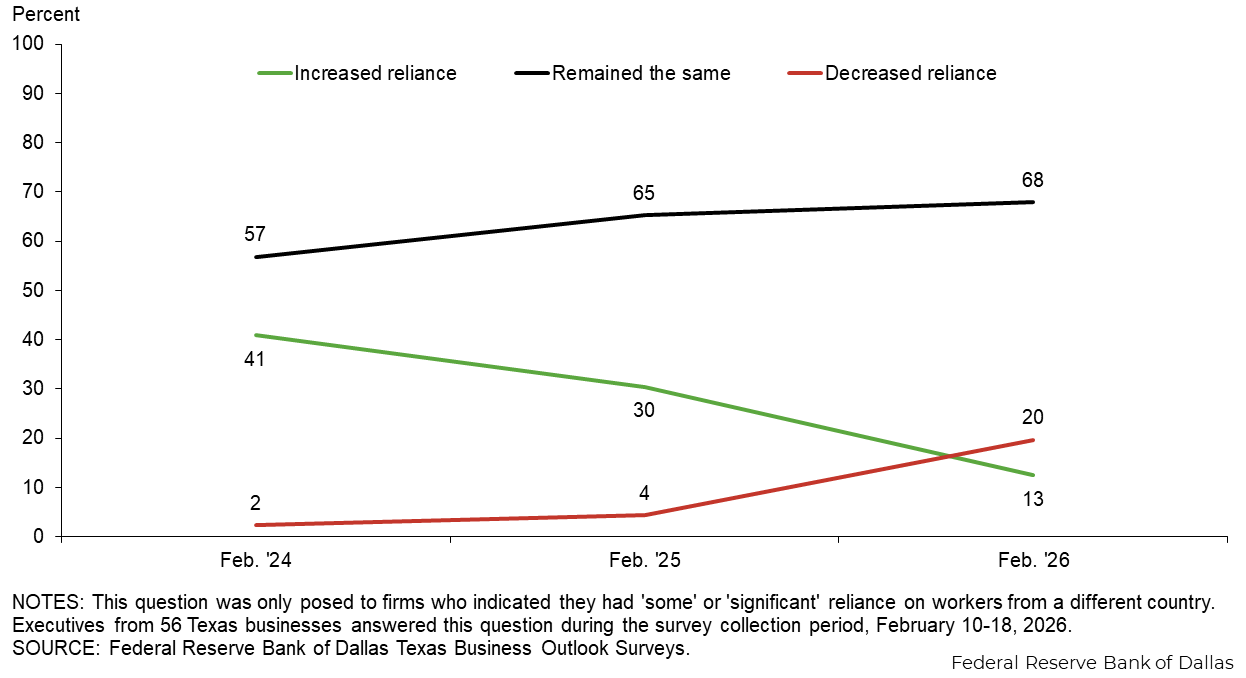
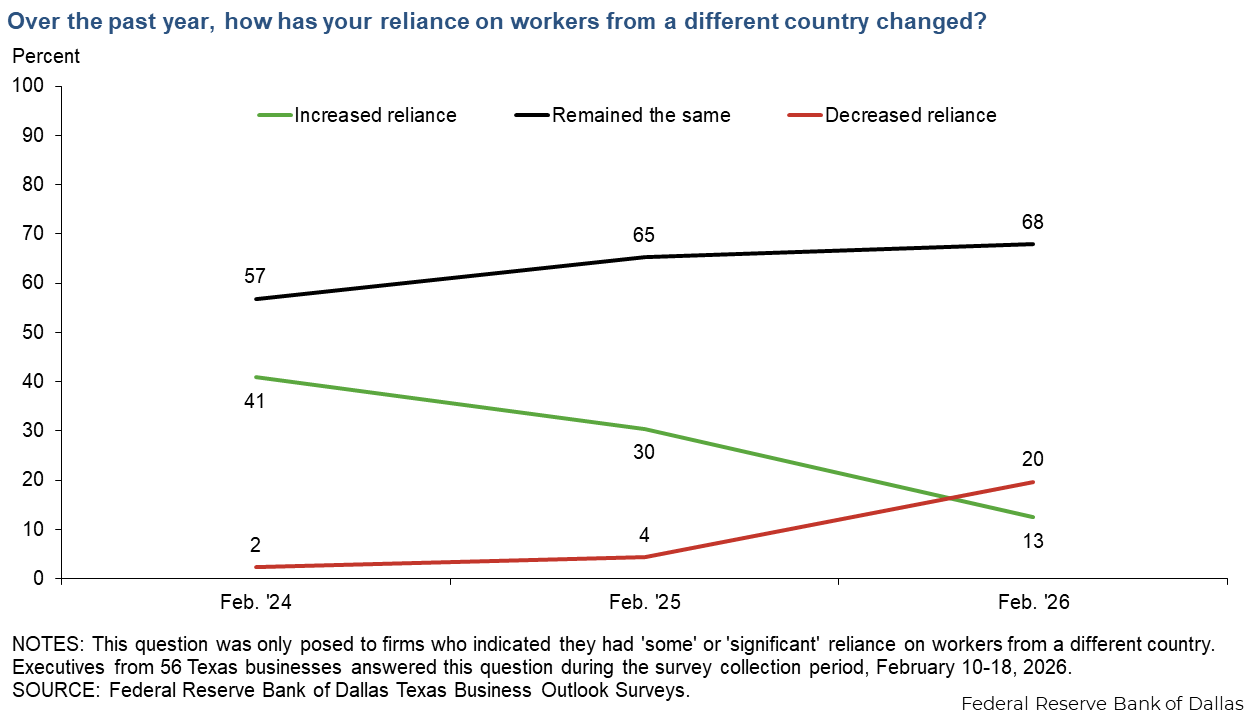
Among firms hiring workers from different countries, reliance on these immigrants declined on net over the past year, which is a reversal from what was reported the prior two years.
Survey respondents were given the opportunity to also provide comments, which can be found in the Comments tab above.
Texas Manufacturing Outlook Survey
Data were collected February 10-18, and 78 Texas manufacturers responded to the survey.
| Feb. '24 (percent) |
Aug. '24 (percent) |
Nov. '24 (percent) |
Feb. '25 (percent) |
Aug. '25 (percent) |
Nov. '25 (percent) |
Feb. '26 (percent) |
|
| Increase substantially | 5.5 | 1.3 | 14.3 | 19.8 | 12.3 | 7.5 | 14.3 |
| Increase slightly | 46.2 | 53.8 | 58.3 | 43.0 | 37.0 | 41.8 | 42.9 |
| Remain the same | 23.1 | 20.0 | 17.9 | 15.1 | 29.6 | 32.8 | 26.0 |
| Decrease slightly | 17.6 | 22.5 | 8.3 | 18.6 | 16.0 | 13.4 | 14.3 |
| Decrease substantially | 7.7 | 2.5 | 1.2 | 3.5 | 4.9 | 4.5 | 2.6 |
NOTE: 77 responses.
| Feb. '26 (percent) |
|
| Yes, positively on net | 6.4 |
| Yes, negatively on net | 30.8 |
| No | 57.7 |
| Don’t know | 5.1 |
NOTES: 78 responses. While respondents were asked to exclude changes in tariff and tax policy, many who responded ‘Yes, negatively on net’ cited tariffs when explaining the changes affecting their firm.
| Workers from a different U.S. state | Workers from a different country | |||||
| Feb. '24 | Feb. '25 | Feb. '26 | Feb. '24 | Feb. '25 | Feb. '26 | |
| Significant reliance | 6.0 | 0.0 | 0.0 | 3.9 | 8.2 | 4.2 |
| Some reliance | 20.2 | 33.3 | 13.3 | 19.5 | 24.7 | 16.7 |
| No reliance | 65.5 | 55.1 | 66.7 | 62.3 | 50.7 | 51.4 |
| Not applicable; did not hire | 8.3 | 11.5 | 20.0 | 14.3 | 16.4 | 27.8 |
NOTE: 75 responses.
| Workers from a different U.S. state | Workers from a different country | |||||
| Feb. '24 | Feb. '25 | Feb. '26 | Feb. '24 | Feb. '25 | Feb. '26 | |
| Increased reliance | 59.1 | 30.4 | 10.0 | 61.1 | 43.5 | 6.7 |
| Remained the same | 36.4 | 69.6 | 70.0 | 33.3 | 52.2 | 73.3 |
| Decreased reliance | 4.5 | 0.0 | 20.0 | 5.6 | 4.3 | 20.0 |
NOTES: 15 responses. This question was only posed to those answering ‘Significant reliance’ or ‘Some reliance’ to question 3.
Survey respondents were given the opportunity to also provide comments, which can be found in the Comments tab above.
Texas Service Sector Outlook Survey
Data were collected February 10-18, and 237 Texas business executives responded to the survey.
| Feb. '24 (percent) |
Aug. '24 (percent) |
Nov. '24 (percent) |
Feb. '25 (percent) |
Aug. '25 (percent) |
Nov. '25 (percent) |
Feb. '26 (percent) |
|
| Increase substantially | 4.5 | 3.5 | 7.9 | 7.2 | 4.5 | 3.4 | 6.4 |
| Increase slightly | 47.4 | 41.2 | 47.4 | 50.0 | 37.2 | 39.1 | 44.2 |
| Remain the same | 29.3 | 33.3 | 32.0 | 29.2 | 37.2 | 35.7 | 34.3 |
| Decrease slightly | 16.9 | 19.2 | 9.9 | 11.0 | 16.6 | 17.4 | 13.7 |
| Decrease substantially | 1.9 | 2.7 | 2.8 | 2.5 | 4.5 | 4.3 | 1.3 |
NOTE: 233 responses.
| Feb. '26 (percent) |
|
| Yes, positively on net | 15.0 |
| Yes, negatively on net | 21.4 |
| No | 53.4 |
| Don’t know | 10.3 |
NOTES: 234 responses. While respondents were asked to exclude changes in tariff and tax policy, many who responded ‘Yes, negatively on net’ cited tariffs when explaining the changes affecting their firm.
| Workers from a different U.S. state | Workers from a different country | |||||
| Feb. '24 | Feb. '25 | Feb. '26 | Feb. '24 | Feb. '25 | Feb. '26 | |
| Significant reliance | 4.8 | 6.3 | 4.4 | 1.9 | 6.0 | 3.9 |
| Some reliance | 26.2 | 25.9 | 23.9 | 10.5 | 15.3 | 16.3 |
| No reliance | 58.1 | 54.0 | 55.8 | 65.6 | 58.1 | 60.6 |
| Not applicable; did not hire | 10.9 | 13.8 | 15.9 | 22.0 | 20.5 | 19.2 |
NOTE: 226 responses.
| Workers from a different U.S. state | Workers from a different country | |||||
| Feb. '24 | Feb. '25 | Feb. '26 | Feb. '24 | Feb. '25 | Feb. '26 | |
| Increased reliance | 32.5 | 22.2 | 27.0 | 26.9 | 23.9 | 14.6 |
| Remained the same | 64.9 | 72.2 | 69.8 | 73.1 | 71.7 | 65.9 |
| Decreased reliance | 2.6 | 5.6 | 3.2 | 0.0 | 4.3 | 19.5 |
NOTES: 63 responses. This question was only posed to those answering ‘Significant reliance’ or ‘Some reliance’ to question 3.
Survey respondents were given the opportunity to also provide comments, which can be found in the Comments tab above.
Questions regarding the Texas Business Outlook Surveys can be addressed to Emily Kerr at emily.kerr@dal.frb.org.
Sign up for our email alert to be automatically notified as soon as the latest surveys are released on the web.
Special Questions Comments
Survey participants are given the opportunity to submit comments. Some comments have been edited for grammar and clarity.