Texas Manufacturing Outlook Survey

Texas manufacturing sector continues to face declining orders
For this month’s survey, Texas business executives were asked supplemental questions on wages, prices and costs. Results for these questions from the Texas Manufacturing Outlook Survey, Texas Service Sector Outlook Survey and Texas Retail Outlook Survey have been released together. Read the special questions results.
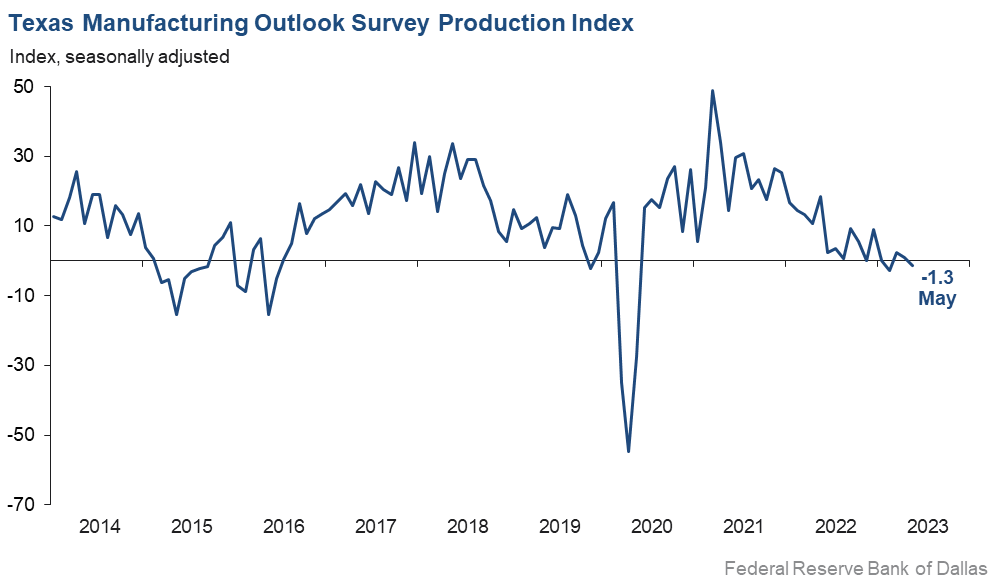
Texas factory activity remained relatively flat in May, according to business executives responding to the Texas Manufacturing Outlook Survey. The production index, a key measure of state manufacturing conditions, inched down from 0.9 to -1.3, with the near-zero reading suggestive of little change in output from last month.
Other measures of manufacturing activity showed declines in May. The new orders index has now been in negative territory for a year and pushed down further from -9.6 to -16.1. The growth rate of orders index also fell, declining 10 points to -20.7, its lowest value since mid-2020. The capacity utilization index moved down from 3.9 to -4.9, while the shipments index was unchanged at -3.0.
Perceptions of broader business conditions continued to worsen in May. The general business activity index dropped six points to -29.1, its lowest reading in three years. The company outlook index pushed down seven points to -22.3, also a three-year low. The outlook uncertainty index retreated to 13.4, a reading below average.
Labor market measures suggest continued employment growth but flat work hours. The employment index ticked up two points to 9.6, slightly above its average reading. Twenty-three percent of firms noted net hiring, while 13 percent noted net layoffs. The hours worked index inched up to -0.9.
Price pressures dropped further below normal levels, and wage pressures also eased but remained elevated. The raw materials prices index fell six points to 13.8, further below its average reading of 27.8. The finished goods prices index fell eight points to 0.4, with the near-zero reading suggestive of flat selling prices. The wages and benefits index declined 13 points to 25.0, a reading now only slightly above its average of 21.0.
Expectations regarding future manufacturing activity were mixed in May. The future production index rebounded from 3.0 to 12.0, while the future general business activity index remained negative, edging up to -12.7. Most other measures of future manufacturing activity remained positive but showed mixed movements this month.Next release: Monday, June 26
Data were collected May 16–24, and 91 Texas manufacturers responded to the survey. The Dallas Fed conducts the Texas Manufacturing Outlook Survey monthly to obtain a timely assessment of the state’s factory activity. Firms are asked whether output, employment, orders, prices and other indicators increased, decreased or remained unchanged over the previous month.
Survey responses are used to calculate an index for each indicator. Each index is calculated by subtracting the percentage of respondents reporting a decrease from the percentage reporting an increase. When the share of firms reporting an increase exceeds the share reporting a decrease, the index will be greater than zero, suggesting the indicator has increased over the prior month. If the share of firms reporting a decrease exceeds the share reporting an increase, the index will be below zero, suggesting the indicator has decreased over the prior month. An index will be zero when the number of firms reporting an increase is equal to the number of firms reporting a decrease. Data have been seasonally adjusted as necessary.
Results summary
Historical data are available from June 2004 to the most current release month.
| Business Indicators Relating to Facilities and Products in Texas Current (versus previous month) | ||||||||
| Indicator | May Index | Apr Index | Change | Series Average | Trend* | % Reporting Increase | % Reporting No Change | % Reporting Decrease |
Production | –1.3 | 0.9 | –2.2 | 10.5 | 1(–) | 24.6 | 49.4 | 25.9 |
Capacity Utilization | –4.9 | 3.9 | –8.8 | 8.5 | 1(–) | 21.7 | 51.7 | 26.6 |
New Orders | –16.1 | –9.6 | –6.5 | 6.0 | 12(–) | 22.9 | 38.2 | 39.0 |
Growth Rate of Orders | –20.7 | –11.1 | –9.6 | 0.1 | 13(–) | 16.7 | 45.8 | 37.4 |
Unfilled Orders | –15.5 | –11.3 | –4.2 | –1.6 | 10(–) | 8.0 | 68.5 | 23.5 |
Shipments | –3.0 | –2.8 | –0.2 | 9.1 | 5(–) | 24.5 | 48.0 | 27.5 |
Delivery Time | –7.3 | –0.1 | –7.2 | 1.3 | 2(–) | 8.9 | 74.9 | 16.2 |
Finished Goods Inventories | 1.1 | –3.7 | +4.8 | –3.2 | 1(+) | 17.6 | 65.9 | 16.5 |
Prices Paid for Raw Materials | 13.8 | 19.5 | –5.7 | 27.8 | 37(+) | 24.4 | 65.0 | 10.6 |
Prices Received for Finished Goods | 0.4 | 8.4 | –8.0 | 9.0 | 34(+) | 13.5 | 73.4 | 13.1 |
Wages and Benefits | 25.0 | 37.6 | –12.6 | 21.0 | 37(+) | 25.0 | 75.0 | 0.0 |
Employment | 9.6 | 8.0 | +1.6 | 7.9 | 3(+) | 22.9 | 63.8 | 13.3 |
Hours Worked | –0.9 | –2.7 | +1.8 | 3.7 | 2(–) | 10.6 | 77.9 | 11.5 |
Capital Expenditures | –3.7 | 2.8 | –6.5 | 6.8 | 1(–) | 13.0 | 70.3 | 16.7 |
| General Business Conditions Current (versus previous month) | ||||||||
| Indicator | May Index | Apr Index | Change | Series Average | Trend** | % Reporting Improved | % Reporting No Change | % Reporting Worsened |
Company Outlook | –22.3 | –15.6 | –6.7 | 5.6 | 15(–) | 9.1 | 59.5 | 31.4 |
General Business Activity | –29.1 | –23.4 | –5.7 | 1.9 | 13(–) | 6.5 | 57.9 | 35.6 |
| Indicator | May Index | Apr Index | Change | Series Average | Trend* | % Reporting Increase | % Reporting No Change | % Reporting Decrease |
Outlook Uncertainty | 13.4 | 24.7 | –11.3 | 16.9 | null | 26.7 | 60.0 | 13.3 |
| Business Indicators Relating to Facilities and Products in Texas Future (six months ahead) | ||||||||
| Indicator | May Index | Apr Index | Change | Series Average | Trend* | % Reporting Increase | % Reporting No Change | % Reporting Decrease |
Production | 12.0 | 3.0 | +9.0 | 37.2 | 37(+) | 33.5 | 45.1 | 21.5 |
Capacity Utilization | 10.9 | 3.7 | +7.2 | 34.2 | 37(+) | 31.5 | 47.9 | 20.6 |
New Orders | 3.7 | 7.7 | –4.0 | 34.6 | 7(+) | 28.8 | 46.1 | 25.1 |
Growth Rate of Orders | –2.0 | 3.9 | –5.9 | 25.6 | 1(–) | 23.6 | 50.8 | 25.6 |
Unfilled Orders | –7.6 | –5.3 | –2.3 | 3.2 | 12(–) | 8.5 | 75.4 | 16.1 |
Shipments | 10.2 | 6.7 | +3.5 | 35.6 | 37(+) | 34.3 | 41.6 | 24.1 |
Delivery Time | –8.5 | –1.2 | –7.3 | –1.4 | 2(–) | 9.4 | 72.7 | 17.9 |
Finished Goods Inventories | –11.6 | 1.3 | –12.9 | 0.3 | 1(–) | 10.5 | 67.4 | 22.1 |
Prices Paid for Raw Materials | 4.3 | 7.6 | –3.3 | 34.0 | 38(+) | 20.1 | 64.1 | 15.8 |
Prices Received for Finished Goods | 4.7 | 1.3 | +3.4 | 21.0 | 37(+) | 18.8 | 67.1 | 14.1 |
Wages and Benefits | 36.1 | 30.4 | +5.7 | 39.4 | 37(+) | 37.8 | 60.5 | 1.7 |
Employment | 24.8 | 23.2 | +1.6 | 23.3 | 36(+) | 31.3 | 62.2 | 6.5 |
Hours Worked | –2.6 | 5.3 | –7.9 | 9.2 | 1(–) | 9.3 | 78.8 | 11.9 |
Capital Expenditures | 4.5 | 14.6 | –10.1 | 19.7 | 36(+) | 18.1 | 68.3 | 13.6 |
| General Business Conditions Future (six months ahead) | ||||||||
| Indicator | May Index | Apr Index | Change | Series Average | Trend** | % Reporting Increase | % Reporting No Change | % Reporting Worsened |
Company Outlook | –3.9 | –3.8 | –0.1 | 19.0 | 4(–) | 17.5 | 61.1 | 21.4 |
General Business Activity | –12.7 | –16.6 | +3.9 | 13.1 | 13(–) | 16.5 | 54.3 | 29.2 |
*Shown is the number of consecutive months of expansion or contraction in the underlying indicator. Expansion is indicated by a positive index reading and denoted by a (+) in the table. Contraction is indicated by a negative index reading and denoted by a (–) in the table.
**Shown is the number of consecutive months of improvement or worsening in the underlying indicator. Improvement is indicated by a positive index reading and denoted by a (+) in the table. Worsening is indicated by a negative index reading and denoted by a (–) in the table.
Data have been seasonally adjusted as necessary.
Production index
Comments from survey respondents
These comments are from respondents’ completed surveys and have been edited for publication.
- Volumes have not rebounded at a level we would expect this time of year. Orders seem to be more erratic, which is in line with automotive and building construction markets trending downward as interest rates have deeply impacted both of these key, basic-materials consumer sectors.
- It is easier to find qualified employees over the last few weeks.
- Our only problem is our inability to hire enough hourly employees at the plant.
- We have had orders canceled when owners have decided not to proceed with projects.
- We have a continued focus on clearing the backlog of orders as supply constraints clear.
- Order volume has stalled recently.
- We have different dynamics and drivers in our business. We clearly are moving into a period of stagflation.
- We are seeing a massive slowdown in business activity.
- We are seeing all indications of a continued slide in demand (three quarters now). Prices are coming down some, but labor costs are still going up. This offsets any reduction in material costs, so margins are down as a result.
- Business is slowing down. That is certain.
- The building and construction industry remains significantly off, primarily residential. Another very negative factor is the influx of foreign material used in our industry.
- We are fortunate to have been busy with seasonal work the last few months; otherwise, we would have been hurting just living off commercial finishing work. We have a large seasonal job starting in two weeks that will keep a lot of people busy through Labor Day. General activity is definitely slower than it has been.
- We feel better now than we did a month ago about sales and the general environment. We have seen an increase in sales, particularly in our direct-to-consumer segment, although retail stores are down (retail stores are not a key strategic growth area for us; we’ve seen the writing on the wall for a while with this group). I also think uncertainty has reduced. I feel that we have a better grasp on the “new normal” cost structure and don’t anticipate any new major shocks to the system.
- There is nothing encouraging on the horizon. The war on fossil fuels and higher interest rates continue to make things worse. Doesn’t the Federal Reserve understand a higher interest rate is crushing banks?
Historical Data
Historical data can be downloaded dating back to June 2004.
Indexes
Download indexes for all indicators. For the definitions of all variables, see Data Definitions.
| Unadjusted |
| Seasonally adjusted |
All Data
Download indexes and components of the indexes (percentage of respondents reporting increase, decrease, or no change). For the definitions of all variables, see Data Definitions.
| Unadjusted |
| Seasonally adjusted |
Questions regarding the Texas Manufacturing Outlook Survey can be addressed to Emily Kerr at emily.kerr@dal.frb.org.
Sign up for our email alert to be automatically notified as soon as the latest Texas Manufacturing Outlook Survey is released on the web.