Texas Service Sector Activity Grows Modestly as Year Ends

Texas Service Sector Outlook Survey
December 29, 2020
Texas Service Sector Activity Grows Modestly as Year Ends
What’s New This Month
For this month’s survey, Texas business executives were asked supplemental questions on the impact of COVID-19. Results for these questions from the Texas Manufacturing Outlook Survey, Texas Service Sector Outlook Survey and Texas Retail Outlook Survey have been released together. Read the special questions results.
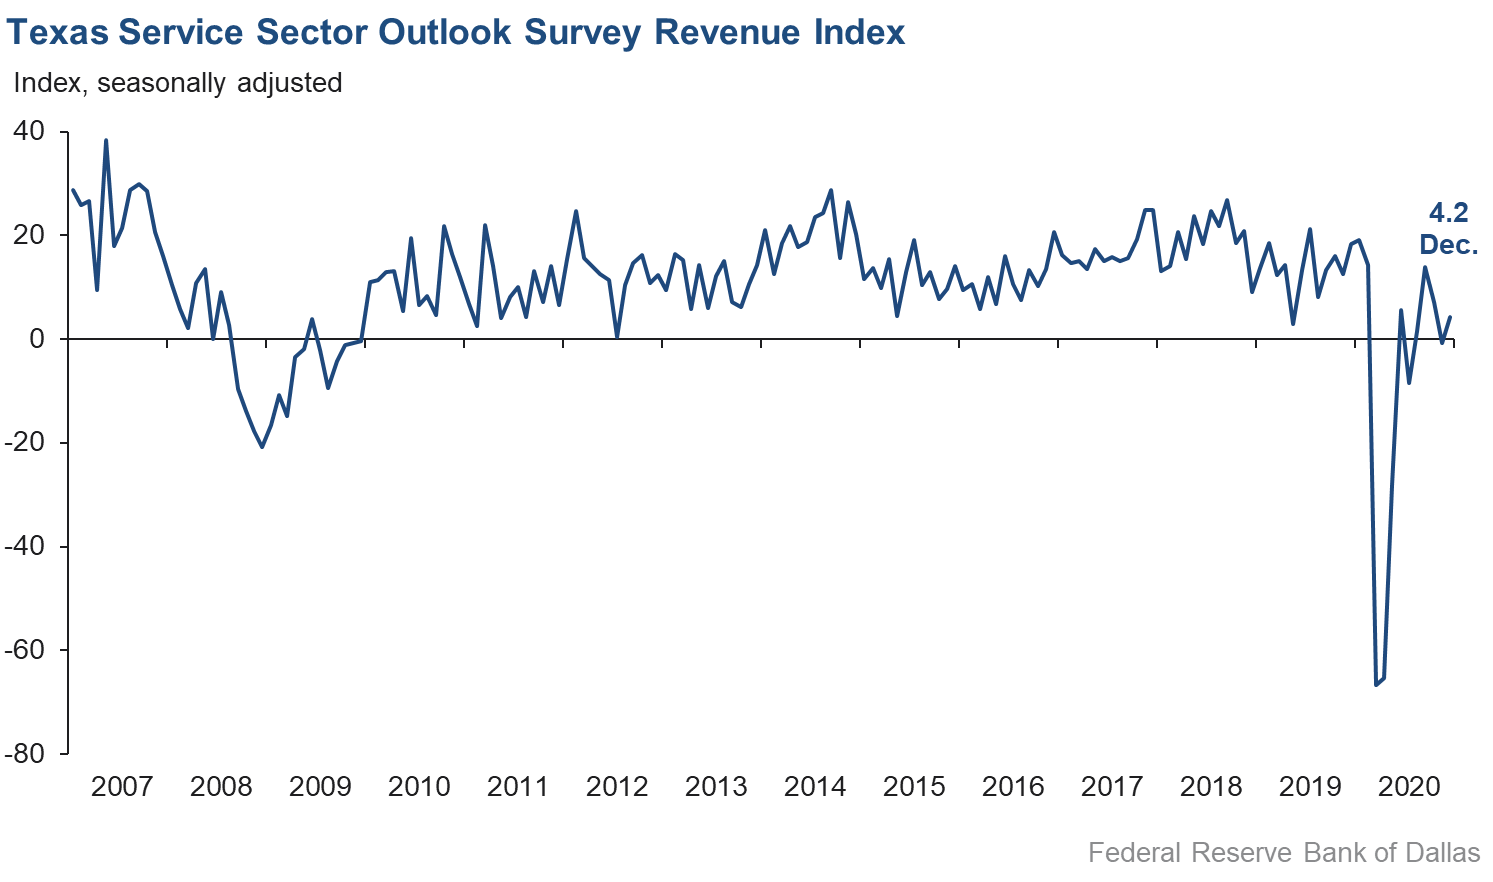
Activity in the Texas service sector returned to positive territory in December, according to business executives responding to the Texas Service Sector Outlook Survey. The revenue index, a key measure of state service sector conditions, rose from -0.7 in November to 4.2 in December, indicating a modest increase in activity.
Labor market indicators point to an increase in employment and hours worked. The employment index rose over four points to 5.1, while the part-time employment index advanced from -0.4 to 1.7. The hours worked index was mostly unchanged at 2.1.
Perceptions of broader business conditions remained subdued in December. The general business activity index continued to weaken, declining from -2.6 to -4.3. However, the company outlook index ticked up to positive territory, increasing from -0.8 to 0.7. The outlook uncertainty index remained positive but fell over 12 points to 5.2.
Price pressures increased slightly in December, while wage pressures eased. The selling prices index added two points to rise to 5.3—its highest reading since February—while the input prices index rose from 20.7 to 21.8. The wages and benefits index remained positive but fell from 11.2 to 8.6.
Respondents’ expectations regarding future business activity reflected increased optimism compared with November. The future general business activity index advanced nearly eight points to 23.8, while the future revenue index similarly added eight points to rise to 42.3, its highest reading since the beginning of the COVID-19 pandemic. Other indexes of future service sector activity such as employment rose notably, suggesting expectations of improved activity going into 2021.

Texas Retail Outlook Survey
December 29, 2020
Texas Retail Sales Hold Steady
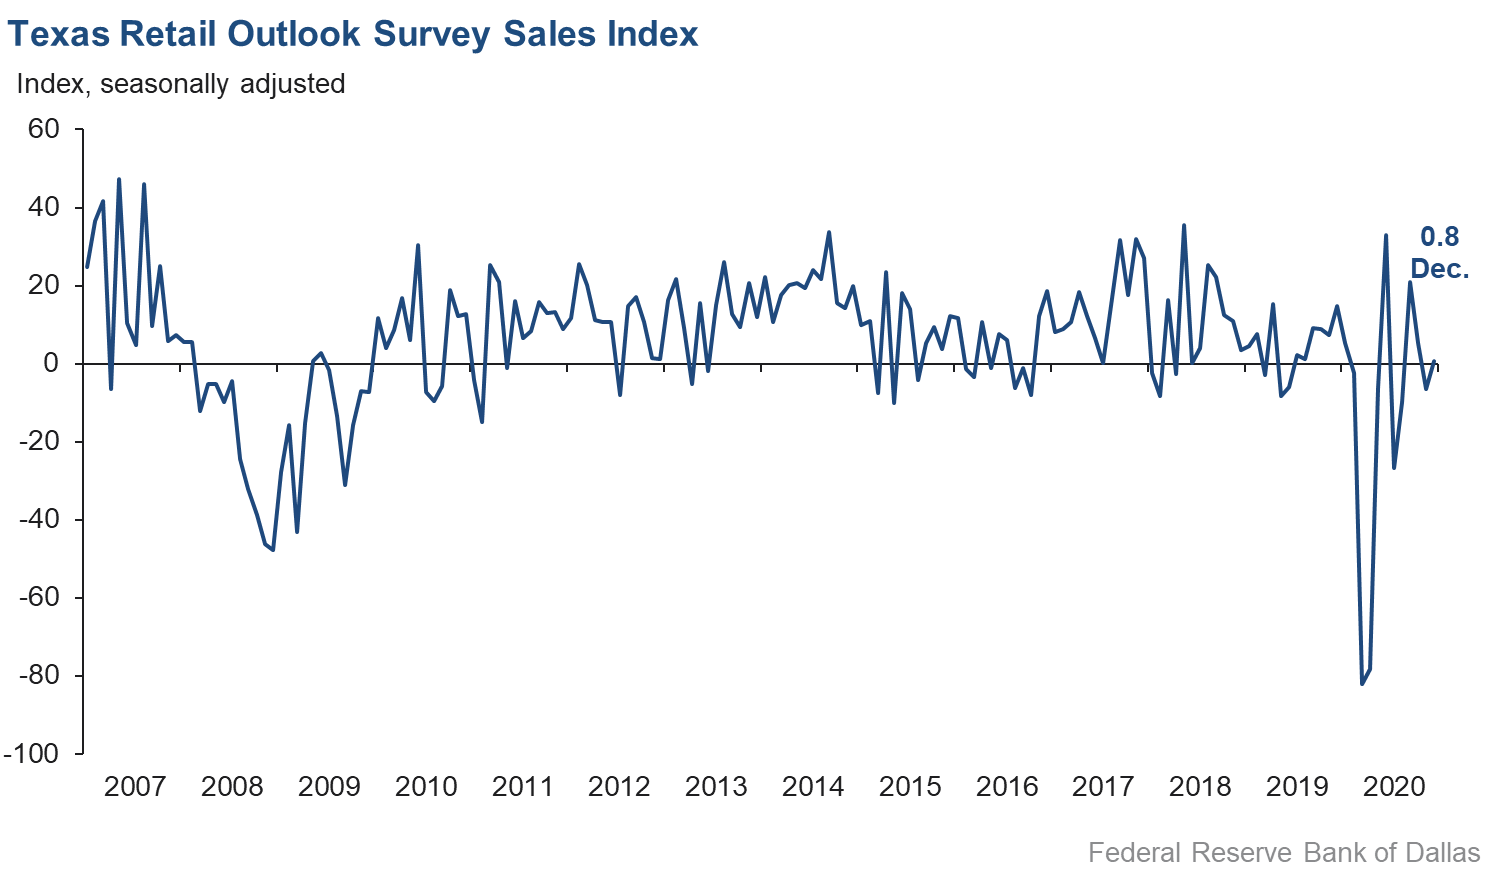
Retail sales activity was largely flat in December after posting a sizable decline in November, according to business executives responding to the Texas Retail Outlook Survey. The sales index, a key measure of state retail activity, rose from -6.5 to 0.8, with over a quarter of respondents noting increased sales. The inventory index flattened out, declining from 3.0 to -0.1.
Retail labor market indicators were mixed, with employment holding steady but average workweek length contracting. The employment index added nearly three points, rising from -2.4 to 0.3, and the part-time index added nearly six points, rising to 3.9. The hours worked index declined about two points to -4.0, suggesting that retailers continued to cut employee working hours on net.
Retailers’ perceptions of broader business conditions were increasingly pessimistic in December. The general business activity index declined over 10 points to -14.6, with over a quarter of respondents noting weaker activity compared to November. The company outlook index fell two points to -2.1. The outlook uncertainty index plunged from 18.4 to 0.0, suggesting no net change in uncertainty.
Retail wage pressures held steady, while price pressures surged in December. The wages and benefits index was flat at 6.5, with just 10 percent of respondents noting an increase. The selling prices index rose from 13.9 to 20.3, while the input prices index surged from 20.3 to 35.4—the highest level in two and a half years.
Retailers’ perceptions of future activity remained solidly optimistic in December. The future general business activity index rose slightly from 19.0 in November to 20.5 in December, while the future sales index ticked up from 29.0 to 31.8. Other indexes of future retail activity such as employment improved, pointing to expectations of solid expansion in 2021.
The Texas Retail Outlook Survey is a component of the Texas Service Sector Outlook Survey that uses information only from respondents in the retail and wholesale sectors.
Next release: January 26, 2021
|
Data were collected December 14–22, and 228 Texas service sector and 52 retail sector business executives responded to the survey. The Dallas Fed conducts the Texas Service Sector Outlook Survey monthly to obtain a timely assessment of the state’s service sector activity. Firms are asked whether revenue, employment, prices, general business activity and other indicators increased, decreased or remained unchanged over the previous month. Survey responses are used to calculate an index for each indicator. Each index is calculated by subtracting the percentage of respondents reporting a decrease from the percentage reporting an increase. When the share of firms reporting an increase exceeds the share reporting a decrease, the index will be greater than zero, suggesting the indicator has increased over the prior month. If the share of firms reporting a decrease exceeds the share reporting an increase, the index will be below zero, suggesting the indicator has decreased over the prior month. An index will be zero when the number of firms reporting an increase is equal to the number of firms reporting a decrease. Data have been seasonally adjusted as necessary. |
Texas Service Sector Outlook Survey
December 29, 2020
Historical data are available from January 2007 to the most current release month.
| Business Indicators Relating to Facilities and Products in Texas Current (versus previous month) | ||||||||
| Indicator | Dec Index | Nov Index | Change | Series Average | Trend* | % Reporting Increase | % Reporting No Change | % Reporting Decrease |
Revenue | 4.2 | –0.7 | +4.9 | 10.7 | 1(+) | 27.8 | 48.7 | 23.6 |
Employment | 5.1 | 0.9 | +4.2 | 5.9 | 4(+) | 14.6 | 75.9 | 9.5 |
Part–Time Employment | 1.7 | –0.4 | +2.1 | 1.2 | 1(+) | 7.1 | 87.5 | 5.4 |
Hours Worked | 2.1 | 2.6 | –0.5 | 2.2 | 4(+) | 8.8 | 84.5 | 6.7 |
Wages and Benefits | 8.6 | 11.2 | –2.6 | 13.8 | 7(+) | 12.3 | 84.0 | 3.7 |
Input Prices | 21.8 | 20.7 | +1.1 | 24.8 | 8(+) | 25.5 | 70.8 | 3.7 |
Selling Prices | 5.3 | 3.3 | +2.0 | 4.9 | 5(+) | 15.0 | 75.3 | 9.7 |
Capital Expenditures | 2.2 | 2.4 | –0.2 | 9.6 | 4(+) | 11.5 | 79.2 | 9.3 |
| General Business Conditions Current (versus previous month) | ||||||||
| Indicator | Dec Index | Nov Index | Change | Series Average | Trend** | % Reporting Improved | % Reporting No Change | % Reporting Worsened |
Company Outlook | 0.7 | –0.8 | +1.5 | 4.8 | 1(+) | 18.1 | 64.5 | 17.4 |
General Business Activity | –4.3 | –2.6 | –1.7 | 2.6 | 2(–) | 17.8 | 60.1 | 22.1 |
| Indicator | Dec Index | Nov Index | Change | Series Average | Trend* | % Reporting Increase | % Reporting No Change | % Reporting Decrease |
Outlook Uncertainty† | 5.2 | 17.4 | –12.2 | 12.8 | 3(+) | 20.0 | 65.3 | 14.8 |
| Business Indicators Relating to Facilities and Products in Texas Future (six months ahead) | ||||||||
| Indicator | Dec Index | Nov Index | Change | Series Average | Trend* | % Reporting Increase | % Reporting No Change | % Reporting Decrease |
Revenue | 42.3 | 34.4 | +7.9 | 36.6 | 8(+) | 56.1 | 30.1 | 13.8 |
Employment | 31.7 | 22.8 | +8.9 | 21.5 | 8(+) | 40.3 | 51.1 | 8.6 |
Part–Time Employment | 8.6 | 6.8 | +1.8 | 6.3 | 5(+) | 13.9 | 80.8 | 5.3 |
Hours Worked | 12.5 | 6.9 | +5.6 | 5.4 | 8(+) | 17.8 | 76.9 | 5.3 |
Wages and Benefits | 33.2 | 29.7 | +3.5 | 35.5 | 8(+) | 37.4 | 58.4 | 4.2 |
Input Prices | 41.1 | 33.9 | +7.2 | 43.3 | 168(+) | 45.2 | 50.7 | 4.1 |
Selling Prices | 27.9 | 20.4 | +7.5 | 22.6 | 8(+) | 35.4 | 57.1 | 7.5 |
Capital Expenditures | 24.3 | 14.4 | +9.9 | 22.9 | 7(+) | 32.8 | 58.7 | 8.5 |
| General Business Conditions Future (six months ahead) | ||||||||
| Indicator | Dec Index | Nov Index | Change | Series Average | Trend** | % Reporting Improved | % Reporting No Change | % Reporting Worsened |
Company Outlook | 22.5 | 16.2 | +6.3 | 16.0 | 5(+) | 35.1 | 52.3 | 12.6 |
General Business Activity | 23.8 | 16.1 | +7.7 | 12.7 | 5(+) | 38.1 | 47.6 | 14.3 |
Texas Retail Outlook Survey
December 29, 2020
Historical data are available from January 2007 to the most current release month.
| Business Indicators Relating to Facilities and Products in Texas Retail (versus previous month) | ||||||||
| Indicator | Dec Index | Nov Index | Change | Series Average | Trend* | % Reporting Increase | % Reporting No Change | % Reporting Decrease |
Retail Activity in Texas | ||||||||
Sales | 0.8 | –6.5 | +7.3 | 5.5 | 1(+) | 27.7 | 45.3 | 26.9 |
Employment | 0.3 | –2.4 | +2.7 | 1.7 | 1(+) | 9.1 | 82.1 | 8.8 |
Part–Time Employment | 3.9 | –2.0 | +5.9 | –2.1 | 1(+) | 7.8 | 88.2 | 3.9 |
Hours Worked | –4.0 | –2.1 | –1.9 | –2.1 | 3(–) | 6.6 | 82.8 | 10.6 |
Wages and Benefits | 6.5 | 6.6 | –0.1 | 9.1 | 5(+) | 10.6 | 85.3 | 4.1 |
Input Prices | 35.4 | 20.3 | +15.1 | 18.8 | 8(+) | 37.0 | 61.4 | 1.6 |
Selling Prices | 20.3 | 13.9 | +6.4 | 10.1 | 7(+) | 25.5 | 69.3 | 5.2 |
Capital Expenditures | 0.7 | 4.0 | –3.3 | 7.3 | 2(+) | 9.0 | 82.7 | 8.3 |
Inventories | –0.1 | 3.0 | –3.1 | 2.4 | 1(–) | 21.3 | 57.3 | 21.4 |
Companywide Retail Activity | ||||||||
Companywide Sales | 4.7 | –9.6 | +14.3 | 6.9 | 1(+) | 26.6 | 51.5 | 21.9 |
Companywide Internet Sales | 7.0 | –5.4 | +12.4 | 6.1 | 1(+) | 18.7 | 69.6 | 11.7 |
| General Business Conditions, Retail Current (versus previous month) | ||||||||
| Indicator | Dec Index | Nov Index | Change | Series Average | Trend** | % Reporting Improved | % Reporting No Change | % Reporting Worsened |
Company Outlook | –2.1 | –0.1 | –2.0 | 3.2 | 2(–) | 15.1 | 67.7 | 17.2 |
General Business Activity | –14.6 | –4.2 | –10.4 | –1.1 | 2(–) | 12.9 | 59.6 | 27.5 |
| Outlook Uncertainty Current (versus previous month) | ||||||||
| Indicator | Dec Index | Nov Index | Change | Series Average | Trend* | % Reporting Increase | % Reporting No Change | % Reporting Decrease |
Outlook Uncertainty† | 0.0 | 18.4 | –18.4 | 10.1 | 1() | 11.8 | 76.5 | 11.8 |
| Business Indicators Relating to Facilities and Products in Texas, Retail Future (six months ahead) | ||||||||
| Indicator | Dec Index | Nov Index | Change | Series Average | Trend* | % Reporting Increase | % Reporting No Change | % Reporting Decrease |
Retail Activity in Texas | ||||||||
Sales | 31.8 | 29.0 | +2.8 | 31.9 | 8(+) | 50.1 | 31.6 | 18.3 |
Employment | 21.5 | 16.9 | +4.6 | 11.9 | 8(+) | 31.5 | 58.5 | 10.0 |
Part–Time Employment | –0.8 | 5.9 | –6.7 | 0.6 | 1(–) | 8.4 | 82.4 | 9.2 |
Hours Worked | 1.8 | 2.4 | –0.6 | 2.7 | 8(+) | 12.3 | 77.2 | 10.5 |
Wages and Benefits | 32.2 | 26.7 | +5.5 | 26.9 | 8(+) | 37.3 | 57.7 | 5.1 |
Input Prices | 53.0 | 42.9 | +10.1 | 32.6 | 8(+) | 56.9 | 39.2 | 3.9 |
Selling Prices | 47.0 | 38.8 | +8.2 | 28.7 | 8(+) | 52.9 | 41.2 | 5.9 |
Capital Expenditures | 20.0 | 14.3 | +5.7 | 16.8 | 7(+) | 30.0 | 60.0 | 10.0 |
Inventories | 12.0 | 21.9 | –9.9 | 8.4 | 8(+) | 32.1 | 47.7 | 20.1 |
Companywide Retail Activity | ||||||||
Companywide Sales | 29.4 | 23.3 | +6.1 | 30.3 | 8(+) | 42.3 | 44.9 | 12.9 |
Companywide Internet Sales | 33.3 | 18.4 | +14.9 | 21.7 | 9(+) | 39.4 | 54.5 | 6.1 |
| General Business Conditions, Retail Future (six months ahead) | ||||||||
| Indicator | Dec Index | Nov Index | Change | Series Average | Trend** | % Reporting Improved | % Reporting No Change | % Reporting Worsened |
Company Outlook | 24.3 | 17.5 | +6.8 | 16.7 | 8(+) | 33.8 | 56.7 | 9.5 |
General Business Activity | 20.5 | 19.0 | +1.5 | 12.5 | 5(+) | 36.3 | 47.9 | 15.8 |
*Shown is the number of consecutive months of expansion or contraction in the underlying indicator. Expansion is indicated by a positive index reading and denoted by a (+) in the table. Contraction is indicated by a negative index reading and denoted by a (–) in the table.
**Shown is the number of consecutive months of improvement or worsening in the underlying indicator. Improvement is indicated by a positive index reading and denoted by a (+) in the table. Worsening is indicated by a negative index reading and denoted by a (–) in the table.
†Added to survey in January 2018.
Data have been seasonally adjusted as necessary, with the exception of the outlook uncertainty index which does not yet have a sufficiently long time series to test for seasonality.
Texas Service Sector Outlook Survey
December 29, 2020
Texas Retail Outlook Survey
December 29, 2020
Texas Service Sector Outlook Survey
December 29, 2020
Comments from Survey Respondents
These comments are from respondents’ completed surveys and have been edited for publication.
Utilities
- There is more bad debt.
Truck Transportation
- If Biden becomes president, then we are in a terrible position.
Support Activities for Transportation
- The market is very busy at present. We’re uncertain what things will look like mid-first quarter 2021.
Warehousing and Storage
- We believe the recovery we have seen over the past several months will be sustained in December but believe that we will still have some retracement in the volume of crude oil exports in 2021, so our 2021 budget reflects a decrease from 2020 actual results. We will not be reducing head count nor reducing our level of maintenance and capital spending, however, as we do expect a bump up in 2022 and a return to 2020 levels by 2023.
Publishing Industries (Except Internet)
- Budget uncertainty in federal budgets and some international clients near term has slowed expected orders for this month. Also, past uncertainty for small business support has created more business and planning risk for us, as with many small organizations.
Data Processing, Hosting and Related Services
- A combination of the holidays and the election results has made business managers more hesitant to make purchasing decisions. This has caused us to put our hiring plans on hold until we get more visibility as to how long the hesitation will last.
Credit Intermediation and Related Activities
- The uncertainty for the future will be hard to determine due to the potential political changes and the possible regulatory changes. The Paycheck Protection Program has resulted in a positive impact to most banks’ bottom lines with the collection of fees from the SBA (Small Business Administration). Deposits are elevated but interest expense has decreased with low rates paid on deposits. Interest margins are being reduced, and the only opportunity to offset the trend is to increase the volume of earning assets. Reducing noninterest expense will be included in some strategies. The status of retail, manufacturing, transportation, agriculture and consumer spending will be a critical measurement in determining the compensatory impact of the state of the economy in 2021.
- Not having a package from the government passed gives pause to us because we can see a domino effect in all sectors until the vaccine is fully implemented. We continue to see the hotel, restaurant, convention and leisure activity areas hit the hardest and expect no recovery for them until 2022. Unemployment is still of great concern.
- The general activity level is slightly down during the past six weeks. Customers indicate concerns relative to possible tax law changes and regulatory changes beginning in 2021, depending on the election outcome. Our clients are typically making decisions relative to long-term capital needs related to commercial real estate, so uncertainty is a dampening factor. Our six-month outlook is influenced by two main factors: A resolution of some of the perceived political risk related to tax policy and an expectation that regulatory oversight in the banking sector is likely to include increased reserves for CRE (commercial real estate) loans, which will eventually cause borrowers to favor sourcing loans from the life insurance sector, which is where our focus is concentrated.
- Our nonprofit was just awarded a big $3 million grant. Our garage business is performing well. We’re hopeful that we have finally secured a refinance option for our real estate. Things are looking better!
Securities, Commodity Contracts, and Other Financial Investments and Related Activities
- The vaccine rollout, we expect, will improve the business climate in second quarter 2021 going forward.
- Our history in this business has been as a supplier of services to the oil and gas industry, which is down significantly. We are down along with the industry. These are hard times.
- We have closed the firm.
Insurance Carriers and Related Activities
- COVID-19 is hitting East Texas like the rest of the country, so uncertainty has increased in the past month. But, with the vaccine approved over the weekend, there is renewed optimism that the end of this pandemic is closer. Plus, with the Electoral College [vote], hopefully some of the political rhetoric will subside.
Real Estate
- We have had some big real estate purchases [in which] buyers agree to close on properties in 2020 instead of January 2021, [avoiding] unknown possible tax exposure. This has been a good December.
- The two vaccines have been great news for our employees and agents—[they have] much more positive attitudes.
Rental and Leasing Services
- For U.S. capital goods suppliers, the problem with growing anything next year is going to be getting ahold of the capital goods. Supply lines are shot to hell, and there are far fewer vendors for our manufacturers to purchase components from worldwide. Assuming the Republicans hold the Senate, I think next year will be about flat with this year. If [they don’t], then all bets are off. We will cut another 100 employees and bunker down!
- The live events industry will be the last industry to return to normal. Thirty percent of our industry is gone, and another 60 percent will go out of business by February without relief.
Professional, Scientific and Technical Services
- It is very difficult to determine what the real estate market will look like in six months, but we are more optimistic with the approval of the vaccine. There are two major questions we are facing in the real estate market. First, how quickly will the office, hotel and retail markets recover. Secondly, what is the incoming administration going to do with the capital gains rate and tax-deferred exchanges. These issues could make or break not only the real estate market but the recovery of the economy.
- We are now expecting to best last year's numbers for gross revenue and net income to the partners. Collections have remained good, though we obviously had a slowdown in work in the spring.
- Our costs are going up, including labor, but selling prices are not increasing. That means we will be squeezed on margin in 2021. We would like to know if this is a broader trend than just our consulting business.
- More closures of restaurants and retail establishments in states such as California cause more uncertainty in our outlook. As long as most restaurants and retailers in most states can stay open, our outlook will remain the same or possibly improve.
- 2020 actually ended up being a strong year for us because we had several contracts already in the pipeline, and our nonprofit partners leaned on us for communications plans, fundraising and general support as they had to pivot program delivery in many cases. However, we have a much leaner pipeline going into 2021, as we know nonprofits are so focused on keeping their programs afloat during a time of great need.
- We need to restore trust in government and need to get the vaccine working and dispensed. We need to get through this to the other side.
- Clarification and protection on tax implications of PPP [Paycheck Protection Program] loans are important for next year’s budget planning.
- Without the ability to freely meet with prospects wanting or needing to transition out of their businesses, it is virtually impossible to obtain businesses to sell. Some consulting work along the lines of helping price businesses for sale or helping to decide if the businesses should remain open appears to be a possible revenue opportunity going forward.
- I have hope that there will be improvement after the first of the year, based on the vaccine being widely available and administered by summer. This would improve the energy business and, therefore, my consulting opportunities.
- The economy is getting stronger, showing signs we are getting out of the COVID-19 situation. Many small-sized customers are doing larger purchases like the old days for their IT needs.
Management of Companies and Enterprises
- The Federal Reserve is artificially manipulating interest rates by buying up investment securities. They need to let normal supply and demand dictate where interest rates should be. They are risking another banking crisis for banks with interest rate risk.
Administrative and Support Services
- Fear of COVID-19 has had an impact on our customer base.
- There appears to be significant political risk related to the passage of stimulus 2.0. Otherwise, low interest rates, a relatively high unemployment rate and slowing economic growth are the current reality.
- With the release of the first COVID-19 vaccine, and two more right behind it, there is light at the end of the pandemic tunnel. A stimulus deal looks possible this month. We will still need more aid to the unemployed and small businesses impacted by COVID-19, but that's a 2021 issue. Things are looking up!
- We continue to have employee issues stemming from COVID-19 and lack of applicants.
- The new stimulus bill was just passed, but I’ve yet to see if our company will benefit. It is so difficult to stay in business when we were provided PPP loans to cover eight weeks of the virus when it will last a year.
- Needless to say, the speculation of a future increase in the number of employees and improved revenue is as a result of the availability of the COVID-19 vaccine.
- Recruiting activity related to hiring professionals for Texas companies had increased in November and has slightly softened in December. We are unsure if that is related to the uptick in COVID-19 cases, the holidays, delay in approving additional financial support from Congress, or just a settling down of demand. We are cautiously optimistic demand for our services will continue to increase in the first and second quarter of 2021 as companies realize they will need talent to regain market share and increase profitability.
Educational Services
- Passage of the latest COVID relief bill gives us direct benefits that will improve our outlook for January and the following months.
Ambulatory Health Care Services
- CMS [Centers for Medicare & Medicaid Services] just published a rate reduction of 10 percent effective Jan. 1, 2021. This will impact us tremendously. This year we are fortunate to break even; last year our profit margin was 16 percent. This will be challenging for us, even though we are used to deflation.
- With the arrival of the vaccination for the health care providers, this gives us a sense of predictability to this environment.
Hospitals
- Approval of the first vaccine and success of monoclonal antibody treatment for COVID-19 have markedly increased optimism for 2021.
Social Assistance
- The biggest issue is hiring enough employees for warehouse and retail stores. We believe unemployment policies are keeping many out of the market.
Performing Arts, Spectator Sports, and Related Industries
- Government control of the economy and spending are out of control. Government is the problem.
Amusement, Gambling and Recreation Industries
- We see downward trends due to the continuation of COVID-19.
Accommodation
- Discussions regarding a significant and comprehensive federal infrastructure bill give us reason to be more optimistic about the future. Our lodging business will certainly benefit from nationwide investment in transportation, 5G [fifth generation wireless technology], renewable energy and education.
- January and February look bleak for lodging. Without the holiday season to spur leisure travel and [with] COVID still preventing business travel and group meetings and conventions, occupancies will be very low. Hopefully the vaccine begins to build consumer and traveler confidence as the year progresses.
Food Services and Drinking Places
- We are afraid of the Biden administration and what it will do to small business.
- I am short 1,000 employees! It is very difficult to hire.
- Does anyone get what 1,000 small businesses going under looks like?
- I am still waiting on [our partner’s] corporate office to allow me to go back to my hot dog stands and work.
Personal and Laundry Services
- Work-from-home is negatively affecting our business. Men are getting less-frequent haircuts. People who are unemployed or underemployed also are getting fewer haircuts. We have also seen some people a bit demoralized with the pandemic, resulting in less attention to appearance. New trends are emerging of nonjudgment of appearance, so natural looks are trending, resulting in less haircuts.
Merchant Wholesalers, Durable Goods
- Our confidence in future increases in sales is based on the vaccine effectively allowing manufacturing businesses to return to normal in approximately six months’ time. We do not expect increases in the next couple of months. Our outlook would change if there were problems with the vaccine.
- Logistics constraints are becoming an increasing problem in coordinating shipments between various shipping methods. Availability of containers and increased costs through the various shipping methods and vendors are starting to have a more broad impact.
Merchant Wholesalers, Nondurable Goods
- November was a good month, and December is continuing the trend. If restaurants stay open next year, the first two quarters of 2021 look strong.
Motor Vehicle and Parts Dealers
- There is a definite increase in COVID infection rates—we are hoping it doesn’t have an impact on sales.
- Currently and for the foreseeable future, we are forced to do business with far less sellable inventory than is normal. It is likely to be late spring before the distribution chains return to normal.
- Inventory of new and used cars and trucks is very low and will likely not recover until third quarter 2021. The positive is that our inventory costs are substantially less.
Building Material and Garden Equipment and Supplies Dealers
- Steel prices have increased rapidly over the past 45 days. In addition, steel supply is also constrained as companies have been increasing inventories in reaction to the price increases. Though the initial material increases spark a surge of purchases in the short term, the long-term effect will be a decrease in sales. People will wait until prices come down before purchasing.
Historical Data
Historical data can be downloaded dating back to January 2007.
Indexes
Download indexes for all indicators. For the definitions of all variables, see Data Definitions.
Texas Service Sector Outlook Survey |
Texas Retail Outlook Survey |
| Unadjusted | Unadjusted |
| Seasonally adjusted | Seasonally adjusted |
All Data
Download indexes and components of the indexes (percentage of respondents reporting increase, decrease, or no change). For the definitions of all variables, see Data Definitions.
Texas Service Sector Outlook Survey |
Texas Retail Outlook Survey |
| Unadjusted | Unadjusted |
| Seasonally adjusted | Seasonally adjusted |
Questions regarding the Texas Service Sector Outlook Survey can be addressed to Christopher Slijk at christopher.slijk@dal.frb.org.
Sign up for our email alert to be automatically notified as soon as the latest Texas Service Sector Outlook Survey is released on the web.