
Texas Service Sector Outlook Survey
Growth resumes in Texas service sector activity
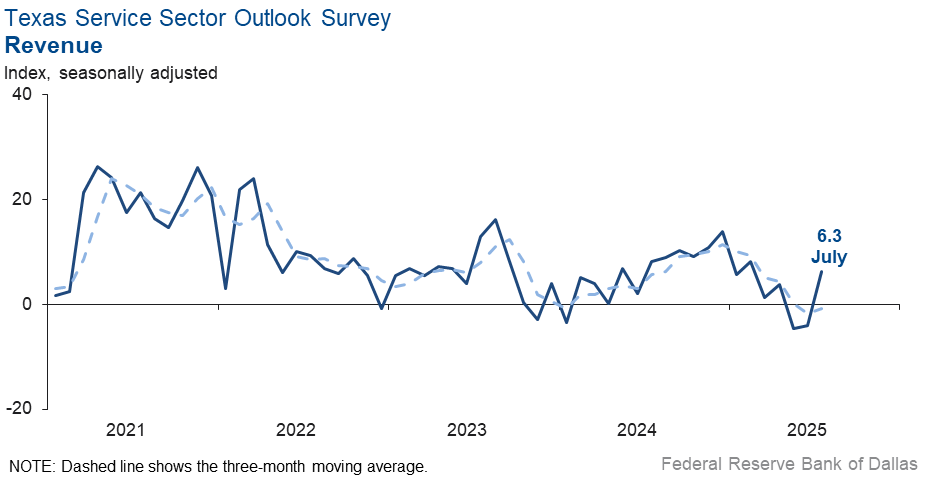
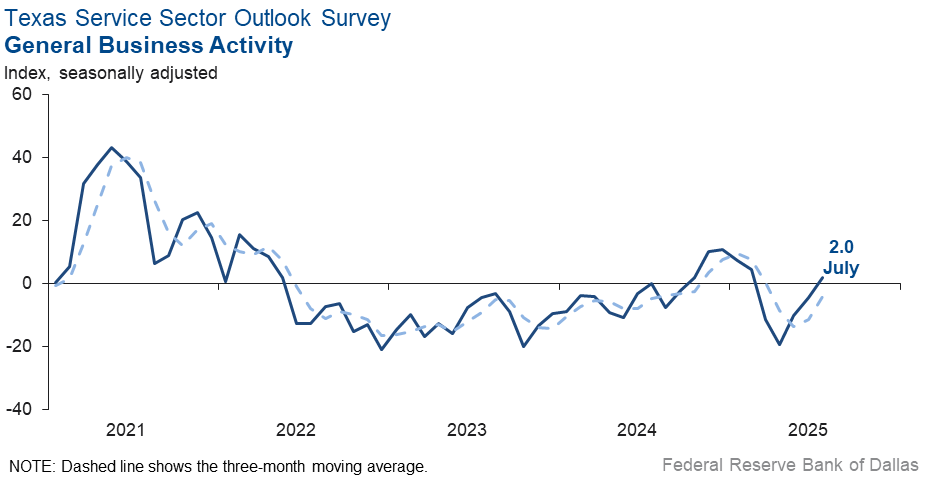
Texas service sector activity expanded in July after contracting for two consecutive months, according to business executives responding to the Texas Service Sector Outlook Survey. The revenue index, a key measure of state service sector conditions, increased 10 points to 6.3.
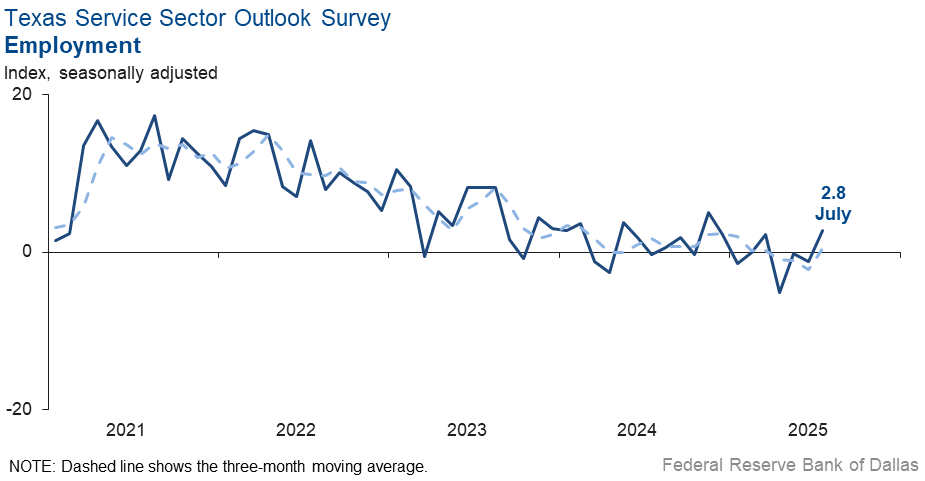
Labor market measures indicated employment and hours worked also grew in July. The employment index edged up to 2.8 from -1.2. The part-time employment index dipped to -3.8 from -1.7, while the hours worked index increased to 3.2.
Perceptions of broader business conditions were mixed in July. The general business activity index moved back into positive territory to 2.0 from -4.4, while the company outlook index remained negative but stable at -2.1. The outlook uncertainty index fell seven points to 12.8.
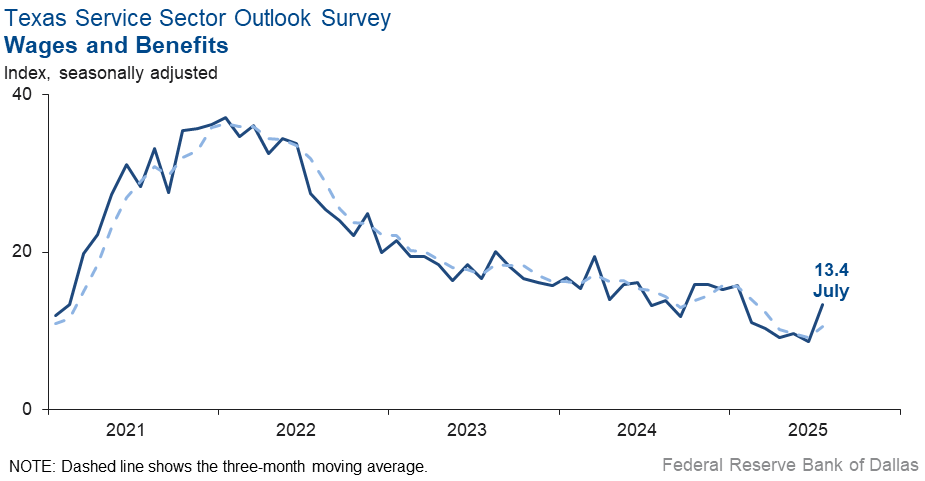
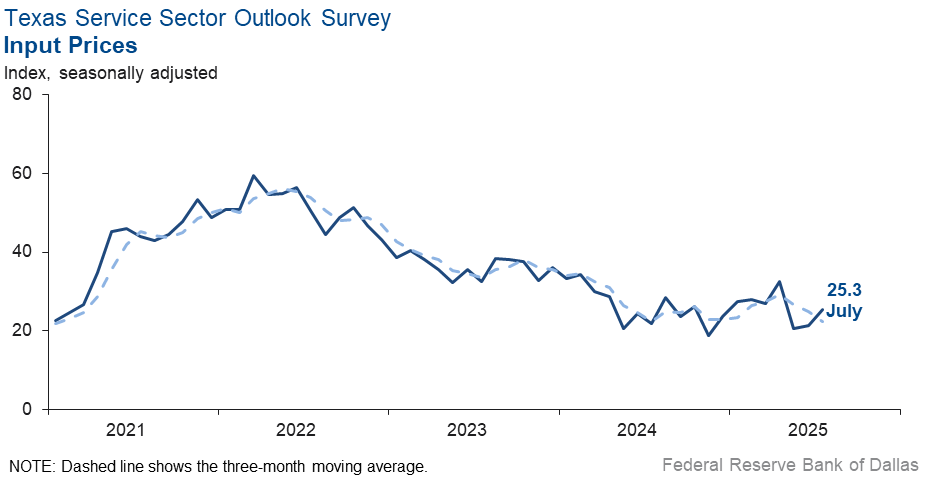
Input price and wage pressures increased, while selling price growth eased this month. The input prices index increased slightly to 25.3 from 21.3, but the selling prices index fell four points to 3.3. The wages and benefits index rose to 13.4 from 8.6 last month.
Respondents’ expectations regarding future business activity improved. The future general business activity index moved up to 9.8 from 1.5, while the future revenue index was relatively unchanged at 31.3. Other future service sector activity indexes, such as employment and capital expenditures also remained stable and in positive territory.

Texas Retail Outlook Survey
Texas retail sales stabilize after a two-month drop
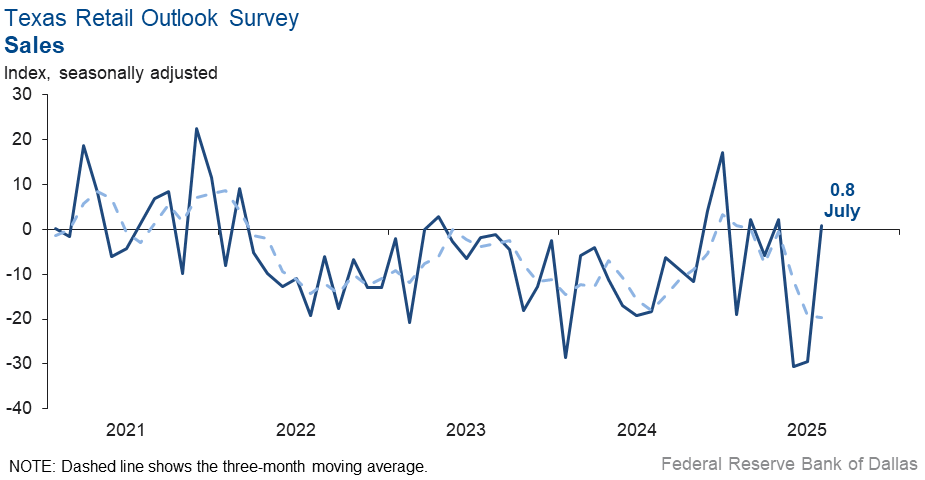
Texas retail sales were flat in July, according to business executives responding to the Texas Retail Outlook Survey. The sales index, a key measure of state retail activity, increased to 0.8 from -29.5, with the near-zero reading suggesting little change in sales from June. Retailers’ inventories fell for the sixth consecutive month, with the index remaining in negative territory at -2.1 in July.
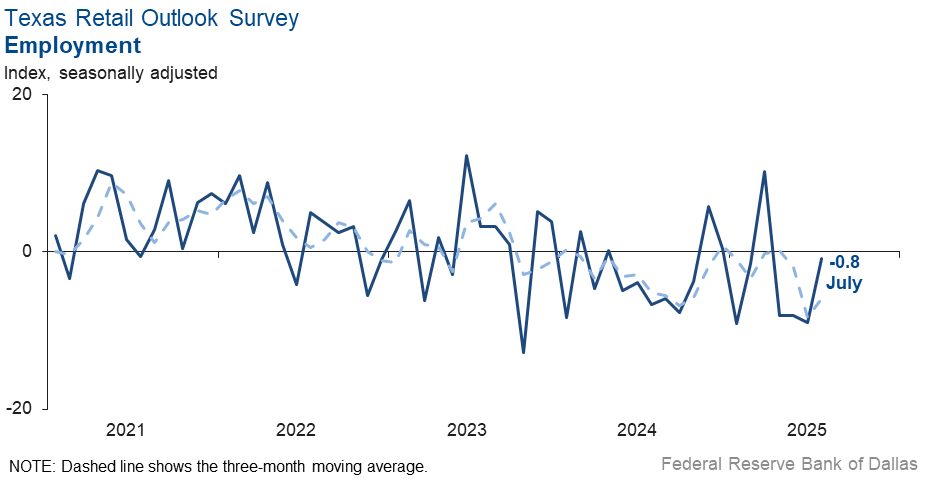
Retail sector labor market indicators suggested no growth in employment and hours worked. Both the employment index and the hours worked index improved slightly to -0.8 and 0.6 respectively, with the near-zero readings reflecting flat headcounts and no change in hours worked from last month. Meanwhile, the part-time employment index increased to 2.0 from -4.9.
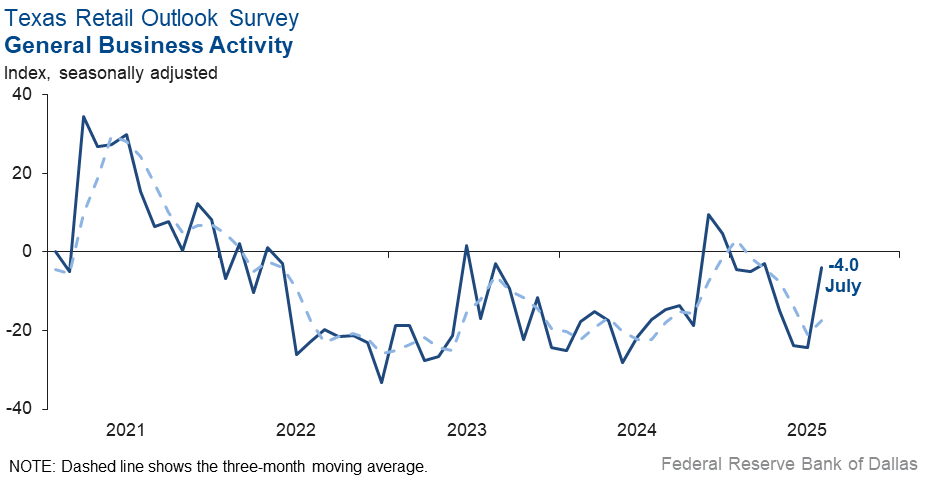
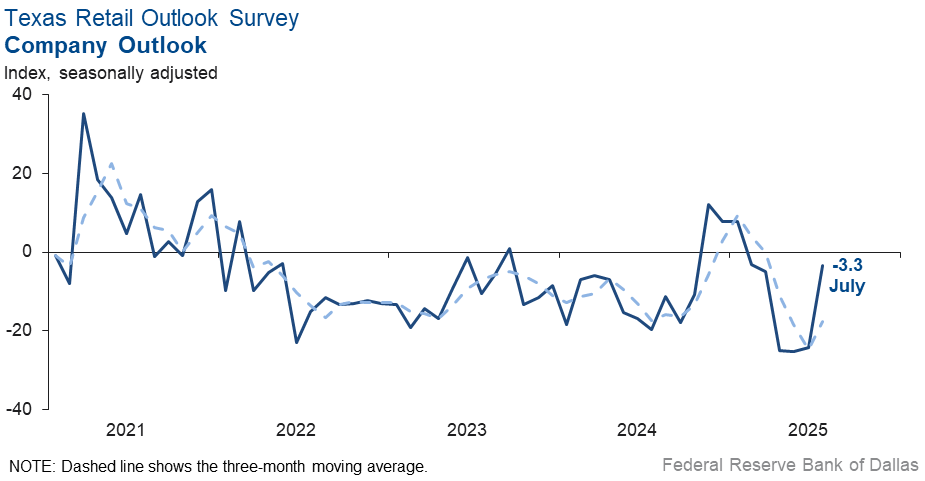
Perceptions of broader business conditions were less pessimistic in July. Both the general business activity index and the company outlook index remained in negative territory, but improved to -4.0 and -3.3, respectively. The outlook uncertainty index fell three points to 16.3 but remained above its series average.
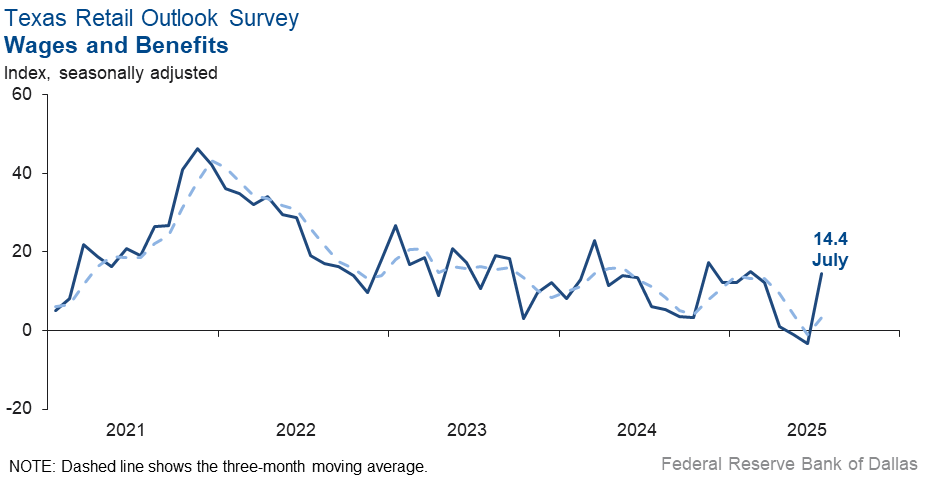
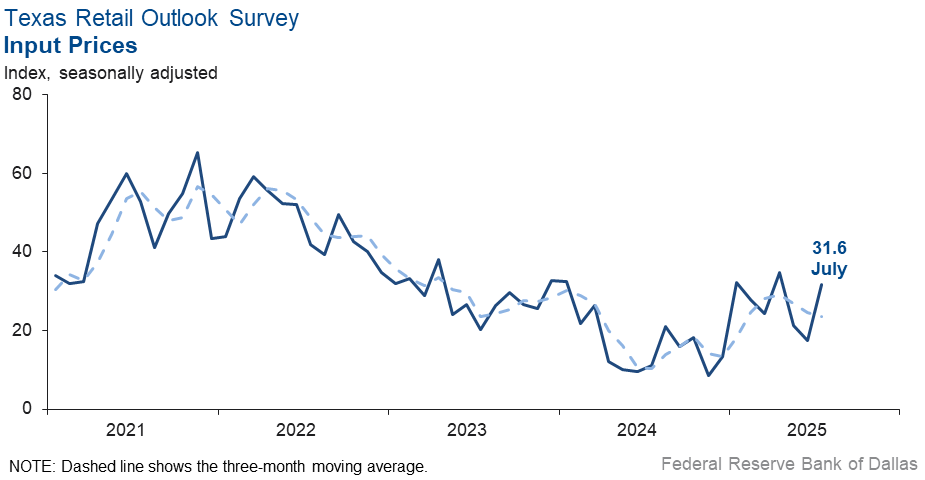
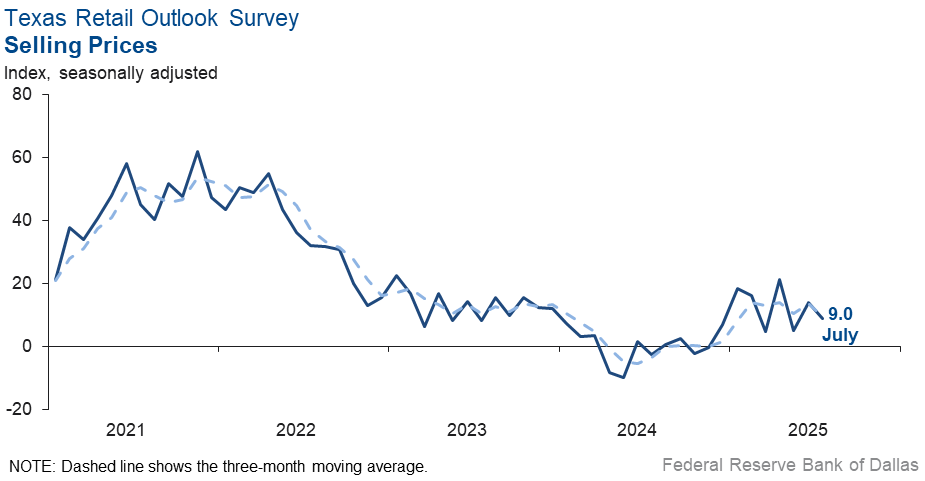
Input price and wage growth accelerated while selling price pressures eased this month. The input prices index rose 14 points to 31.6, while the selling prices index dipped five points to 9.0. The wages and benefits index increased 18 points to 14.4.
Expectations for future retail activity improved in July. The future general business activity index jumped to 15.6 from -3.2 while the future sales index rose 12 points to 31.2. Other future retail activity indexes, such as employment and capital expenditures remained in positive territory.
Next release: August 26, 2025
Data were collected July 15–23, and 255 of the 359 Texas service sector business executives surveyed submitted responses. The Dallas Fed conducts the Texas Service Sector Outlook Survey monthly to obtain a timely assessment of the state’s service sector activity. Firms are asked whether revenue, employment, prices, general business activity and other indicators increased, decreased or remained unchanged over the previous month.
Survey responses are used to calculate an index for each indicator. Each index is calculated by subtracting the percentage of respondents reporting a decrease from the percentage reporting an increase. When the share of firms reporting an increase exceeds the share reporting a decrease, the index will be greater than zero, suggesting the indicator has increased over the prior month. If the share of firms reporting a decrease exceeds the share reporting an increase, the index will be below zero, suggesting the indicator has decreased over the prior month. An index will be zero when the number of firms reporting an increase is equal to the number of firms reporting a decrease. Data have been seasonally adjusted as necessary.
Data have been seasonally adjusted as necessary.
Texas Service Sector Outlook Survey
Historical data are available from January 2007 to the most current release month.
| Business Indicators Relating to Facilities and Products in Texas Current (versus previous month) | ||||||||
| Indicator | Jul Index | Jun Index | Change | Series Average | Trend* | % Reporting Increase | % Reporting No Change | % Reporting Decrease |
Revenue | 6.3 | –4.1 | +10.4 | 10.3 | 1(+) | 26.3 | 53.7 | 20.0 |
Employment | 2.8 | –1.2 | +4.0 | 6.0 | 1(+) | 13.4 | 76.0 | 10.6 |
Part–Time Employment | –3.8 | –1.7 | –2.1 | 1.3 | 5(–) | 2.3 | 91.6 | 6.1 |
Hours Worked | 3.2 | 0.0 | +3.2 | 2.5 | 1(+) | 8.1 | 87.0 | 4.9 |
Wages and Benefits | 13.4 | 8.6 | +4.8 | 15.6 | 62(+) | 16.9 | 79.6 | 3.5 |
Input Prices | 25.3 | 21.3 | +4.0 | 27.8 | 63(+) | 28.4 | 68.5 | 3.1 |
Selling Prices | 3.3 | 6.8 | –3.5 | 7.5 | 60(+) | 13.6 | 76.1 | 10.3 |
Capital Expenditures | 12.1 | 7.5 | +4.6 | 9.8 | 60(+) | 16.9 | 78.3 | 4.8 |
| General Business Conditions Current (versus previous month) | ||||||||
| Indicator | Jul Index | Jun Index | Change | Series Average | Trend** | % Reporting Improved | % Reporting No Change | % Reporting Worsened |
Company Outlook | –2.1 | –2.4 | +0.3 | 4.1 | 5(–) | 16.3 | 65.3 | 18.4 |
General Business Activity | 2.0 | –4.4 | +6.4 | 2.1 | 1(+) | 16.8 | 68.4 | 14.8 |
| Indicator | Jul Index | Jun Index | Change | Series Average | Trend* | % Reporting Increase | % Reporting No Change | % Reporting Decrease |
Outlook Uncertainty | 12.8 | 19.7 | –6.9 | 13.6 | 50(+) | 22.6 | 67.6 | 9.8 |
| Business Indicators Relating to Facilities and Products in Texas Future (six months ahead) | ||||||||
| Indicator | Jul Index | Jun Index | Change | Series Average | Trend* | % Reporting Increase | % Reporting No Change | % Reporting Decrease |
Revenue | 31.3 | 33.4 | –2.1 | 37.3 | 63(+) | 46.0 | 39.2 | 14.7 |
Employment | 19.1 | 19.9 | –0.8 | 23.0 | 63(+) | 29.6 | 59.9 | 10.5 |
Part–Time Employment | 3.8 | –1.2 | +5.0 | 6.5 | 1(+) | 8.6 | 86.6 | 4.8 |
Hours Worked | 7.0 | 0.1 | +6.9 | 5.9 | 3(+) | 11.1 | 84.8 | 4.1 |
Wages and Benefits | 34.5 | 38.4 | –3.9 | 37.4 | 63(+) | 38.6 | 57.3 | 4.1 |
Input Prices | 41.4 | 31.7 | +9.7 | 44.3 | 223(+) | 45.7 | 49.9 | 4.3 |
Selling Prices | 20.5 | 16.6 | +3.9 | 24.5 | 63(+) | 28.9 | 62.7 | 8.4 |
Capital Expenditures | 13.5 | 14.0 | –0.5 | 22.5 | 62(+) | 22.2 | 69.1 | 8.7 |
| General Business Conditions Future (six months ahead) | ||||||||
| Indicator | Jul Index | Jun Index | Change | Series Average | Trend** | % Reporting Improved | % Reporting No Change | % Reporting Worsened |
Company Outlook | 13.8 | 7.1 | +6.7 | 15.4 | 3(+) | 31.5 | 50.8 | 17.7 |
General Business Activity | 9.8 | 1.5 | +8.3 | 11.9 | 2(+) | 28.0 | 53.8 | 18.2 |
Historical data are available from January 2007 to the most current release month.
| Business Indicators Relating to Facilities and Products in Texas Retail (versus previous month) | ||||||||
| Indicator | Jul Index | Jun Index | Change | Series Average | Trend* | % Reporting Increase | % Reporting No Change | % Reporting Decrease |
| Retail Activity in Texas | ||||||||
Sales | 0.8 | –29.5 | +30.3 | 2.8 | 1(+) | 24.5 | 51.8 | 23.7 |
Employment | –0.8 | –9.0 | +8.2 | 1.4 | 4(–) | 9.1 | 81.0 | 9.9 |
Part–Time Employment | 2.0 | –4.9 | +6.9 | –1.5 | 1(+) | 7.5 | 87.0 | 5.5 |
Hours Worked | 0.6 | –14.1 | +14.7 | –2.2 | 1(+) | 6.5 | 87.6 | 5.9 |
Wages and Benefits | 14.4 | –3.3 | +17.7 | 11.1 | 1(+) | 23.0 | 68.4 | 8.6 |
Input Prices | 31.6 | 17.5 | +14.1 | 22.6 | 63(+) | 41.7 | 48.2 | 10.1 |
Selling Prices | 9.0 | 14.1 | –5.1 | 13.1 | 8(+) | 24.7 | 59.6 | 15.7 |
Capital Expenditures | 8.3 | 6.9 | +1.4 | 7.4 | 2(+) | 13.8 | 80.7 | 5.5 |
Inventories | –2.1 | –2.8 | +0.7 | 2.6 | 6(–) | 16.3 | 65.3 | 18.4 |
| Companywide Retail Activity | ||||||||
Companywide Sales | –15.3 | –24.0 | +8.7 | 4.0 | 3(–) | 14.7 | 55.3 | 30.0 |
Companywide Internet Sales | –9.0 | –16.0 | +7.0 | 3.5 | 5(–) | 7.8 | 75.4 | 16.8 |
| General Business Conditions, Retail Current (versus previous month) | ||||||||
| Indicator | Jul Index | Jun Index | Change | Series Average | Trend** | % Reporting Improved | % Reporting No Change | % Reporting Worsened |
Company Outlook | –3.3 | –24.2 | +20.9 | 1.0 | 6(–) | 16.0 | 64.7 | 19.3 |
General Business Activity | –4.0 | –24.4 | +20.4 | –2.8 | 7(–) | 15.3 | 65.4 | 19.3 |
| Outlook Uncertainty Current (versus previous month) | ||||||||
| Indicator | Jul Index | Jun Index | Change | Series Average | Trend* | % Reporting Increase | % Reporting No Change | % Reporting Decrease |
Outlook Uncertainty | 16.3 | 18.8 | –2.5 | 11.5 | 12(+) | 22.8 | 70.7 | 6.5 |
| Business Indicators Relating to Facilities and Products in Texas, Retail Future (six months ahead) | ||||||||
| Indicator | Jul Index | Jun Index | Change | Series Average | Trend* | % Reporting Increase | % Reporting No Change | % Reporting Decrease |
| Retail Activity in Texas | ||||||||
Sales | 31.2 | 19.1 | +12.1 | 30.1 | 26(+) | 41.0 | 49.2 | 9.8 |
Employment | 23.4 | 13.4 | +10.0 | 12.7 | 3(+) | 30.1 | 63.3 | 6.7 |
Part–Time Employment | 15.7 | –8.1 | +23.8 | 1.5 | 1(+) | 16.5 | 82.7 | 0.8 |
Hours Worked | 10.4 | –12.3 | +22.7 | 2.2 | 1(+) | 14.1 | 82.2 | 3.7 |
Wages and Benefits | 34.9 | 27.5 | +7.4 | 28.9 | 63(+) | 38.1 | 58.6 | 3.2 |
Input Prices | 41.4 | 23.1 | +18.3 | 33.9 | 63(+) | 45.7 | 49.9 | 4.3 |
Selling Prices | 13.5 | 24.4 | –10.9 | 28.3 | 63(+) | 22.2 | 69.1 | 8.7 |
Capital Expenditures | 9.5 | 19.0 | –9.5 | 16.4 | 3(+) | 17.3 | 74.9 | 7.8 |
Inventories | 13.0 | 9.6 | +3.4 | 10.6 | 3(+) | 31.3 | 50.4 | 18.3 |
| Companywide Retail Activity | ||||||||
Companywide Sales | 22.2 | 15.4 | +6.8 | 28.5 | 3(+) | 37.1 | 48.0 | 14.9 |
Companywide Internet Sales | 12.8 | 3.2 | +9.6 | 21.0 | 18(+) | 22.6 | 67.6 | 9.8 |
| General Business Conditions, Retail Future (six months ahead) | ||||||||
| Indicator | Jul Index | Jun Index | Change | Series Average | Trend** | % Reporting Improved | % Reporting No Change | % Reporting Worsened |
Company Outlook | 19.8 | 4.3 | +15.5 | 14.7 | 2(+) | 33.6 | 52.6 | 13.8 |
General Business Activity | 15.6 | –3.2 | +18.8 | 10.2 | 1(+) | 33.9 | 47.9 | 18.3 |
*Shown is the number of consecutive months of expansion or contraction in the underlying indicator. Expansion is indicated by a positive index reading and denoted by a (+) in the table. Contraction is indicated by a negative index reading and denoted by a (–) in the table.
**Shown is the number of consecutive months of improvement or worsening in the underlying indicator. Improvement is indicated by a positive index reading and denoted by a (+) in the table. Worsening is indicated by a negative index reading and denoted by a (–) in the table.
Data have been seasonally adjusted as necessary.
Texas Service Sector Outlook Survey


Texas Retail Outlook Survey
Texas Service Sector Outlook Survey
Comments from survey respondents
Survey participants are given the opportunity to submit comments on current issues that may be affecting their businesses. Some comments have been edited for grammar and clarity.
- Seems like business is stuck in the doldrums.
- How tariffs go is how the balance of the year goes. If it plays out in a perceived positive manner, our business should see an uptick. If this goes poorly, it will change my outlook to "decrease."
- High interest rates continue to chill the commercial real estate market and CRE lending.
- Uncertainty generated by the current administration is the biggest negative to our planning processes.
- Interest rates are the main concern. Political and international issues are also considerations but appear secondary to the impact of interest rates.
- We will be looking to shut down within 60 days if the current sale does not go through.
- We are concerned about labor shortages.
- Regardless of how one feels about the tax bill, having it passed and behind us is great.
- What will replace homeownership as the engine driving the economy?
- As we begin to see real progress with recent legislative changes, it becomes more likely that the changes taking place are starting to benefit the economy, and people are becoming more positive.
- Tepid inflation is creeping up, mainly because of input cost.
- Federal budget questions remain a source of concern that could have significant impacts on universities.
- We are going through staff changes in different aspects of the business to save funds and improve financial performance.
- Commercial property insurance rates are moderating to lowering, so that is good for insurance buyers in Texas. After July 4, flood insurance will be a hot topic.
- Oil and gas infrastructure and industrial sector backlog along the Gulf Coast from Brownsville to Corpus Christi to Galveston, Houston and Beaumont has seen increased activity about 15 percent. We are aggressively hiring project engineers to meet the need and will complete hiring in 2-3 months. Proposal activity has increased month-over-month, with the scale of projects increasing in size and scope. More commercial sectors are softer (think Austin and Dallas). However, land development is robust. We are projecting another record year for our civil engineering firm, which was recently ranked No. 19 in the United States in the oil and gas sector and a Top 10 engineering firm in Houston.
- The White House continues to move dates on trade agreements; agencies are still in flux on regulatory actions and courts are moving slowly on resolving policy challenges. Lack of predictability makes business decisions and planning more difficult.
- A shortage of experienced, qualified workers remains a huge issue and limits our ability to grow. Entry-level candidates are available, but it takes a lot of resources and time to train them.
- Our domestic and international orders are down.
- The real estate market in Texas remains flat, and there is no indication that it will change in the near future. Commercial real estate is stronger than residential, but commercial has some big hurdles to overcome in the next two years with a large amount of debt maturing while interest rates remain high.
- We have experienced a softening of incoming contracts over the past two months. Our business is consulting engineering. Clients are still requesting proposals, but they have slowed down in awarding projects.
- Some long-held contracts are finally being launched.
- General business activity has stalled. This isn't in itself unusual, but the coincidental occurrence across many different clients/industries is highly unusual and is concerning.
- Tariff psychosis in Washington continues. One day the commercial real estate and construction industry will be able to make decisions based upon settled policy rather than what's happening these days.
- Things are still uncertain due to tariff flip-flops but less uncertain than three months ago. [We have] greater confidence things will sort themselves out.
- We are still seeing the time from a proposal being written to a job being awarded get longer. It seems like our clients are more cautious than last year.
- Demand for software solutions from government agencies continues. However, uncertainty about execution timing and pricing also continues. The current administration's focus on eliminating our primary market—renewable power—is really hurting us.
- We are starting to see negative impact from the macroeconomic and political risks we've been tracking since the beginning of the year. The confluence of high rates—which constrain capital spending—the impact of tariffs and labor strains is impacting customers and reducing their buying appetite. Reductions in federal spending removing dollars from our government business unit are finally starting to hinder our ability to maintain revenue and expand profitability. Many companies may not be able to endure this quadruple threat. Looking ahead, we have concerns about the durability of the U.S. economy.
- Things that have been in the works since January 2025 have finally paid off in the month of July.
- Tariffs beginning Aug. 1 will create uncertainty. It’s difficult to know how soon it will impact consumers, who will then reduce their discretionary spending for services such as ours.
- High interest rates continue to slow homebuying. The terrible flood in the Hill Country also slowed buying homes down. It touched a lot of families around our offices and psychologically affected their desire to buy. July is a slow month because buyers take vacations.
- Residents and contractors with legal status issues who have been working hard and minding their business for years are suddenly terrified of the goon squads roaming neighborhoods looking to make their bust quotas. They are quitting, hiding, avoiding activities and places they used to frequent and refusing to travel. Not sure how this is helping public safety or our economy. It is certainly causing disruption, increasing costs and adding pointless challenges for our business.
- Turmoil around the tariff issue caused by our leadership constantly threatening and moving the goalposts is impacting decision-making by our customers.
- As a heavy machinery distributor, we really expected things to bust loose with the One Big Beautiful Bill and the reinstatement of 100 percent bonus depreciation. However, both actions have not yet impacted our sales or customers’ readiness to invest in new equipment.
- Moisture has helped agriculture, travel has rebounded, but concern about ICE raids is harming workforce participation.
- The labor market is still in a period of ebb and flow. A strong month is followed by a weak one. The general tone is that the market is soft and, outside of a couple of outlier months, this year feels recessionary.
- We are concerned about cuts in government spending.
- In our industrial development company, we have had more inquiries than normal.
- Recent economic data seems to indicate we might miss the worst of a recession but softening demand in Asia for U.S.-produced energy is an offset. About the same as last month overall.
- Quoting activity and sales decreased in May and have remained depressed.
- Sales are down; prices are up. Margins are also down. Inventory has become delayed or canceled.
- We are worried about the impact of tariffs. We worry some patients may not take their medications if costs increase.
- Uncertainty is huge. Volatility of commodities prices is frightening, and tariffs are causing a rollercoaster.
- The tariffs put in place are still lingering in terms of being baked into future decisions. In other words, even though tariffs have been put in place, they are not fully realized in the marketplace. Some of the component costs are still going up as a result, so we are seeing minor increases in cost of goods sold. Beef prices are also going up because of multiyear factors (drought, feed cost, reduced herds, etc.) that are reaching a tipping point. As U.S. beef prices increase, it will hamper our ability to export beef products because we are being priced out of the international market.
- There continues to be softening in our general retail business. We are also seeing a reduction in repair services.
- We are starting to receive tariffed products, and the price increases are substantial.
- Expenses continue to increase. Insurance for our business is up 40 percent.
- [Our] industry will continue to experience a challenging environment. Uncertainty will continue for the remainder of the year. High inventories, high interest rates, shrinking margins and uncertainty suggest last half of year will likely result in declining profitability.
- The business environment in our region has slowed. We have fewer new customer installations than in recent years at this time of year. We have some residential rental property, and it takes much longer to rent out our properties. But still, business is good. I'd say that things have gone from great to just good.
- Cautiously optimistic that the economy will soften a little and allow the Federal Reserve to cut rates.
- Input prices continue to creep upwards, but our view is that this will be somewhat transitory with downward pressure offered up as tariffs are resolved over the next six months. We also have found some marginal room for price increases, which is providing some short-term margin relief. We remain optimistic and willing to suffer short-term margin loss to maintain market share and support long-term customer relationships and loyalty.
Special questions
For this month’s survey, Texas business executives were asked supplemental questions on labor market conditions. Results below include responses from participants of all three surveys: Texas Manufacturing Outlook Survey, Texas Service Sector Outlook Survey and Texas Retail Outlook Survey. View individual survey results.
Historical Data
Historical data can be downloaded dating back to January 2007.
Indexes
Download indexes for all indicators. For the definitions of all variables, see data definitions.
Texas Service Sector Outlook Survey |
Texas Retail Outlook Survey |
| Unadjusted | Unadjusted |
| Seasonally adjusted | Seasonally adjusted |
All Data
Download indexes and components of the indexes (percentage of respondents reporting increase, decrease, or no change). For the definitions of all variables, see data definitions.
Texas Service Sector Outlook Survey |
Texas Retail Outlook Survey |
| Unadjusted | Unadjusted |
| Seasonally adjusted | Seasonally adjusted |
Questions regarding the Texas Service Sector Outlook Survey can be addressed to Mariam Yousuf at mariam.yousuf@dal.frb.org.
Sign up for our email alert to be automatically notified as soon as the latest Texas Service Sector Outlook Survey is released on the web.