Texas Service Sector Activity Surges in March

Texas Service Sector Outlook Survey
Texas Service Sector Activity Surges in March
For this month’s survey, Texas business executives were asked supplemental questions on the impact of Winter Storm Uri and the lifting of state occupancy restrictions and mask mandates.. Results for these questions from the Texas Manufacturing Outlook Survey, Texas Service Sector Outlook Survey and Texas Retail Outlook Survey have been released together. Read the special questions results.
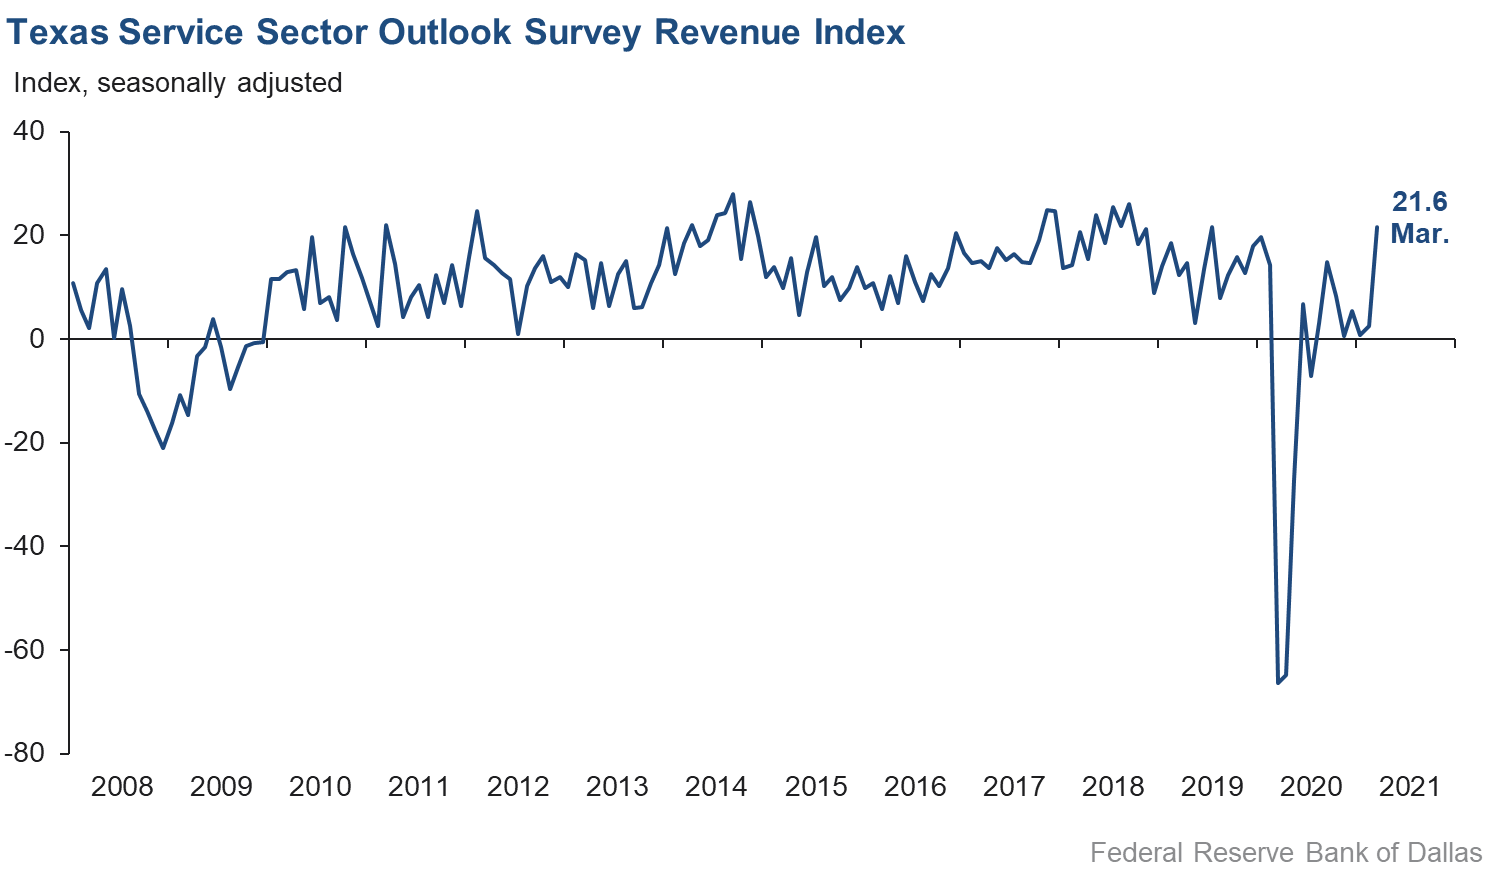
Activity in the Texas service sector in March increased at its fastest pace since mid-2019, according to business executives responding to the Texas Service Sector Outlook Survey. The revenue index, a key measure of state service sector conditions, surged from 2.6 in February to 21.6 in March.
Labor market indicators suggest significant gains in employment and longer workweeks in March. The employment index added over 10 points, rising to 13.1—its best reading since 2018—while the hours worked index rose five points to 8.3.
Perceptions of broader business conditions improved sharply compared with February. The general business activity index spiked from 5.0 to 28.9, a record high since the survey’s inception in 2007, while the company outlook index improved from 2.7 to 26.1. Over one-third of respondents noted an increase in their outlooks, compared with just 8 percent reporting a decrease. The outlook uncertainty index fell steeply to a record low of -10.0.
Price and wage pressures continued to rise in March. The selling prices index rose nearly three points to 12.1, while the input prices index rose two points to 26.5—both new highs since the beginning of the pandemic. The wages and benefits index increased from 12.5 to 19.9, with nearly one-quarter of firms noting increased labor costs compared with February.
Respondents’ expectations regarding future business activity reflected increased optimism this month. The future general business activity index increased to a record high of 42.4, while the future revenue index rose nine points to 55.0, with over 60 percent of businesses reporting expectations of increased revenues in the future. Other indexes of future service sector activity such as employment and capital expenditures also rose strongly, suggesting a surge in service sector growth over the next six months.

Texas Retail Outlook Survey
Texas Retail Sales Growth Rebounds to Six-Month High
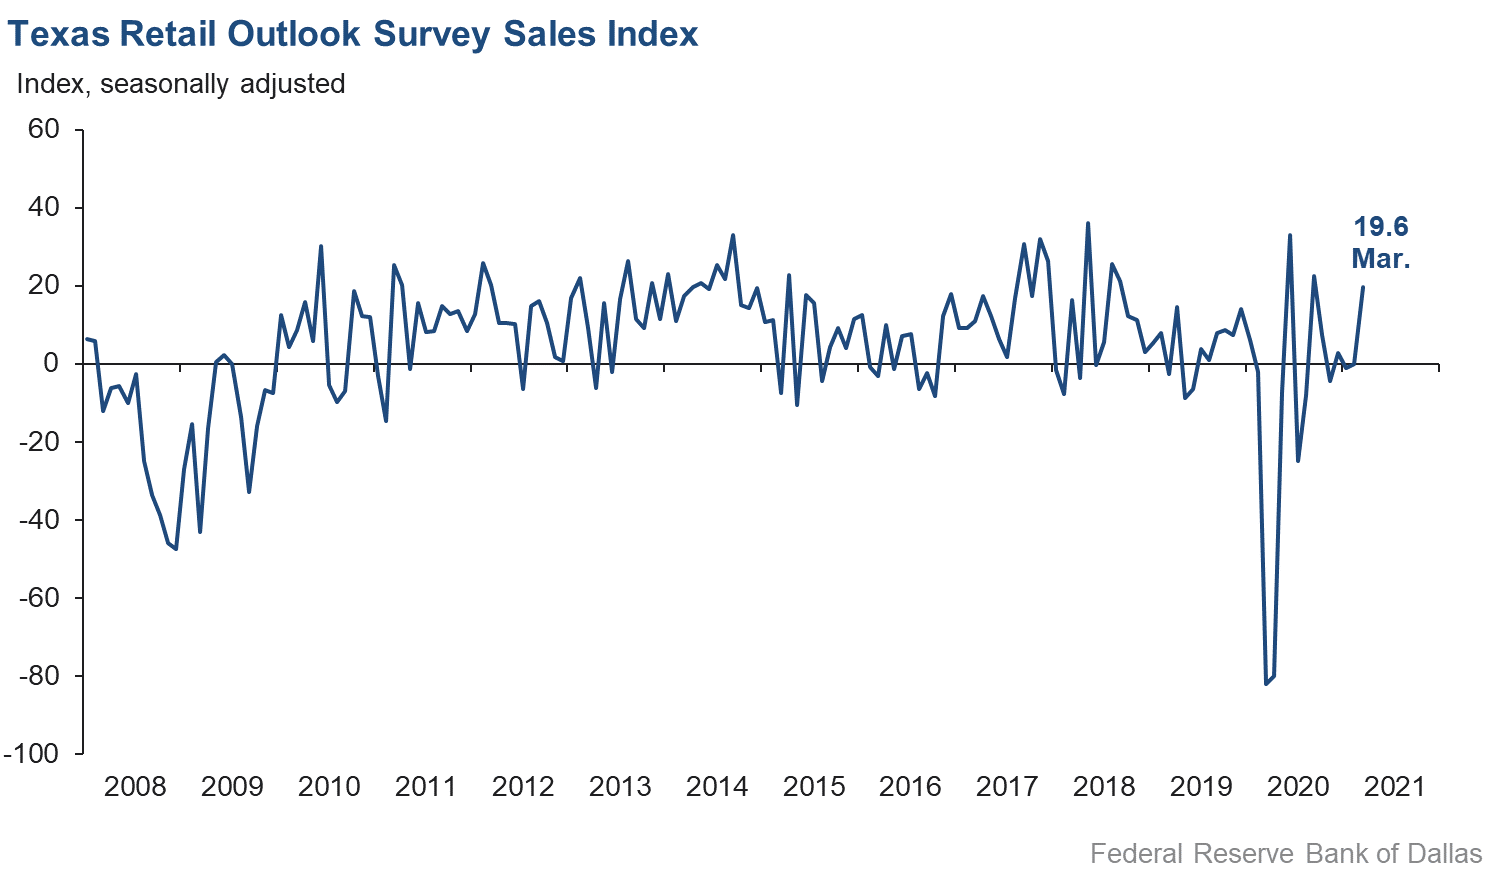
Retail sales activity picked up sharply in March, according to business executives responding to the Texas Retail Outlook Survey. The sales index, a key measure of state retail activity, rose from -0.1 in February to 19.6 in March, its highest level since last fall. Inventories posted a steep decline, with the inventories index falling from 2.1 to -14.8.
Retail labor market indicators improved, with notable growth in employment and a leveling off in average workweek length. The employment index climbed nearly seven points to 4.7, while the part-time index rose from -2.2 to 6.0. The hours worked index increased over 11 points to 0.9, suggesting little net change in employee hours worked.
Retailers’ perceptions of broader business conditions rebounded sharply into positive territory in March. The general business activity index logged its highest reading on record, rising from -3.5 to 35.2, while the company outlook index added over 40 points to reach 34.9. The outlook uncertainty index fell to a nine-month low of -9.3.
Retailers saw elevated price pressures and significant increases in wage pressures compared with February. The selling prices index slipped from 37.7 to 33.9, though it still remains near historical highs. The input prices index rose two points to 34.3, while the wages and benefits index increased nearly 15 points to 21.9.
Retailer optimism regarding future activity rose further in March. The future general business activity index increased 10 points to 40.8, while the future sales index rose to 46.4, its best reading since early 2017. Other indexes of future retail activity such as employment also increased sharply, pointing to expectations of robust retail activity going into the second half of the year.
The Texas Retail Outlook Survey is a component of the Texas Service Sector Outlook Survey that uses information only from respondents in the retail and wholesale sectors.
Next release: April 27, 2021
Data were collected March 16–24, and 226 Texas service sector and 55 retail sector business executives responded to the survey. The Dallas Fed conducts the Texas Service Sector Outlook Survey monthly to obtain a timely assessment of the state’s service sector activity. Firms are asked whether revenue, employment, prices, general business activity and other indicators increased, decreased or remained unchanged over the previous month.
Survey responses are used to calculate an index for each indicator. Each index is calculated by subtracting the percentage of respondents reporting a decrease from the percentage reporting an increase. When the share of firms reporting an increase exceeds the share reporting a decrease, the index will be greater than zero, suggesting the indicator has increased over the prior month. If the share of firms reporting a decrease exceeds the share reporting an increase, the index will be below zero, suggesting the indicator has decreased over the prior month. An index will be zero when the number of firms reporting an increase is equal to the number of firms reporting a decrease. Data have been seasonally adjusted as necessary.
Texas Service Sector Outlook Survey
Historical data are available from January 2007 to the most current release month.
| Business Indicators Relating to Facilities and Products in Texas Current (versus previous month) | ||||||||
| Indicator | Mar Index | Feb Index | Change | Series Average | Trend* | % Reporting Increase | % Reporting No Change | % Reporting Decrease |
Revenue | 21.6 | 2.6 | +19.0 | 10.7 | 8(+) | 37.1 | 47.4 | 15.5 |
Employment | 13.1 | 2.7 | +10.4 | 5.9 | 8(+) | 19.1 | 75.0 | 6.0 |
Part–Time Employment | 4.6 | 1.3 | +3.3 | 1.2 | 4(+) | 9.3 | 86.0 | 4.7 |
Hours Worked | 8.3 | 3.3 | +5.0 | 2.2 | 7(+) | 13.1 | 82.1 | 4.8 |
Wages and Benefits | 19.9 | 12.5 | +7.4 | 13.9 | 10(+) | 22.6 | 74.7 | 2.7 |
Input Prices | 26.5 | 24.4 | +2.1 | 24.8 | 11(+) | 28.3 | 69.9 | 1.8 |
Selling Prices | 12.1 | 9.4 | +2.7 | 5.1 | 8(+) | 18.4 | 75.3 | 6.3 |
Capital Expenditures | 9.4 | 7.0 | +2.4 | 9.5 | 7(+) | 13.6 | 82.2 | 4.2 |
| General Business Conditions Current (versus previous month) | ||||||||
| Indicator | Mar Index | Feb Index | Change | Series Average | Trend** | % Reporting Improved | % Reporting No Change | % Reporting Worsened |
Company Outlook | 26.1 | 2.7 | +23.4 | 5.0 | 8(+) | 34.2 | 57.7 | 8.1 |
General Business Activity | 28.9 | 5.0 | +23.9 | 2.8 | 2(+) | 36.4 | 56.1 | 7.5 |
| Indicator | Mar Index | Feb Index | Change | Series Average | Trend* | % Reporting Increase | % Reporting No Change | % Reporting Decrease |
Outlook Uncertainty† | –10.0 | 1.7 | –11.7 | 11.8 | 1(–) | null | null | null |
| Business Indicators Relating to Facilities and Products in Texas Future (six months ahead) | ||||||||
| Indicator | Mar Index | Feb Index | Change | Series Average | Trend* | % Reporting Increase | % Reporting No Change | % Reporting Decrease |
Revenue | 55.0 | 46.3 | +8.7 | 36.8 | 11(+) | 61.4 | 32.2 | 6.4 |
Employment | 35.2 | 28.8 | +6.4 | 21.7 | 11(+) | 40.1 | 55.0 | 4.9 |
Part–Time Employment | 14.3 | 6.3 | +8.0 | 6.4 | 10(+) | 18.8 | 76.7 | 4.5 |
Hours Worked | 14.3 | 6.7 | +7.6 | 5.5 | 11(+) | 17.4 | 79.5 | 3.1 |
Wages and Benefits | 43.8 | 33.5 | +10.3 | 35.6 | 11(+) | 46.2 | 51.4 | 2.4 |
Input Prices | 42.7 | 36.2 | +6.5 | 43.3 | 171(+) | 46.1 | 50.4 | 3.4 |
Selling Prices | 31.1 | 23.8 | +7.3 | 22.7 | 11(+) | 37.1 | 56.9 | 6.0 |
Capital Expenditures | 32.6 | 26.0 | +6.6 | 23.0 | 10(+) | 35.7 | 61.2 | 3.1 |
| General Business Conditions Future (six months ahead) | ||||||||
| Indicator | Mar Index | Feb Index | Change | Series Average | Trend** | % Reporting Improved | % Reporting No Change | % Reporting Worsened |
Company Outlook | 40.6 | 26.9 | +13.7 | 16.3 | 8(+) | 47.9 | 44.8 | 7.3 |
General Business Activity | 42.4 | 27.7 | +14.7 | 13.2 | 8(+) | 48.3 | 45.8 | 5.9 |
Historical data are available from January 2007 to the most current release month.
| Business Indicators Relating to Facilities and Products in Texas Retail (versus previous month) | ||||||||
| Indicator | Mar Index | Feb Index | Change | Series Average | Trend* | % Reporting Increase | % Reporting No Change | % Reporting Decrease |
| Retail Activity in Texas | ||||||||
Sales | 19.6 | –0.1 | +19.7 | 5.6 | 1(+) | 43.0 | 33.6 | 23.4 |
Employment | 4.7 | –2.0 | +6.7 | 1.7 | 1(+) | 11.6 | 81.5 | 6.9 |
Part–Time Employment | 6.0 | –2.2 | +8.2 | –2.1 | 1(+) | 12.5 | 81.0 | 6.5 |
Hours Worked | 0.9 | –10.3 | +11.2 | –2.1 | 1(+) | 10.9 | 79.1 | 10.0 |
Wages and Benefits | 21.9 | 7.1 | +14.8 | 9.1 | 8(+) | 26.6 | 68.7 | 4.7 |
Input Prices | 34.3 | 32.2 | +2.1 | 19.1 | 11(+) | 34.3 | 65.7 | 0.0 |
Selling Prices | 33.9 | 37.7 | –3.8 | 10.5 | 10(+) | 39.3 | 55.3 | 5.4 |
Capital Expenditures | 15.2 | 9.5 | +5.7 | 7.4 | 2(+) | 16.6 | 82.0 | 1.4 |
Inventories | –14.8 | 2.1 | –16.9 | 2.3 | 1(–) | 14.4 | 56.4 | 29.2 |
| Companywide Retail Activity | ||||||||
Companywide Sales | 19.7 | –3.5 | +23.2 | 7.0 | 1(+) | 42.0 | 35.6 | 22.3 |
Companywide Internet Sales | 13.9 | –3.9 | +17.8 | 6.1 | 1(+) | 25.2 | 63.5 | 11.3 |
| General Business Conditions, Retail Current (versus previous month) | ||||||||
| Indicator | Mar Index | Feb Index | Change | Series Average | Trend** | % Reporting Improved | % Reporting No Change | % Reporting Worsened |
Company Outlook | 34.9 | –6.8 | +41.7 | 3.4 | 1(+) | 42.3 | 50.3 | 7.4 |
General Business Activity | 35.2 | –3.5 | +38.7 | –0.8 | 1(+) | 43.3 | 48.7 | 8.1 |
| Outlook Uncertainty Current (versus previous month) | ||||||||
| Indicator | Mar Index | Feb Index | Change | Series Average | Trend* | % Reporting Increase | % Reporting No Change | % Reporting Decrease |
Outlook Uncertainty† | –9.3 | 4.3 | –13.6 | 9.3 | 1(–) | 18.5 | 53.7 | 27.8 |
| Business Indicators Relating to Facilities and Products in Texas, Retail Future (six months ahead) | ||||||||
| Indicator | Mar Index | Feb Index | Change | Series Average | Trend* | % Reporting Increase | % Reporting No Change | % Reporting Decrease |
| Retail Activity in Texas | ||||||||
Sales | 46.4 | 37.6 | +8.8 | 32.0 | 11(+) | 56.7 | 33.0 | 10.3 |
Employment | 32.5 | 16.5 | +16.0 | 12.0 | 11(+) | 34.1 | 64.3 | 1.6 |
Part–Time Employment | 16.1 | 8.9 | +7.2 | 0.8 | 8(+) | 20.5 | 75.1 | 4.4 |
Hours Worked | 9.3 | 0.5 | +8.8 | 2.7 | 11(+) | 13.5 | 82.3 | 4.2 |
Wages and Benefits | 42.7 | 35.6 | +7.1 | 27.2 | 11(+) | 44.9 | 52.8 | 2.2 |
Input Prices | 49.0 | 44.5 | +4.5 | 32.8 | 11(+) | 54.7 | 39.6 | 5.7 |
Selling Prices | 43.4 | 40.0 | +3.4 | 28.8 | 11(+) | 49.1 | 45.3 | 5.7 |
Capital Expenditures | 34.7 | 20.0 | +14.7 | 17.1 | 10(+) | 38.5 | 57.7 | 3.8 |
Inventories | 40.3 | 36.0 | +4.3 | 9.0 | 11(+) | 50.9 | 38.5 | 10.6 |
| Companywide Retail Activity | ||||||||
Companywide Sales | 51.0 | 34.4 | +16.6 | 30.6 | 11(+) | 59.2 | 32.6 | 8.2 |
Companywide Internet Sales | 47.5 | 33.3 | +14.2 | 22.0 | 12(+) | 50.0 | 47.5 | 2.5 |
| General Business Conditions, Retail Future (six months ahead) | ||||||||
| Indicator | Mar Index | Feb Index | Change | Series Average | Trend** | % Reporting Improved | % Reporting No Change | % Reporting Worsened |
Company Outlook | 48.1 | 38.7 | +9.4 | 17.1 | 11(+) | 51.1 | 45.9 | 3.0 |
General Business Activity | 40.8 | 30.6 | +10.2 | 12.8 | 8(+) | 45.4 | 50.0 | 4.6 |
*Shown is the number of consecutive months of expansion or contraction in the underlying indicator. Expansion is indicated by a positive index reading and denoted by a (+) in the table. Contraction is indicated by a negative index reading and denoted by a (–) in the table.
**Shown is the number of consecutive months of improvement or worsening in the underlying indicator. Improvement is indicated by a positive index reading and denoted by a (+) in the table. Worsening is indicated by a negative index reading and denoted by a (–) in the table.
†Added to survey in January 2018.
Data have been seasonally adjusted as necessary, with the exception of the outlook uncertainty index which does not yet have a sufficiently long time series to test for seasonality.
Texas Service Sector Outlook Survey
Texas Retail Outlook Survey
Texas Service Sector Outlook Survey
Comments from Survey Respondents
These comments are from respondents’ completed surveys and have been edited for publication.
- February was heavily impacted by [Winter Storm] Uri. Our six-month plan is cautiously optimistic, but many variables are still out there, including regulatory policy regarding fossil fuels (drilling activity, permitting, enforcement, etc.).
- Uncertainly has increased due to the fact that we desperately need employees and are not able to compete with all the free money and unemployment that the government is giving away. As a result, we are understaffed and at risk of losing existing staff to burnout.
- Fuel prices increasing is requiring higher tow pricing.
- The winter freeze had a significant impact on many of our customers, particularly for refined petroleum products. As a result, our shipments and revenues (and those of our customers) were down in February and remain depressed to some extent in March. We are continuing to evaluate but do expect this to be a temporary situation, thus there is no change in our medium-term outlook.
- We feel that the mask mandate being removed and restaurants being at 100 percent capacity are positives for business activity.
- Our client pool is increasingly concerned about the prospect for increasing cost of real estate capital at the long end. There is also growing concern about fiscal policy implications and the prospects for changes to the tax code impacting 2022 and perhaps even 2021 and how they could impact the commercial real estate market in the medium and long term—both directly as it relates to the demands of debt and equity capital, but also the future demand for space.
- We vend services (legal and software) in the residential mortgage industry —six months from now, who knows?
- Deposits are finally leveling out. The SBA PPP [Small Business Administration Paycheck Protection Program] loan program has slowed down as far as number of applications being processed but continues at a steady pace and will pick up in the near future once the second-draw PPP loans are able to be processed.
- Our markets were primarily in the oil and gas production industry. Enough said—no fracking, no drilling, no pipelines, etc.
- The labor market is increasingly tight. It is very difficult to find employees to work.
- The local economy is much improved. Retail sales and motel occupancy have improved markedly. Moisture helps agriculture.
- As a financial services company, we are impacted by broader economic and stock market conditions as well as benefits from stimulus and other governmental support efforts.
- We believe overall residential real estate market activity will plateau and perhaps worsen by the end of the year. This will be driven by rising prices from low inventories and rising mortgage rates. We are in both the residential resale and mortgage business. Mortgage volumes will also be impacted by higher rates and softness in the refinance market.
- Rising interest rates and increased construction materials costs are negative factors affecting the future outlook.
- Vaccines have definitely changed people's outlooks. They are more positive about the future.
- We are severely lacking entry-level workers even with starting pay north of $15 per hour and a $1,000 signing bonus. [There is] Too much government incentive to stay home.
- Thank God for the vaccines!
- The real estate market continues its recovery from the pandemic, with residential leading the way. Our commercial order count is continuing to climb, and the liability amounts of the orders are returning to prepandemic levels. Our only concern is the lack of inventory in the residential space.
- 2020 was a good year for us it turns out. 2021 is looking to be another good year. We are off to a good start.
- Oil prices will have to stay above $60 for a while (six months) before significant expenditures on projects will go forward. The greatest risk is the shale plays that will dump oil on the market and drive the price down. (This is a favorite action by Texas oil companies.)
- Effects of the February snowstorm caused a decrease in revenues as the office was closed, and remote working was hampered due to power loss.
- We had our second-best month in the past 15 months and were above pre-COVID levels.
- In general, business activity seems to have increased, but revenue is not yet reflecting this on a consistent basis.
- In the last 30 days, there was more optimism—thanks to vaccine distribution—about a return to "normalcy" this summer. That would allow our sales force to interface with prospects and replenish the pipeline, more than was safe [to do] in the past 12 months.
- We are experiencing a decrease in client partnerships at the moment, but the last week or so, we have received calls regarding possible contracts that lead us to believe we might end the year just slightly lower than last year. However, we ended the year lower than the year prior. Although we think things will bounce back, we don't anticipate them bouncing back as quickly as we would like or need to sustain our wages and benefits at the same level as in years past. Thank goodness for a strong operating reserve accumulated in recent years.
- Not sure why, but design/construction in distribution-type centers is growing at an alarming rate.
- [There are] Increased caution and related cost-cutting measures associated with increases in government spending that will ultimately cause increased corporate income tax rates, which will negatively impact earnings.
- We are in desperate need of employees. If the government is going to pay people to stay at home, they will stay at home. This whole deal about a recession is not true. What is true is that you will not get to full employment until they stop with $1,400 checks and unlimited unemployment benefits. I don't know of one business that is not seeking employees. This is going to cause inflation, and it might just get out of control.
- Inactive clients have begun to reach out and reconnect to discuss future hiring plans. Clients with high levels of in-office or face-to-face products or services are becoming active again and engaging in conversations around their workforce planning.
- The corporate aviation sector has increased its utilization, and that has increased the inspection time cycles—a positive for us. Airline activity has increased, with more cargo operators submitting 19 percent more RFQs [requests for quotation] since January. We are projecting this segment to increase. The industrial sector has increased 11 percent from January overall. Oil transportation (transport tanks, valves, etc.) equipment manufacturing has been seen the biggest increase with 4.3 percent since January. Rig safety equipment manufacturing (choke and kill systems) is at 0.7 percent. Machining operations have increased 6 percent since January. We expect this segment to increase the most in the next six months, due to part replacements for current operating machines. Military operations are increasing for RFQ, but due to COVID-19 restrictions at bases, scheduling, travel and on-site completions will be a major challenge. We are asking and hoping for a way to have vaccinated people who travel on business be allowed some type of passport or travel document available to access countries and sites that we and our customers need to be accessed for the required work.
- The longer we get from the March 2020 correction, the effect of COVID-19 virus and emergence of vaccines, the more economic factors improve and confidence improves.
- Answering the questions about increases in sales can be misleading. We are working our way back to the sales levels we had a year ago, so these are not true sales increases.
- Passage of the most recent COVID-19 funding bill will provide direct relief that improves our circumstances and outlook.
- I am very concerned about the inflationary aspect of printing money for consumption (i.e., stimulus, infrastructure down the road). I already see increases in gas prices year over year, which immediately affects our employees' discretionary income. Over the long term, we will have inflationary problems that will be hard to control with the current Federal Reserve tool chest. COVID-19 concerns persist; I just returned from spring break in the panhandle of Florida. I saw many fellow citizens wearing no mask; knowing the U.K. variant spreads faster and is more lethal make for more concerns; another shutdown would bend our economy to a breaking point.
- The general perception of COVID behind us is not shared in the health care community. COVID recovery is a challenge to many patients, and the COVID variance in addition to lifting of mask, travel and business attendance requirements opens the door for a possible increase of COVID in the third and fourth quarter as well. That will take us a step back instead of forward. Due to COVID restrictions, there has been a significant drop in patients visiting their doctors unless it’s an emergency. This has a cascading effect on all of the health care providers, as the entire model depends on directing the patients to qualified and appropriate services. Whenever the primary care (internal medicine and family medicine) visits pick up, then the health care industry will start regaining its business volumes. Until then, it will be a long and slow growth in the next two quarters.
- Increased activity occurred with Gov. Abbott's announcement to discontinue mandatory masking.
- The impact of the stimulus check on sales was immediate and material.
- Assuming the governor's edict to return to 100 percent normal business holds, we expect to see business continue to improve.
- Glad to see business opening back up, but deleting the mask mandate was irresponsible. We are seeing travel picking up. We are hoping for group business in hotels to continue to increase.
- In San Antonio, we have seen a surge in leisure travel during the spring break weeks. In addition, we have secured the NCAA women's basketball tournament for three to four weeks. That being said, this weekend we were crushed with too many guests and not enough team members. We have been actively looking for new team members—difficult to find. Everyone is speculating the new stimulus bill has something to do with the lack of applicants. Going forward six months, we have been anticipating stronger business during the summer months and have forecasted accordingly. The past week, we feel we got a taste of what we will be seeing this coming summer.
- We are worried about Congress and the Biden administration implementing policies that hurt small business.
- We have avoided layoffs for now due to receipt of a second PPP loan.
- Presidential executive orders have hurt our business more than COVID-19 ever did.
- In the first two months of 2021, we have seen unprecedented price increases from our suppliers, causing us to raise pricing. Inflation is a concern of ours as well as a potential Biden tax increase. If we are unable to pass along all the price increases, or if we are faced with an income tax rate increase, we will be forced to cut capital spending and possibly evaluate employment levels.
- February was devastating. We are hoping to recover.
- The company closed the office, and only a few engineers are working from home. No sales or any other purchasing activities are [being] done, just professional engineering support.
- The sooner dining rooms open, the sooner we get back to "normal."
- Parts and component availability are becoming serious issues. Basically, the entire supply chain seems screwed up.
- We are still short of the necessary inventory.
- In addition to improved general business conditions, management changes over the last 12 months have also contributed to our increase in sales. Also, our service revenue on a percentage-of-increase basis is outpacing vehicle sales.
- Current supply chain problems related to processor chip shortages have caused new-vehicle production decreases and, in return, it's driving up used-vehicle prices.
- The [sale] of the business will be complete in April.
- New-vehicle inventories remain low, as parts availability remains an issue.
- There are too many issues facing our OEMs [original equipment manufacturers] to have stability in the distribution system. Inventory levels will be a problem for the first half of the year, then we will see what happens. Winter storms killed February!
- The major snowstorm in February took the wind out of our sails. We are experiencing a strong recovery. Order files are high, but the continued cost increases in all building materials, not just forest products, may lead to delays in starting new jobs.
- Steel is in shorter supply in March than it was in February. We have multiple projects that are unable to ship due to the fact that vendors are unable to supply critical material. Steel prices have doubled since September 2020.
Historical Data
Historical data can be downloaded dating back to January 2007.
Indexes
Download indexes for all indicators. For the definitions of all variables, see Data Definitions.
Texas Service Sector Outlook Survey |
Texas Retail Outlook Survey |
| Unadjusted | Unadjusted |
| Seasonally adjusted | Seasonally adjusted |
All Data
Download indexes and components of the indexes (percentage of respondents reporting increase, decrease, or no change). For the definitions of all variables, see Data Definitions.
Texas Service Sector Outlook Survey |
Texas Retail Outlook Survey |
| Unadjusted | Unadjusted |
| Seasonally adjusted | Seasonally adjusted |
Questions regarding the Texas Service Sector Outlook Survey can be addressed to Christopher Slijk at christopher.slijk@dal.frb.org.
Sign up for our email alert to be automatically notified as soon as the latest Texas Service Sector Outlook Survey is released on the web.