Texas Service Sector Growth Remains Robust

Texas Service Sector Outlook Survey
Texas Service Sector Growth Remains Robust
For this month’s survey, Texas business executives were asked supplemental questions on the labor market and price pressures. Results for these questions from the Texas Manufacturing Outlook Survey, Texas Service Sector Outlook Survey and Texas Retail Outlook Survey have been released together. Read the special questions results.
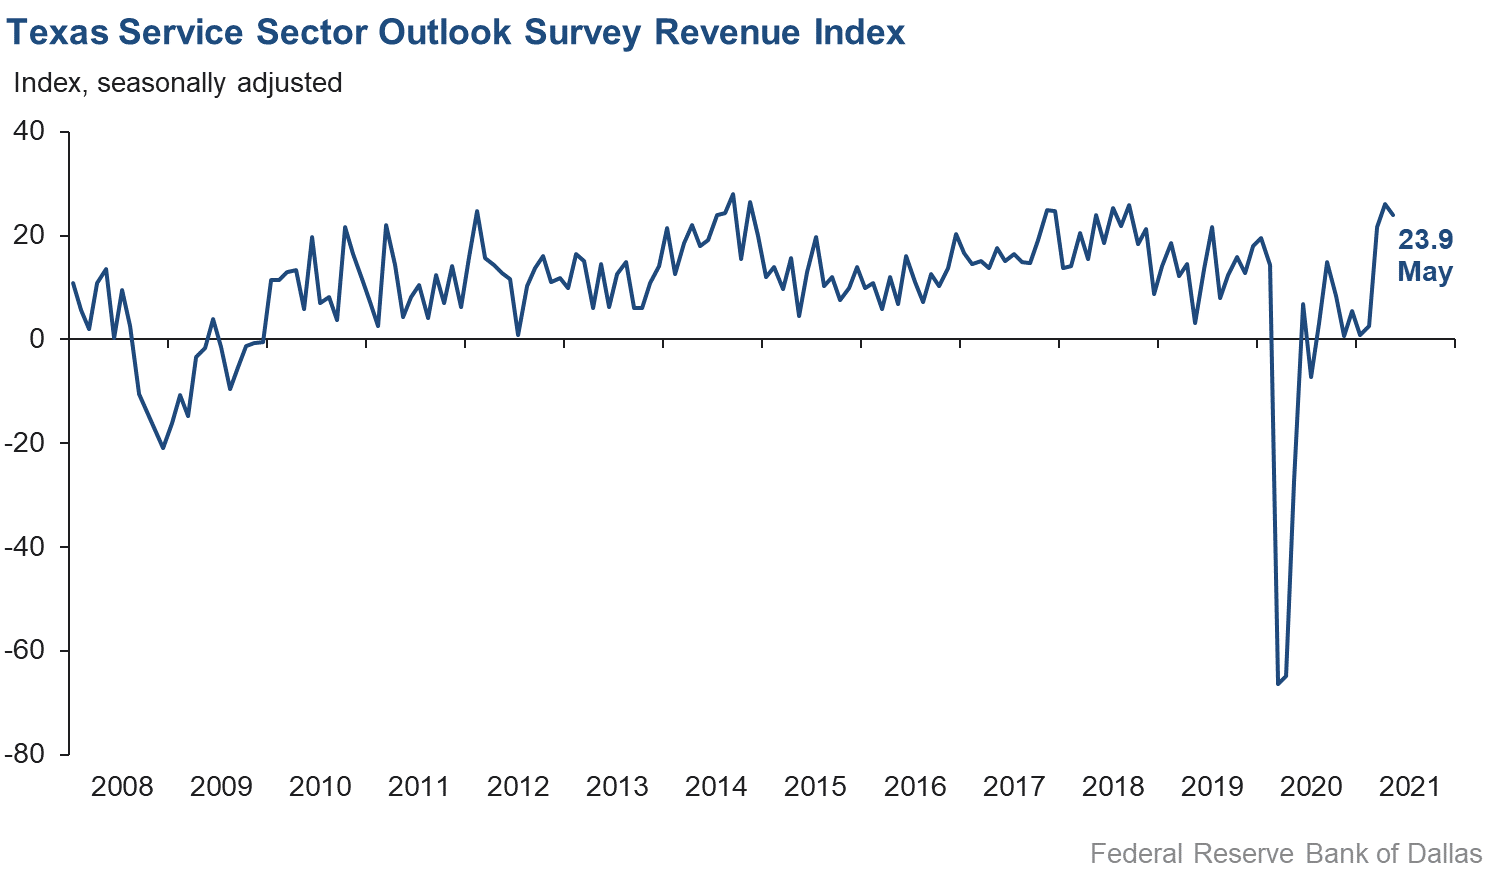
Activity in the Texas service sector continued to increase in May, though at a slightly reduced pace, according to business executives responding to the Texas Service Sector Outlook Survey. The revenue index, a key measure of state service sector conditions, slipped from 26.1 in April to 23.9 in May.
Labor market indicators suggest continued, though somewhat slower, growth in employment and hours worked in May. The employment index fell from 16.8 to 13.0, while the part-time employment index held roughly steady at 5.9. The hours worked index shed about two points to fall to 11.7 in May.
Perceptions of broader business conditions further improved compared with April. The general business activity index reached a new high of 40.0, with nearly half of all respondents reporting an increase in business activity in May. The company outlook index fell three points to 26.0, though it remains at a historically elevated level, while the capital expenditures index rose over six points to 17.2—its best reading since 2018. The outlook uncertainty index rose from -10.4 to -5.1, though its negative reading suggests a further net decrease in uncertainty.
Price and wage pressures continued to accelerate in May. The wages and benefits index increased from 21.5 to 26.9—an all-time high for the survey. The selling prices index similarly increased to an all-time high, rising from 18.6 to 23.5, while the input prices index surged over nine points to a 13-year high of 43.8.
Respondents’ expectations regarding future business activity reflected further optimism this month. The future general business activity index increased to a new record of 48.2, while the future revenue index held steady at 58.3. Strong positive readings in other future service sector activity indexes such as employment and capital expenditures point to robust growth over the next six months.

Texas Retail Outlook Survey
Texas Retail Sales Decline in May
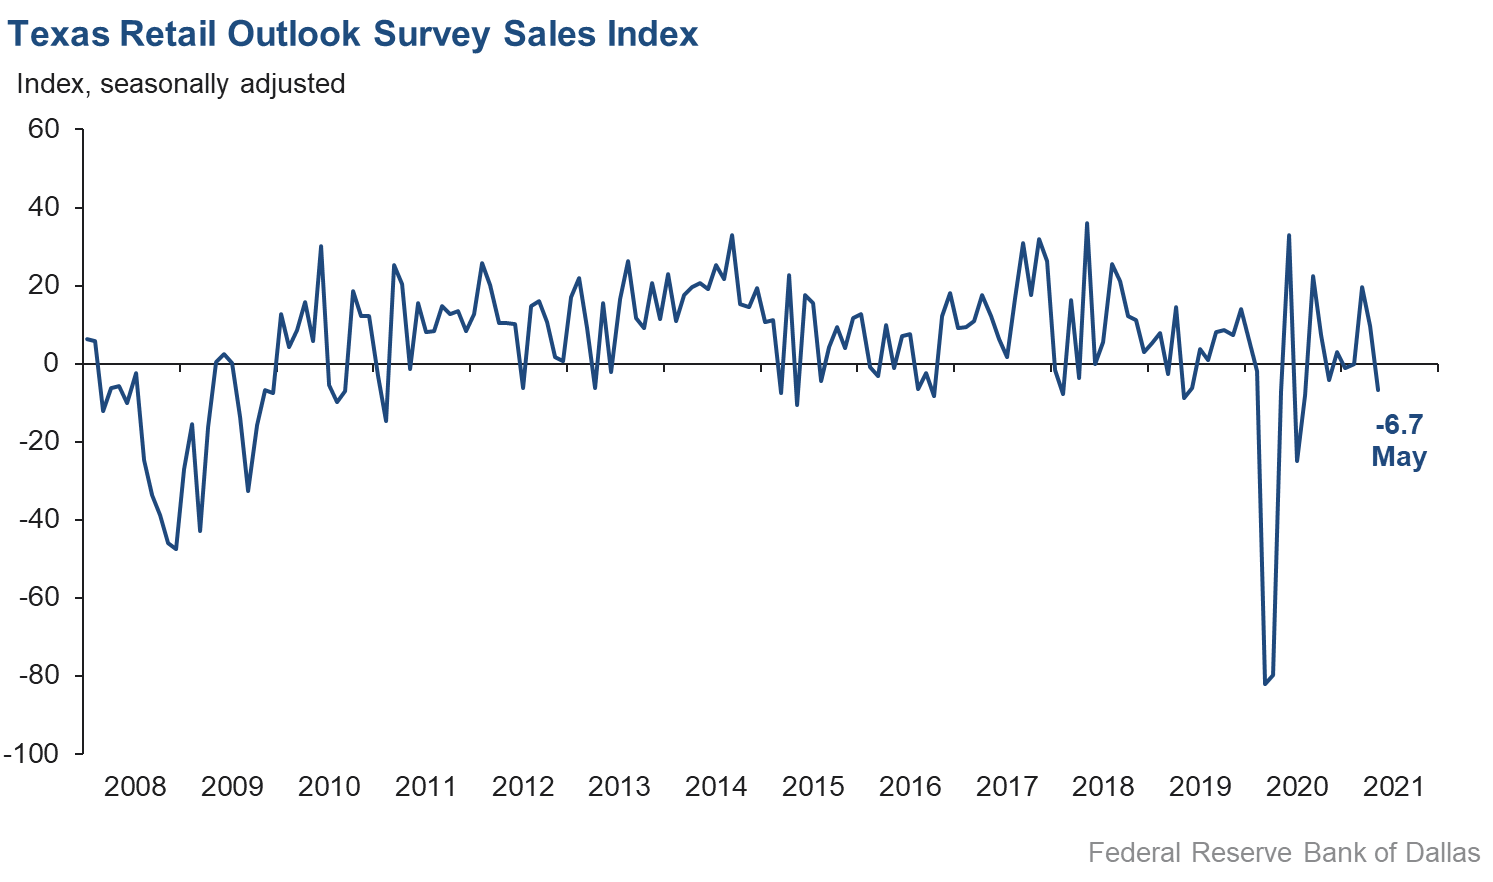
Retail sales activity fell in May, according to business executives responding to the Texas Retail Outlook Survey. The sales index, a key measure of state retail activity, declined from 9.7 in April to -6.7, its first negative reading since February. Inventories continued to decline, with the inventories index remaining negative, though increasing slightly from -14.8 to -11.0.
Retail labor market indicators were mixed in May, with continued growth in employment but little change in average workweek length. The employment index fell two points to 8.9, with the part-time employment index flat at 3.3. The hours worked index fell from 5.7 to 0.2, suggesting no net change in average hours worked.
Retailers’ perceptions of broader business conditions remained optimistic, though there was some softening in expectations compared with April. The general business activity index was roughly unchanged at 26.7, while the company outlook index declined over five points to 12.4. The outlook uncertainty index plunged from 4.1 to -18.8, suggesting a sharp decline in retailer uncertainty.
Retailers saw further acceleration of price pressures and elevated wage pressures in May. The selling prices index rose nearly six points to 46.2, and for the first time in the survey’s history, a majority of respondents reported increasing prices compared with the previous month. The input prices index increased four points to 52.6, while the wages and benefits index slipped slightly to 15.4.
Retailers continued to be optimistic in May regarding future activity. The future general business activity index declined six points to 36.0, while the future sales index gained nearly 11 points to reach an eight-year high of 57.7. Other indexes of future retail activity such as employment increased or remained elevated, pointing to expectations of robust retail activity through the rest of the year.
The Texas Retail Outlook Survey is a component of the Texas Service Sector Outlook Survey that uses information only from respondents in the retail and wholesale sectors.
Next release: June 29, 2021
Data were collected May 18–26, and 290 Texas service sector business executives, of which 54 were retailers, responded to the survey. The Dallas Fed conducts the Texas Service Sector Outlook Survey monthly to obtain a timely assessment of the state’s service sector activity. Firms are asked whether revenue, employment, prices, general business activity and other indicators increased, decreased or remained unchanged over the previous month.
Survey responses are used to calculate an index for each indicator. Each index is calculated by subtracting the percentage of respondents reporting a decrease from the percentage reporting an increase. When the share of firms reporting an increase exceeds the share reporting a decrease, the index will be greater than zero, suggesting the indicator has increased over the prior month. If the share of firms reporting a decrease exceeds the share reporting an increase, the index will be below zero, suggesting the indicator has decreased over the prior month. An index will be zero when the number of firms reporting an increase is equal to the number of firms reporting a decrease. Data have been seasonally adjusted as necessary.
Texas Service Sector Outlook Survey
Historical data are available from January 2007 to the most current release month.
| Business Indicators Relating to Facilities and Products in Texas Current (versus previous month) | ||||||||
| Indicator | May Index | Apr Index | Change | Series Average | Trend* | % Reporting Increase | % Reporting No Change | % Reporting Decrease |
Revenue | 23.9 | 26.1 | –2.2 | 10.9 | 10(+) | 41.8 | 40.3 | 17.9 |
Employment | 13.0 | 16.8 | –3.8 | 6.0 | 10(+) | 21.4 | 70.2 | 8.4 |
Part–Time Employment | 5.9 | 6.6 | –0.7 | 1.2 | 6(+) | 10.3 | 85.3 | 4.4 |
Hours Worked | 11.7 | 13.4 | –1.7 | 2.4 | 9(+) | 15.8 | 80.1 | 4.1 |
Wages and Benefits | 26.9 | 21.5 | +5.4 | 14.0 | 12(+) | 29.3 | 68.3 | 2.4 |
Input Prices | 43.8 | 34.3 | +9.5 | 25.0 | 13(+) | 46.8 | 50.2 | 3.0 |
Selling Prices | 23.5 | 18.6 | +4.9 | 5.3 | 10(+) | 27.7 | 68.1 | 4.2 |
Capital Expenditures | 17.2 | 10.5 | +6.7 | 9.6 | 9(+) | 21.1 | 75.0 | 3.9 |
| General Business Conditions Current (versus previous month) | ||||||||
| Indicator | May Index | Apr Index | Change | Series Average | Trend** | % Reporting Improved | % Reporting No Change | % Reporting Worsened |
Company Outlook | 26.0 | 29.2 | –3.2 | 5.2 | 10(+) | 38.4 | 49.2 | 12.4 |
General Business Activity | 40.0 | 34.9 | +5.1 | 3.2 | 4(+) | 47.9 | 44.1 | 7.9 |
| Indicator | May Index | Apr Index | Change | Series Average | Trend* | % Reporting Increase | % Reporting No Change | % Reporting Decrease |
Outlook Uncertainty† | –5.1 | –10.4 | +5.3 | 10.9 | 3(–) | 18.9 | 57.1 | 24.0 |
| Business Indicators Relating to Facilities and Products in Texas Future (six months ahead) | ||||||||
| Indicator | May Index | Apr Index | Change | Series Average | Trend* | % Reporting Increase | % Reporting No Change | % Reporting Decrease |
Revenue | 58.3 | 58.5 | –0.2 | 37.1 | 13(+) | 65.9 | 26.5 | 7.6 |
Employment | 40.2 | 41.6 | –1.4 | 21.9 | 13(+) | 44.4 | 51.4 | 4.2 |
Part–Time Employment | 16.4 | 15.0 | +1.4 | 6.5 | 12(+) | 19.9 | 76.6 | 3.5 |
Hours Worked | 14.9 | 17.2 | –2.3 | 5.6 | 13(+) | 18.4 | 78.1 | 3.5 |
Wages and Benefits | 50.4 | 46.1 | +4.3 | 35.8 | 13(+) | 51.2 | 48.0 | 0.8 |
Input Prices | 51.4 | 46.4 | +5.0 | 43.3 | 173(+) | 55.7 | 40.0 | 4.3 |
Selling Prices | 34.7 | 32.2 | +2.5 | 22.8 | 13(+) | 40.1 | 54.5 | 5.4 |
Capital Expenditures | 33.7 | 29.4 | +4.3 | 23.1 | 12(+) | 38.3 | 57.1 | 4.6 |
| General Business Conditions Future (six months ahead) | ||||||||
| Indicator | May Index | Apr Index | Change | Series Average | Trend** | % Reporting Improved | % Reporting No Change | % Reporting Worsened |
Company Outlook | 42.0 | 41.1 | +0.9 | 16.6 | 10(+) | 53.2 | 35.6 | 11.2 |
General Business Activity | 48.2 | 45.6 | +2.6 | 13.6 | 10(+) | 56.5 | 35.2 | 8.3 |
Historical data are available from January 2007 to the most current release month.
| Business Indicators Relating to Facilities and Products in Texas Retail (versus previous month) | ||||||||
| Indicator | May Index | Apr Index | Change | Series Average | Trend* | % Reporting Increase | % Reporting No Change | % Reporting Decrease |
| Retail Activity in Texas | ||||||||
Sales | –6.7 | 9.7 | –16.4 | 5.6 | 1(–) | 28.1 | 37.2 | 34.8 |
Employment | 8.9 | 10.9 | –2.0 | 1.8 | 3(+) | 13.6 | 81.7 | 4.7 |
Part–Time Employment | 3.3 | 3.9 | –0.6 | –2.0 | 3(+) | 9.1 | 85.1 | 5.8 |
Hours Worked | 0.2 | 5.7 | –5.5 | –2.0 | 3(+) | 10.8 | 78.6 | 10.6 |
Wages and Benefits | 15.4 | 17.1 | –1.7 | 9.2 | 10(+) | 23.6 | 68.2 | 8.2 |
Input Prices | 52.6 | 48.4 | +4.2 | 19.5 | 13(+) | 57.2 | 38.2 | 4.6 |
Selling Prices | 46.2 | 40.4 | +5.8 | 10.9 | 12(+) | 52.6 | 41.0 | 6.4 |
Capital Expenditures | 15.7 | 2.8 | +12.9 | 7.4 | 4(+) | 20.3 | 75.1 | 4.6 |
Inventories | –11.0 | –14.8 | +3.8 | 2.2 | 3(–) | 24.4 | 40.2 | 35.4 |
| Companywide Retail Activity | ||||||||
Companywide Sales | 1.4 | 8.0 | –6.6 | 7.0 | 3(+) | 35.8 | 29.8 | 34.4 |
Companywide Internet Sales | –2.4 | 2.5 | –4.9 | 6.0 | 1(–) | 19.6 | 58.4 | 22.0 |
| General Business Conditions, Retail Current (versus previous month) | ||||||||
| Indicator | May Index | Apr Index | Change | Series Average | Trend** | % Reporting Improved | % Reporting No Change | % Reporting Worsened |
Company Outlook | 12.4 | 17.8 | –5.4 | 3.6 | 3(+) | 35.2 | 42.0 | 22.8 |
General Business Activity | 26.7 | 27.8 | –1.1 | –0.4 | 3(+) | 38.9 | 49.0 | 12.2 |
| Outlook Uncertainty Current (versus previous month) | ||||||||
| Indicator | May Index | Apr Index | Change | Series Average | Trend* | % Reporting Increase | % Reporting No Change | % Reporting Decrease |
Outlook Uncertainty† | –18.8 | 4.1 | –22.9 | 8.5 | 1(–) | 18.9 | 43.4 | 37.7 |
| Business Indicators Relating to Facilities and Products in Texas, Retail Future (six months ahead) | ||||||||
| Indicator | May Index | Apr Index | Change | Series Average | Trend* | % Reporting Increase | % Reporting No Change | % Reporting Decrease |
| Retail Activity in Texas | ||||||||
Sales | 57.7 | 46.9 | +10.8 | 32.3 | 13(+) | 66.9 | 23.9 | 9.2 |
Employment | 37.2 | 33.6 | +3.6 | 12.3 | 13(+) | 40.4 | 56.5 | 3.2 |
Part–Time Employment | 12.7 | 15.9 | –3.2 | 1.0 | 10(+) | 14.6 | 83.5 | 1.9 |
Hours Worked | 10.0 | 11.7 | –1.7 | 2.7 | 13(+) | 16.4 | 77.2 | 6.4 |
Wages and Benefits | 50.4 | 41.4 | +9.0 | 27.4 | 13(+) | 50.6 | 49.2 | 0.2 |
Input Prices | 51.9 | 59.6 | –7.7 | 33.0 | 13(+) | 61.5 | 28.8 | 9.6 |
Selling Prices | 36.6 | 48.9 | –12.3 | 29.0 | 13(+) | 48.1 | 40.4 | 11.5 |
Capital Expenditures | 25.5 | 34.0 | –8.5 | 17.3 | 12(+) | 33.3 | 58.8 | 7.8 |
Inventories | 47.5 | 41.5 | +6.0 | 9.4 | 13(+) | 55.7 | 36.1 | 8.2 |
| Companywide Retail Activity | ||||||||
Companywide Sales | 50.1 | 41.8 | +8.3 | 30.7 | 13(+) | 61.7 | 26.7 | 11.6 |
Companywide Internet Sales | 32.5 | 33.3 | –0.8 | 22.2 | 14(+) | 42.5 | 47.5 | 10.0 |
| General Business Conditions, Retail Future (six months ahead) | ||||||||
| Indicator | May Index | Apr Index | Change | Series Average | Trend** | % Reporting Improved | % Reporting No Change | % Reporting Worsened |
Company Outlook | 41.6 | 32.6 | +9.0 | 17.3 | 13(+) | 56.5 | 28.6 | 14.9 |
General Business Activity | 36.0 | 42.0 | –6.0 | 13.1 | 10(+) | 47.6 | 40.7 | 11.6 |
*Shown is the number of consecutive months of expansion or contraction in the underlying indicator. Expansion is indicated by a positive index reading and denoted by a (+) in the table. Contraction is indicated by a negative index reading and denoted by a (–) in the table.
**Shown is the number of consecutive months of improvement or worsening in the underlying indicator. Improvement is indicated by a positive index reading and denoted by a (+) in the table. Worsening is indicated by a negative index reading and denoted by a (–) in the table.
†Added to survey in January 2018.
Data have been seasonally adjusted as necessary, with the exception of the outlook uncertainty index which does not yet have a sufficiently long time series to test for seasonality.
Texas Service Sector Outlook Survey
Texas Retail Outlook Survey
Texas Service Sector Outlook Survey
Comments from Survey Respondents
These comments are from respondents’ completed surveys and have been edited for publication.
- [There is] a lot of hiring activity and spending in the marketplace.
- We cannot locate any new employees. Costs for many of our supplies continue to increase.
- Conditions are slightly better but dependent on global energy demand.
- [We are monitoring the] Mexico elections. We are a binational company, and the ongoing elections in Mexico slow every new project.
- We need tort law reform for the transportation industry. Truckers are targeted by those wishing to make a claim against our liability insurance. Insurance industry rates have increased by over 100 percent in the last five years (including mine).
- We are cautiously optimistic that we are seeing a return to prepandemic levels of business activity in the region and are seeing an uptick in crude [oil] exports and shipments of refined travel fuels.
- We are experiencing backlogs and delays obtaining necessary materials and supplies. Specifically, our manufacturers that provide electronic devices/equipment essential to provisioning broadband data services to customers (residential and commercial) have significantly lower inventories and are tightly controlling the allocation to suppliers. They have signaled it will be constrained for the next six months due to chip shortages. Further cost pressure is expected as we are also seeing a delay from other manufacturers in obtaining specific plastic components (pedestals) that serve as housing for fiber splices. We are also being told that there is a shortage of plastic resin due to the impact of [Winter Storm] Uri to Texas manufacturers' facilities.
- We are seeing increasing interest and activity on the part of our client base relative to their interest in financing commercial property. The reasons given are improving overall business conditions and their expectation of a higher interest rate environment ahead. We also see an increase in requests for longer-maturity loans and loans that will fully amortize within the loan term.
- [Our issues stem from] 1) workforce availability/cost, 2) pricing increases and availability for materials impacting our clients’ growth and 3) significant market liquidity holding pricing down.
- Used car prices are having an impact.
- We have growing concern about government intervention and extended government stimulus causing low productivity and/or increased inflation. Government debt will result in increased taxes across the board over the long term to pay increased interest payments as interest rates rise. Fiscal policy has run amuck. A housing bubble due to the low-interest-rate environment probably will create pain in the housing and financial markets.
- The employment market is crazy. We’re having employees taken out of our office, and replacing them is difficult.
- The political climate is a big concern for most businesses. The talk is of increased regulation, increased taxes and out-of-control immigration. Liquidity is at an all-time high and interest margins are very narrow. The fee income of most banks that participated in the PPP [Paycheck Protection Program] will help keep revenues elevated this year as PPP loans are forgiven. The outlook for 2021 will be different, I anticipate, and banks will need to prepare for this with new products, partnerships increased loan volume and controlled expenses.
- The regulatory environment is getting worse in our industry.
- As a financial services company, we are sensitive to market conditions and economic changes. Within Texas, business and client optimism seem to be improving.
- Cost and availability of labor and materials for both our tenant finish-out of existing commercial properties and for new construction have increased and exceeded the increase in net rents, resulting in lower returns on equity. This has been partially offset by a lower cost of financing but only for properties where the existing debt is open to early prepayment without a substantial penalty.
- We continue to see a very tight labor market. There is increased awareness from customers on cost control and salary pressure from current employees.
- Being a real estate company, our concern continues to be a shortage of homes to sell.
- Costs of materials in construction are, of course, a huge challenge. The demand for our buildings, offices, industrial and multifamily continues to grow, so we are caught in the pressure of increasing demand and costs while not wanting to increase rents. Low interest rates may yet bail us out again but, if not, rents will increase.
- We are thankful for suspension of the mask mandate.
- Most of us are not economists, but it does not make sense that the Fed [Federal Reserve] can keep printing money to chase fewer products. Supply lines are already delivering in second quarter 2022 in our industry, and we can only get about half the product we need. We do not see how we do not return to Jimmy Carter economics ... that is the uncertainty. When the cost of funds exceeds the return we can make on what we sell is when the cards tumble. The current administration has been in office four months, and we already have war in the Middle East for the first time in four years. Taxes on family-owned small businesses are going to take every dime of cash we produce to grow with and reinvest in our company. I have never felt worse or more uncertain about the future of our family-owned business or our country—or world.
- In our 40th year in business, we just set a record last month for activity. This is occurring without some of our service sectors (hotel, retail) being back in the market.
- Never in my 23 years has it been this difficult to find labor. The federal government has got to stop paying people to stay home in areas that are fully open like ours.
- Our business began coming back in February after COVID-19. We are now realizing the backlog of work and are busier than we have been in at least three to four years. We expect this lever to continue through 2022 as courts catch up from the COVID backlog of cases.
- Construction material costs have increased over the previous month, especially lumber. This appears to have more impact on residential construction than on ongoing commercial construction. Architecture and engineering firms are very busy right now, and that will generate work for commercial/institutional construction within six to 12 months. We’re still experiencing a shortage of qualified and experienced professionals in the architecture industry.
- Growth and business expansion have been curtailed by the lack of available skilled and unskilled workers. We also have been restrained by the lack of available pickup trucks. Currently, we cannot hire even trained technicians because trucks are back-ordered for three months. The current starting salary for unskilled labor is $16 an hour, raising to $18 an hour after three months. Benefits include paid insurance, vacation and sick leave, 401k and cash bonuses.
- Finding employees has been hard. I have two office positions available and only had one person apply. I emailed 8–10 people after searching through resumes, and only one person replied. No one wants to work when they can make more money on unemployment.
- It’s been tough to obtain and maintain qualified talent. The talent pool seems to have diminished, and the applicants want more money but are less effective at the job.
- The most recent issue is reopening the office. Many employees do not want to return to the office. Many people want a hybrid work schedule.
- The real estate market is on fire. We are hearing that new-home builders have stopped selling homes in some of their subdivisions due to not being able to build houses fast enough to meet the demand. Existing homes are being sold for way more than the asking price, interest rates remain low and we are still seeing a tremendous amount of migration into our state. It’s a perfect storm for residential real estate. The commercial market has heated up as well. As the new administration continues to talk about tax increases, capital gains increases and doing away with 1031s [tax-deferred real estate exchanges], we are seeing a selling frenzy like never before. Although this looks good now, we are very concerned about the future of this market if capital gains are increased to the level of ordinary income and 1031s are no longer allowed.
- We have seen good activity in the last couple months, in part due to a large amount of litigation, regulatory and lobby work centered around the [February] winter storm events.
- We have seen slow but steady improvement month over month in work flowing from our clients.
- Since we are part of the automotive supply chain, the chip shortage crisis is affecting our operations, given that the OEMs [original equipment manufacturers] have been having stoppages.
- Uncertainty in corporate income tax rates as well as capital gains tax rates is a greater concern. Inflation concerns and related continued government spending, plus the related negative impact on workforce/jobs, create concerns about an increasing cost of labor in the business sector.
- Labor is the biggest issue. There is none available.
- Confusion reigns supreme for international travel, and the luxury traveler continues to have anxiety toward future commitments. This will give domestic travel at the luxury end reason to [go up in price to] levels where many travelers are priced out of the market.
- There is a lot of uncertainty and planning around a potential tax increase coming later this year or early next year.
- All sectors of our business activities have increased except the heavy oil industry market. We see no increase in this area for the foreseeable future. The biggest problem is the age-old practice of large MROs [maintenance, repair and operations] securing a government contract and then pilfering our trained technicians with big promises that will not come true once their contract ends. leaving us shorthanded and having to start the rehire/training process over again and again. I am beginning to think we are a AAA ball club for the majors ... and we do not even get a ball cap.
- Similar to the demand for labor in manufacturing and hospitality, the demand for labor in the services sector is high. Finding qualified talent is challenging and preventing a full realization of growth. We have begun looking more intently at talent outside North Texas, either to work remotely or for relocation.
- Inflation remains a concern of mine, and it affects the general level of business activity. I am concerned about the additional unemployment benefits and the effect on hiring.
- We remain concerned about the decision to remove most COVID-19 protocols for those who are vaccinated, with no way to know who actually is vaccinated. This makes some employees uncomfortable about returning to a face-to-face environment and appears to increase the risk of a new rise in variants/caseloads, at least somewhat.
- The republic of Texas is essentially and finally mask-free. There’s much focus on rising tax rates. [We are seeing] federal, state and local debates. Businesses are crushed with delayed forgiveness of PPP [loans].
- There is more clarity in the business environment with the health care sector going back to the “normal” needs of the population. There is a general tendency of going back to some sort of normalcy, but we are not there yet. Every health care service entity—i.e., physicians, hospitals, LTACs [long-term acute care facilities], skilled nursing, home health and hospice—rounded their wagons during the pandemic and the usual patient flow came to a complete halt. This patient flow is now picking up, although very slowly, but it’s going in the right direction.
- The biggest questions for us right now: Is the current increase in volumes simply the result of pent-up demand from the COVID-19 period, or an indicator of a longer-term trend? Will current inflationary pressures be transitory or long-lasting?
- The cost of building materials and supplies, shortages of supplies, and gas price increases—in addition to a shortage of labor—have all negatively affected our community operations.
- We are concerned about inflation.
- The growth of our business is being tempered by the ability to hire workers.
- We cannot find workers. The unemployment benefits and stimulus have kept able-bodied people from working.
- Our top three problems, in order, are: 1. Need employees, 2. Need employees and 3. Need employees. We interview, some show for work. We train, most are gone in a week or less. We have never seen anything like this in my 40 years in the restaurant business. We are turning away business. We can’t compete with the government paying people not to work, I am told by employees.
- As the public is venturing out more with vaccinations, the uncertainty we have is a lack of employees and/or not a good selection to choose from. It is stressful because, although we want to meet the demands, I do not feel confident that we can provide the service we/customers expect. Now that Gov. Abbott will change the unemployment benefits for Texas come June 26, I anticipate a better workforce and then we will hopefully be better staffed. The cost of goods is still on the rise, but the consumer is bitter with price changes in our area, so we are hesitant to raise prices and are holding out through this month. We are relying heavily on the PPP and other monies to run business as normal, even though financially it doesn’t make sense to. We are still working through it.
- The major challenge our industry has right now is labor.
- We can’t find employees, and wages have exploded.
- May revenue is more sluggish due to the slow recovery of the oil and gas industry as well as the impact of substantial price increases and increased delivery times of products on projects. Historical price increases were received annually and were generally 2 to 4 percent. This year we are seeing price increases ranging from 3 to 15 percent and have already received multiple prices increases from several vendors. We believe 2021 will be a challenging year in terms of inflation and for the supply chain to return to a more normal, consistent basis.
- We simply don’t see the workforce coming back. At some point, we will all feel constrained.
- As COVID-19 restrictions get lifted and people eat out, our business will return to 2019 levels. We’ve added two new clients in the last six months, so our 2021 revenues will increase because of new business and a “return to normal.”
- The microchip shortage has severely impacted the automobile business. Overall, other supply-chain problems are also having a negative impact on our business.
- We have a lack of inventory. We have huge challenges with receiving sellable inventory because of distribution disruptions.
- Inventories are getting extremely low.
- New-vehicle inventories continue to decline, and our confidence in the manufacturers’ communication on production has declined. Used-car values continue to rise, giving us a pricing environment never experienced before. Through all of this, demand continues to be high.
- Our problem is the chip shortage and its effect on inventories. Our on-the-ground new-vehicle inventory at May 31 will be 79 units. Normal inventory would be 500–600 vehicles. Used unit inventory will be 214 units. Normal would be 350–400. Demand is strong but supply is limited and not expected to return to normal until 2022.
- The chip shortage is severely affecting our new-car inventory and putting price pressure like we have never seen before on used cars.
- Vehicle inventories are at all-time lows
- Inflation is in the high single digits, and we are having difficulty hiring workers at below $20 an hour.
- The microchip issue is serious. New-vehicle inventory is at the lowest level in recent history, and it will get worse in the coming months. The fourth quarter may show some improvement. This is very serious!
- We can’t find employees.
Historical Data
Historical data can be downloaded dating back to January 2007.
Indexes
Download indexes for all indicators. For the definitions of all variables, see Data Definitions.
Texas Service Sector Outlook Survey |
Texas Retail Outlook Survey |
| Unadjusted | Unadjusted |
| Seasonally adjusted | Seasonally adjusted |
All Data
Download indexes and components of the indexes (percentage of respondents reporting increase, decrease, or no change). For the definitions of all variables, see Data Definitions.
Texas Service Sector Outlook Survey |
Texas Retail Outlook Survey |
| Unadjusted | Unadjusted |
| Seasonally adjusted | Seasonally adjusted |
Questions regarding the Texas Service Sector Outlook Survey can be addressed to Christopher Slijk at christopher.slijk@dal.frb.org.
Sign up for our email alert to be automatically notified as soon as the latest Texas Service Sector Outlook Survey is released on the web.