June Texas Service Sector Growth Moderates

Texas Service Sector Outlook Survey
June Texas Service Sector Growth Moderates
For this month’s survey, Texas business executives were asked supplemental questions on supply-chain disruptions and difficulties in hiring or recalling workers. Results for these questions from the Texas Manufacturing Outlook Survey, Texas Service Sector Outlook Survey and Texas Retail Outlook Survey have been released together. Read the special questions results.
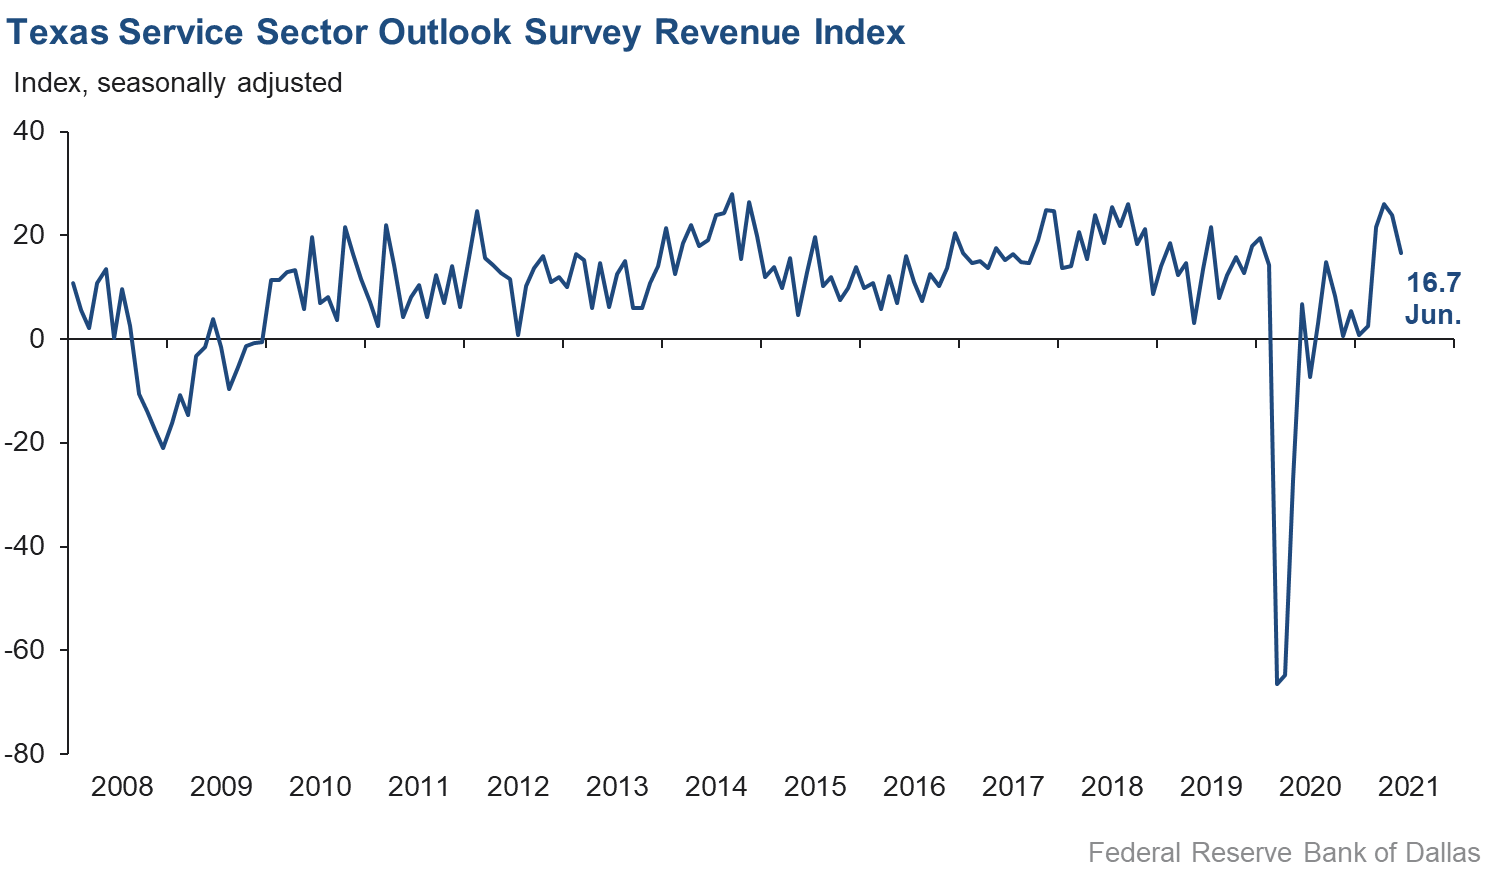
The pace of growth in the Texas service sector slowed in June, according to business executives responding to the Texas Service Sector Outlook Survey. The revenue index, a key measure of state service sector conditions, declined from 23.9 in May to 16.7 in June.
Labor market indicators suggest continued growth in employment and hours worked in June. The employment index slipped two points to 11.1, while the part-time employment index was roughly unchanged at 5.4. The hours worked index was also steady at 10.8, with about 15 percent of respondents noting increased hours, compared with about 4 percent reporting decreased hours.
Perceptions of broader business conditions remained positive, though slightly less optimistic than in May. The general business activity index fell four points from a record high to 36.2. The company outlook index fell from 26.0 to 21.7, though nearly 30 percent of respondents reported improved outlooks compared with last month. The capital expenditures index slipped nearly two points to 15.3, while the outlook uncertainty index rose nearly seven points to 1.5 after three consecutive months of negative readings.
Price and wage pressures further accelerated in June. The wages and benefits index rose from 26.9 to a record high of 31.4, with more than one-third of contacts increasing wages compared with May. The selling prices index increased five points to 28.6, a new all-time high, while the input prices index inched up one point to 44.9—its highest reading since 2008.
Respondents’ expectations regarding future business activity continued to reflect optimism going into the second half of the year. The future general business activity index fell from last month’s record reading of 48.2 to 43.0 in June, while the future revenue index shed four points to 54.5. Other future service sector activity indexes such as employment and capital expenditures dipped slightly but remained firmly positive.

Texas Retail Outlook Survey
Texas Retail Sales Slump Again in June
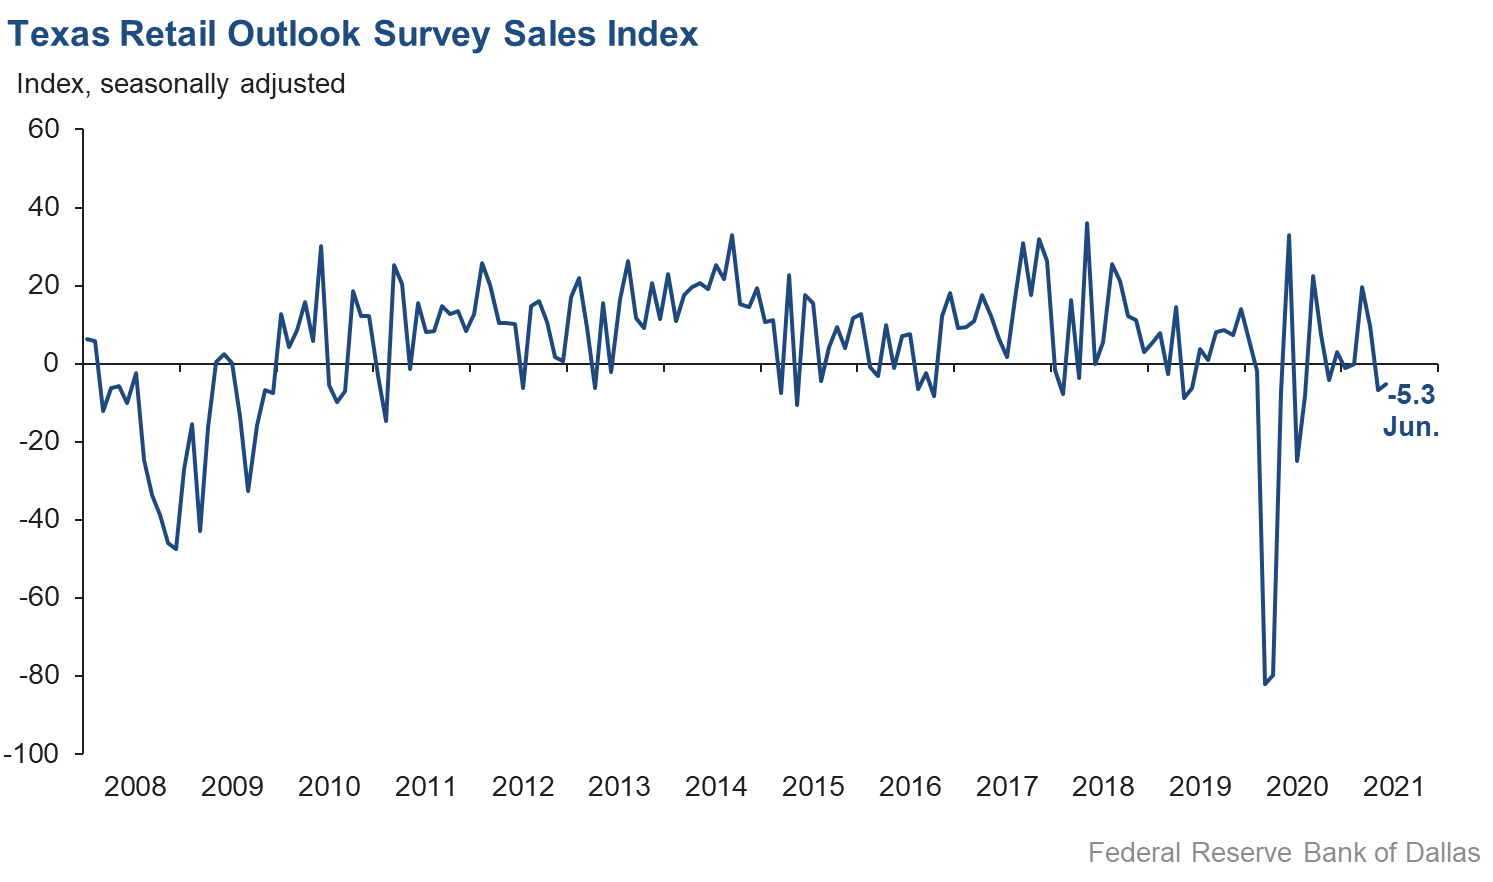
Retail sales activity fell for a second consecutive month in June, according to business executives responding to the Texas Retail Outlook Survey. The sales index, a key measure of state retail activity, increased one point but remained negative at -5.3 in June. Inventories continued to decline, with the inventories index falling to an 11-month low of -17.1.
Retail labor market indicators weakened in June, with employment flattening out and shortened average workweek length. The employment index plunged eight points to 0.9, suggesting little net change in employment compared with May. The hours worked index fell into negative territory for the first time since Winter Storm Uri, declining from 0.2 to -6.7.
Retailers’ perceptions of broader business conditions remained generally positive, though somewhat mixed compared with last month. The general business activity index rose from 26.7 to 30.9, with the share of firms reporting worsening activity falling from 12.2 percent in May to 6.2 percent in June. The company outlook index declined nearly seven points to 5.6, while the outlook uncertainty index surged from -18.8 to 8.7, suggesting a notable increase in retailer uncertainty.
Retailers saw continued increases in price and wage pressures in June. The selling prices index surged over 11 points to 57.4, with over 60 percent of firms reporting increased prices compared with the previous month. The input prices index increased nearly seven points to 59.2, a record high in the survey, while the wages and benefits index rose from 15.4 to 20.2.
Retailers remained optimistic in June regarding activity in the second half of 2021. The future general business activity index inched up from 36.0 to 37.8, while the future sales index rose from 57.7 to 61.2. Other indexes of future retail activity such as employment remained in firmly positive territory as well.
The Texas Retail Outlook Survey is a component of the Texas Service Sector Outlook Survey that uses information only from respondents in the retail and wholesale sectors.
Next release: July 27, 2021
Data were collected June 15–23, and 282 Texas service sector business executives, of which 54 were retailers, responded to the survey. The Dallas Fed conducts the Texas Service Sector Outlook Survey monthly to obtain a timely assessment of the state’s service sector activity. Firms are asked whether revenue, employment, prices, general business activity and other indicators increased, decreased or remained unchanged over the previous month.
Survey responses are used to calculate an index for each indicator. Each index is calculated by subtracting the percentage of respondents reporting a decrease from the percentage reporting an increase. When the share of firms reporting an increase exceeds the share reporting a decrease, the index will be greater than zero, suggesting the indicator has increased over the prior month. If the share of firms reporting a decrease exceeds the share reporting an increase, the index will be below zero, suggesting the indicator has decreased over the prior month. An index will be zero when the number of firms reporting an increase is equal to the number of firms reporting a decrease. Data have been seasonally adjusted as necessary.
Texas Service Sector Outlook Survey
Historical data are available from January 2007 to the most current release month.
| Business Indicators Relating to Facilities and Products in Texas Current (versus previous month) | ||||||||
| Indicator | Jun Index | May Index | Change | Series Average | Trend* | % Reporting Increase | % Reporting No Change | % Reporting Decrease |
Revenue | 16.7 | 23.9 | –7.2 | 10.9 | 11(+) | 33.4 | 50.0 | 16.7 |
Employment | 11.1 | 13.0 | –1.9 | 6.1 | 11(+) | 19.2 | 72.7 | 8.1 |
Part–Time Employment | 5.4 | 5.9 | –0.5 | 1.3 | 7(+) | 9.5 | 86.4 | 4.1 |
Hours Worked | 10.8 | 11.7 | –0.9 | 2.4 | 10(+) | 14.7 | 81.4 | 3.9 |
Wages and Benefits | 31.4 | 26.9 | +4.5 | 14.1 | 13(+) | 34.2 | 63.0 | 2.8 |
Input Prices | 44.9 | 43.8 | +1.1 | 25.1 | 14(+) | 47.0 | 50.9 | 2.1 |
Selling Prices | 28.6 | 23.5 | +5.1 | 5.4 | 11(+) | 32.5 | 63.6 | 3.9 |
Capital Expenditures | 15.3 | 17.2 | –1.9 | 9.6 | 10(+) | 21.6 | 72.1 | 6.3 |
| General Business Conditions Current (versus previous month) | ||||||||
| Indicator | Jun Index | May Index | Change | Series Average | Trend** | % Reporting Improved | % Reporting No Change | % Reporting Worsened |
Company Outlook | 21.7 | 26.0 | –4.3 | 5.3 | 11(+) | 30.4 | 60.9 | 8.7 |
General Business Activity | 36.2 | 40.0 | –3.8 | 3.4 | 5(+) | 40.6 | 55.0 | 4.4 |
| Indicator | Jun Index | May Index | Change | Series Average | Trend* | % Reporting Increase | % Reporting No Change | % Reporting Decrease |
Outlook Uncertainty† | 1.5 | –5.1 | +6.6 | 10.6 | 1(+) | 17.7 | 66.1 | 16.2 |
| Business Indicators Relating to Facilities and Products in Texas Future (six months ahead) | ||||||||
| Indicator | Jun Index | May Index | Change | Series Average | Trend* | % Reporting Increase | % Reporting No Change | % Reporting Decrease |
Revenue | 54.5 | 58.3 | –3.8 | 37.2 | 14(+) | 62.7 | 29.1 | 8.2 |
Employment | 37.8 | 40.2 | –2.4 | 22.0 | 14(+) | 42.9 | 52.0 | 5.1 |
Part–Time Employment | 18.4 | 16.4 | +2.0 | 6.5 | 13(+) | 21.9 | 74.6 | 3.5 |
Hours Worked | 14.9 | 14.9 | 0.0 | 5.7 | 14(+) | 17.4 | 80.1 | 2.5 |
Wages and Benefits | 49.1 | 50.4 | –1.3 | 35.9 | 14(+) | 51.2 | 46.7 | 2.1 |
Input Prices | 51.7 | 51.4 | +0.3 | 43.4 | 174(+) | 55.0 | 41.7 | 3.3 |
Selling Prices | 39.3 | 34.7 | +4.6 | 22.9 | 14(+) | 43.5 | 52.3 | 4.2 |
Capital Expenditures | 29.2 | 33.7 | –4.5 | 23.2 | 13(+) | 34.3 | 60.6 | 5.1 |
| General Business Conditions Future (six months ahead) | ||||||||
| Indicator | Jun Index | May Index | Change | Series Average | Trend** | % Reporting Improved | % Reporting No Change | % Reporting Worsened |
Company Outlook | 36.0 | 42.0 | –6.0 | 16.7 | 11(+) | 44.6 | 46.7 | 8.6 |
General Business Activity | 43.0 | 48.2 | –5.2 | 13.7 | 11(+) | 49.8 | 43.3 | 6.8 |
Historical data are available from January 2007 to the most current release month.
| Business Indicators Relating to Facilities and Products in Texas Retail (versus previous month) | ||||||||
| Indicator | Jun Index | May Index | Change | Series Average | Trend* | % Reporting Increase | % Reporting No Change | % Reporting Decrease |
| Retail Activity in Texas | ||||||||
Sales | –5.3 | –6.7 | +1.4 | 5.5 | 2(–) | 26.0 | 42.6 | 31.3 |
Employment | 0.9 | 8.9 | –8.0 | 1.8 | 4(+) | 14.3 | 72.3 | 13.4 |
Part–Time Employment | 1.1 | 3.3 | –2.2 | –2.0 | 4(+) | 11.0 | 79.1 | 9.9 |
Hours Worked | –6.7 | 0.2 | –6.9 | –2.1 | 1(–) | 6.4 | 80.5 | 13.1 |
Wages and Benefits | 20.2 | 15.4 | +4.8 | 9.3 | 11(+) | 31.4 | 57.4 | 11.2 |
Input Prices | 59.2 | 52.6 | +6.6 | 19.7 | 14(+) | 61.6 | 36.0 | 2.4 |
Selling Prices | 57.4 | 46.2 | +11.2 | 11.2 | 13(+) | 60.7 | 36.0 | 3.3 |
Capital Expenditures | 20.8 | 15.7 | +5.1 | 7.5 | 5(+) | 26.0 | 68.8 | 5.2 |
Inventories | –17.1 | –11.0 | –6.1 | 2.1 | 4(–) | 19.5 | 44.0 | 36.6 |
| Companywide Retail Activity | ||||||||
Companywide Sales | 5.3 | 1.4 | +3.9 | 7.0 | 4(+) | 30.6 | 44.1 | 25.3 |
Companywide Internet Sales | –1.9 | –2.4 | +0.5 | 6.0 | 2(–) | 22.1 | 53.9 | 24.0 |
| General Business Conditions, Retail Current (versus previous month) | ||||||||
| Indicator | Jun Index | May Index | Change | Series Average | Trend** | % Reporting Improved | % Reporting No Change | % Reporting Worsened |
Company Outlook | 5.6 | 12.4 | –6.8 | 3.6 | 4(+) | 21.0 | 63.6 | 15.4 |
General Business Activity | 30.9 | 26.7 | +4.2 | –0.3 | 4(+) | 37.1 | 56.7 | 6.2 |
| Outlook Uncertainty Current (versus previous month) | ||||||||
| Indicator | Jun Index | May Index | Change | Series Average | Trend* | % Reporting Increase | % Reporting No Change | % Reporting Decrease |
Outlook Uncertainty† | 8.7 | –18.8 | +27.5 | 8.5 | 1(+) | 19.6 | 69.6 | 10.9 |
| Business Indicators Relating to Facilities and Products in Texas, Retail Future (six months ahead) | ||||||||
| Indicator | Jun Index | May Index | Change | Series Average | Trend* | % Reporting Increase | % Reporting No Change | % Reporting Decrease |
| Retail Activity in Texas | ||||||||
Sales | 61.2 | 57.7 | +3.5 | 32.4 | 14(+) | 66.8 | 27.6 | 5.6 |
Employment | 38.4 | 37.2 | +1.2 | 12.4 | 14(+) | 41.1 | 56.2 | 2.7 |
Part–Time Employment | 19.9 | 12.7 | +7.2 | 1.1 | 11(+) | 24.2 | 71.5 | 4.3 |
Hours Worked | 9.8 | 10.0 | –0.2 | 2.8 | 14(+) | 15.0 | 79.8 | 5.2 |
Wages and Benefits | 46.3 | 50.4 | –4.1 | 27.5 | 14(+) | 50.1 | 46.1 | 3.8 |
Input Prices | 52.3 | 51.9 | +0.4 | 33.1 | 14(+) | 61.4 | 29.5 | 9.1 |
Selling Prices | 55.6 | 36.6 | +19.0 | 29.1 | 14(+) | 60.0 | 35.6 | 4.4 |
Capital Expenditures | 24.4 | 25.5 | –1.1 | 17.4 | 13(+) | 31.1 | 62.2 | 6.7 |
Inventories | 37.1 | 47.5 | –10.4 | 9.6 | 14(+) | 52.2 | 32.7 | 15.1 |
| Companywide Retail Activity | ||||||||
Companywide Sales | 53.0 | 50.1 | +2.9 | 30.9 | 14(+) | 63.4 | 26.2 | 10.4 |
Companywide Internet Sales | 53.0 | 32.5 | +20.5 | 22.4 | 15(+) | 55.9 | 41.2 | 2.9 |
| General Business Conditions, Retail Future (six months ahead) | ||||||||
| Indicator | Jun Index | May Index | Change | Series Average | Trend** | % Reporting Improved | % Reporting No Change | % Reporting Worsened |
Company Outlook | 32.6 | 41.6 | –9.0 | 17.4 | 14(+) | 39.9 | 52.8 | 7.3 |
General Business Activity | 37.8 | 36.0 | +1.8 | 13.3 | 11(+) | 45.0 | 47.7 | 7.2 |
*Shown is the number of consecutive months of expansion or contraction in the underlying indicator. Expansion is indicated by a positive index reading and denoted by a (+) in the table. Contraction is indicated by a negative index reading and denoted by a (–) in the table.
**Shown is the number of consecutive months of improvement or worsening in the underlying indicator. Improvement is indicated by a positive index reading and denoted by a (+) in the table. Worsening is indicated by a negative index reading and denoted by a (–) in the table.
†Added to survey in January 2018.
Data have been seasonally adjusted as necessary, with the exception of the outlook uncertainty index which does not yet have a sufficiently long time series to test for seasonality.
Texas Service Sector Outlook Survey
Texas Retail Outlook Survey
Texas Service Sector Outlook Survey
Comments from Survey Respondents
These comments are from respondents’ completed surveys and have been edited for publication.
- There is definitely increased activity in the economy.
- Business has picked up as more of the state opens up. We are keeping a wary eye on the inflation numbers.
- The level of business activity is high; however, it is outrageously difficult to find people who want to work. This is absolutely hindering our ability to grow and to increase volume to meet market demand.
- Our year-to-date May performance has been slightly better than our beginning-of-year outlook for 2021, and we're now moderately confident that 2021 is going to be close to as good as the prior year.
- While business activity is picking up, there are key factors slowing both the sales and delivery processes: The sales process is longer due to not being able to make in-person visits with buyers, and the delivery process is longer due to the super-tight skilled-labor market.
- Our industry—residential mortgage lending—is changing almost daily as we go from paper to data, and Fannie [Mae]/Freddie [Mac] get priced out of the market. Our decrease was temporary.
- The PPP [Paycheck Protection Program] loans are in the process of being approved for forgiveness, and banks that have been accruing fees earned on a monthly basis are now being fully realized. This will provide participants with a large increase in declared revenue. The demand for land and residence has been booming. Building material cost has been increasing, and we are seeing an increase in the sale of manufactured homes as an alternative strategy to buying a home at a fixed price. Most contractors are bidding homes at cost-plus to manage the rapid increase in material cost.
- We are seeing a shift in investment philosophy among some of our clients and as a result of a change in how they structure the mortgage debt portion of the capital stock with respect to commercial real estate assets. There is a much greater interest in securing long-term fixed-rate debt for all sorts of properties and particularly those subject to long-term NNN [triple net] leases. The prospect of significant changes to the capital gains tax rules and rates is most often mentioned in conversations with clients.
- We are researching if inflation is transitory. Uncertainty has increased in this area as the economy picks back up from pandemic lockdowns. Consumers have a lot of pent-up demand and cash to spend.
- Policies coming out of the White House and congressional leadership are very bad for economic growth as well as security. While deficit spending may be fueling short-term growth, there is growing uncertainty in the long term, which makes business planning very difficult.
- This is a tough market and economic circumstance.
- The main challenge is finding qualified employees to join our company. We would hire 30 people today if we could find them. Wages have increased with little impact on attracting the volume or quality of labor force needed. We fear the challenge of finding reasonably priced child care is a major issue in keeping many female workers away from the job market.
- All businesses are reporting staffing shortages.
- Increases in the hard cost of new construction are beginning to slow down transaction volume.
- Anyone who wants to argue inflation is not coming does not live in the world most of us live in; it's here! Wage pressure has gone through the roof as the politicians so artfully, stealthily, executively ordered it into existence with their “relief” payments. Anyone should see that has to stop if you want people to go back to work and this economy to re-engage. Of course maybe therein lies the problem. There is absolutely nothing you can do to make me optimistic or hopeful about our country or economy today!
- Work for the energy industry and associated downstream projects has not really increased; therefore, my consulting business has not increased. While oil prices are up to the $60+ range, they will have to stay there until the end of the year before significant project work will go forward. (Any price dips will add further uncertainty to project authorization and delay work.) Of course, the price will have to stay up into 2022.
- The business climate for our company in the U.S. and globally is getting bad. Return customers and business are big part of our revenue every quarter and every year.
- We are still extremely busy as courts open up and trials begin to move forward in person. We anticipate this same level of workload for at least six months to one year.
- We are still hearing of labor shortages from service industries. Prices for construction materials and supply delays have increased; the uncertainty has shown up in the pricing of recent construction bids.
- No one knows what "normal" will look like. Easing into more in-person operation with hybrid in-person/remote functionality is the default approach since there is too much uncertainty about what works best for clients/employees.
- Business activity has been strong. We are watching closely to see if the current pace continues. Seeing some discounts on WIP [works in progress] to get billed and collected isn't terribly surprising. We are watching the Fed closely on language around rates in 2022 and 2023. The market seems to discount language around increases, so time will tell as we all watch inflation numbers.
- Our workload has increased due to increases in contract activity.
- We have ample business activity to justify expanding the company but are currently hampered by inability to buy vehicles and equipment and to hire.
- We are having supply-chain issues as many of the hardware products we sell have chips, and they are back-ordered two to four months now where normal lead time is two to three weeks.
- Factors affecting our performance: a) chip shortage (automotive); b) labor shortage; c) increased interest from customers in relocating production from Asia to North America.
- This market is on fire. Our residential division has been working overtime for the past five months, and now the commercial division is doing the same. We cannot close deals fast enough for our customers, and we do not see it slowing down anytime soon. It is a great problem to have, but we are remaining very cautious about staffing up due the uncertainty of the new tax laws that are being discussed.
- We can feel the economy slowly coming back to life.
- Current client portfolios have exposure with the manufacturing sector. Supply-chain gaps are causing uncertainty on deliverables. Real estate values and housing costs are rising rapidly, creating the potential feeling of a real estate bust as experienced in the 80s.
- We experienced an increase in client activity in late January that held through May. Since June, the client activity has declined slightly. We do not have an explanation for the softening when broader economic indicators are positive.
- Construction costs and lead times for materials are the biggest issues right now—that, and lack of suitable inventory in all asset classes.
- Inflation is starting to impact consumer and business spending trends as increases in food costs, fuel and construction costs are tightening belts and postponing building projects, etc.
- Prices are rapidly increasing. We are unable to find labor.
- Construction-related inflation is as high as I have ever seen it in 30 years.
- Contract employee hiring is very slightly up, but full-time employment opportunities are up modestly. We are a staffing company, and qualified candidates are applying for positions with no intention of accepting interviews or even phone calls. They're able to check a box on their unemployment claim and continue collecting unemployment. As everyone in business knows, we need to increase the pool of willing individuals who want to work if businesses are going to survive.
- We are a boutique search and staffing firm that fills professional-level positions in Dallas–Fort Worth and around the U.S. Currently, we have more positions to fill than quality candidates to fill them, which I believe is the norm at all search and staffing firms and with all corporate in-house talent acquisition teams. I'm worried about burnout of my team at a time that I need them most. It's unfortunate we cannot help all our clients fill their open roles, but we are having to choose which ones we have the bandwidth to help and which ones go to the backburner. The current candidate-driven market makes having a strong relationship with an outside staffing firm a must.
- We are concerned about higher prices and labor shortages.
- Our biggest issue right now is the increased input costs. Eighty-seven percent of the materials we buy for our normal inspection operations have increased [in cost] from [between] 7.2 to 22 percent from the same period last year. We have already sent out a notice to our customers of a price increase on July 1 and are budgeting for future increases in all our input costs.
- Prices are rising and changing on a daily basis, and the additional hidden fees are not good for the consumer as business try to recoup losses from 2020. It is not a consistent selling process, but rather a Wild West, get-what-you-can process.
- A broad cross section of the market seems to be improving. There are no obvious impediments other than higher material/supply costs and continuing disruptions in supply chains.
- In the education sector, we are hoping students will come back to campus and make up for enrollment deficits from the past year.
- Inflation has arrived, and I don’t think it’s transitory. It seems the Federal Reserve has begun to shift in that direction [of expecting non-transitory inflation] and that’s comforting. What is not comforting is the printing of money for upcoming federal legislation. Very worrisome!
- The response of high school and college students to quarantine and online learning has increased their uncertainty about what works for them and whether they will return to or enroll in a traditional university.
- Labor is very tough to find. [We increased] entry labor [compensation] by 20 percent. Senior [skilled] labor [compensation] is flat, and there are some good people looking to make a change, not for money but for lifestyle or reduced workload.
- There is indeed a significant behavior change in the health care industry. Consumers’ [patients’] routine wellness checkups and routine procedures have taken a back burner due to the cost of these services (with deductibles, etc.). Also, many physicians are still taking care of 50 percent of their patients via telemedicine, which does not allow a lot of routine lab work. This has led to fewer procedures and hospitalizations, which in turn impacts all of the post-acute-care providers with lower number of patients needing nursing home, assisted living, home health or hospice services. We are not sure if this behavior change of the patients toward health care is temporary or permanent.
- COVID cases down, economy up, we must agree; inflation rising with world on a spending spree; all worried about rising BIPS [basis points]; or whether to buy more TIPS [Treasury inflation-protected securities]; but boards are likely most frightened by ESG [environmental, social and governance].
- Demand for emergency food remains high at our food bank. As the economy recovers for some, the people we serve are often forgotten. In fact, we expect a sharp increase in demand for emergency food as federal pandemic assistance programs are eliminated.
- Finding staff is our greatest challenge now, at all levels, skilled or unskilled.
- We have 100 openings on a base of 550 employees. We are starting to see sales soften while job candidates are slightly increasing from May. We are anxiously monitoring how the next 30 days play out.
- Business activity continues to improve across the nation, although there is lower revenue in leisure travel. We remain cautious about the return of business travel and group meetings in late third and fourth quarters. We do expect a robust return of business and group [activity] in first quarter 2022. Staffing, wage pressures and balancing state/local COVID reopening regulations continue to challenge the business.
- Business levels continue to show signs of improvement. Inability to fill open positions is the primary factor holding growth back from being even more robust.
- In the hospitality sector, leisure demand is at or above 2018/2019 levels. In our case, the only segment not yet back is large group meetings. We will see a few in the second half of 2021 and more in 2022 but not 100 percent until 2023.
- We are turning away business because we can't hire or retain enough staff even though we have increased wages (we always provided the opportunity for health insurance as well as paid vacations and 401k matching). It is unclear how the end of federal subsidies for unemployment will help—fingers crossed. Also, the price of our raw materials is spiking, which will end up with increased prices.
- We are working with a constraint on employees. Hiring new personnel has become a great challenge, and food cost has also been very important.
- May is a very busy month with graduations and parties. June is hot and guests travel. Outdoor seating is not as popular. We can’t hire enough new employees to open for a full schedule.
- Large business has come back and is still booking for future months.
- COGS [cost of goods sold] is out of control.
- Commodity sourcing is still of great concern. Commodity pricing continues to increase.
- All of these government programs to keep people from working are hurting small business owners. This is causing chaos in the job market and adds to all of the shortages that we are experiencing across all industries. It also adds to inflation.
- We, as well as many of our businesses, are struggling in locating talent and talent retention. The unemployment benefits have hindered the process. In addition, many of our businesses are having to increase their prices due to the breakdown in supply chains for services they need to purchase to run their business, thus having to pass it off to their customers. We are still seeing businesses in a fragile state but are extremely optimistic about the future. Many have kept their virtual platforms as they expand their opening process.
- We simply do not see the labor force necessary to keep up with demand for our goods. While we hope June 26 will bring more people into the active labor force, we are wary. Lead times on all items are severely affected and do not seem to be correcting. Major issues in export container availability could cause numerous ripple effects in the supply chain and domestic versus import/export markets.
- We are looking forward to receiving the second stimulus to get us through; sales have slightly increased, but are still very low. There seems to be steady but slow growth.
- Vehicle inventories remain very tight, and parts inventories are tight as well.
- Our situation continues to get worse. New-vehicle inventories are at the lowest level in our history—41 years. July will be worse than June. The negative impact on profitability will be significant.
- We have the lowest inventory in 44 years. It doesn’t look like it will get better in the future.
- Our retail and fleet auto business continues to struggle with inventory shortages. We expect to see relief by mid-fall, but we are skeptical as to the extent of the relief as we hear mixed messages. Due to this shortage of vehicles, the selling prices for new and used cars, SUVs and trucks have increased dramatically.
- Chip shortages are a major problem, causing low inventory of new vehicles, which leads to low inventory of used vehicles, which leads to retail price increases in both new and used vehicles.
- Lack of inventory caused by distribution disruptions and materials shortages is having a major negative effect on sales.
- Supply-chain problems, specifically the chip shortage, have contributed to severe inventory shortages for auto dealers, negatively impacting the bottom line.
- We are almost back to normal.
- We came into the month expecting a lot of return to work at our customer locations. While we have seen a bit of that, it's not to the extent we expected.
Historical Data
Historical data can be downloaded dating back to January 2007.
Indexes
Download indexes for all indicators. For the definitions of all variables, see Data Definitions.
Texas Service Sector Outlook Survey |
Texas Retail Outlook Survey |
| Unadjusted | Unadjusted |
| Seasonally adjusted | Seasonally adjusted |
All Data
Download indexes and components of the indexes (percentage of respondents reporting increase, decrease, or no change). For the definitions of all variables, see Data Definitions.
Texas Service Sector Outlook Survey |
Texas Retail Outlook Survey |
| Unadjusted | Unadjusted |
| Seasonally adjusted | Seasonally adjusted |
Questions regarding the Texas Service Sector Outlook Survey can be addressed to Christopher Slijk at christopher.slijk@dal.frb.org.
Sign up for our email alert to be automatically notified as soon as the latest Texas Service Sector Outlook Survey is released on the web.