
Texas Service Sector Outlook Survey
Texas service sector activity declines modestly
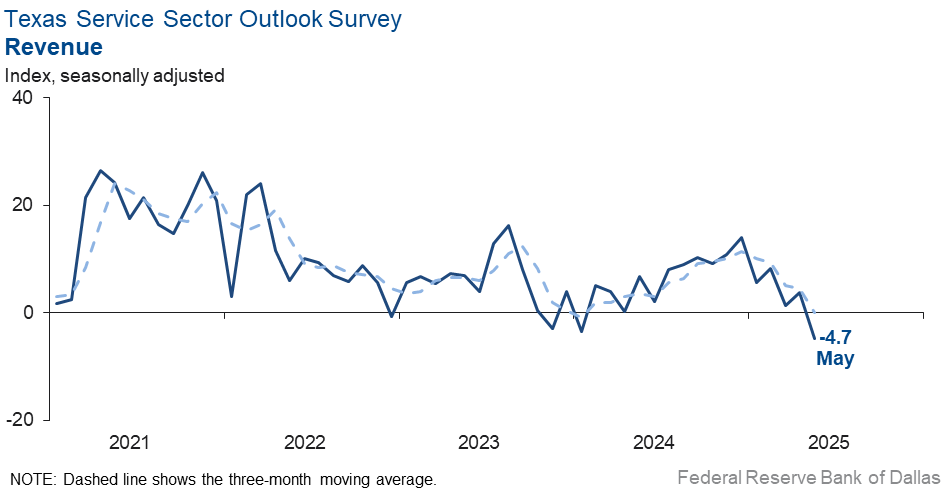
Texas service sector activity contracted in May, according to business executives responding to the Texas Service Sector Outlook Survey. The revenue index, a key measure of state service sector conditions, fell nine points to -4.7, suggesting revenue contracted slightly.
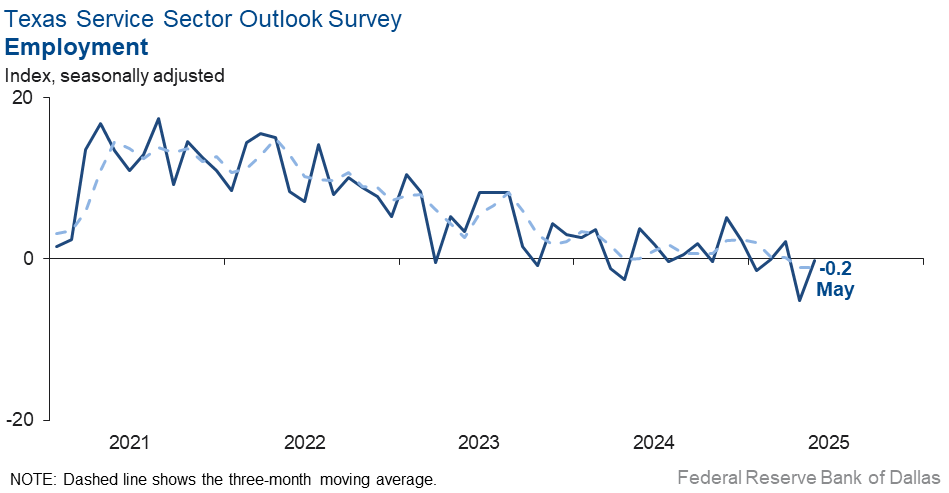
Labor market measures suggested both employment and workweeks were unchanged in May. The employment index increased to -0.2 from -5.1. The part-time employment index edged up to -0.7 from -3.4, while the hours-worked index dipped three points to -1.2.
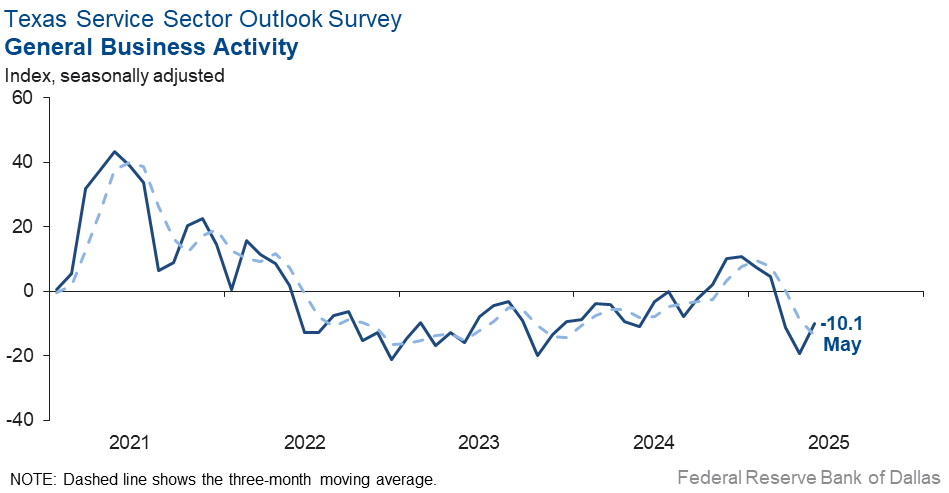
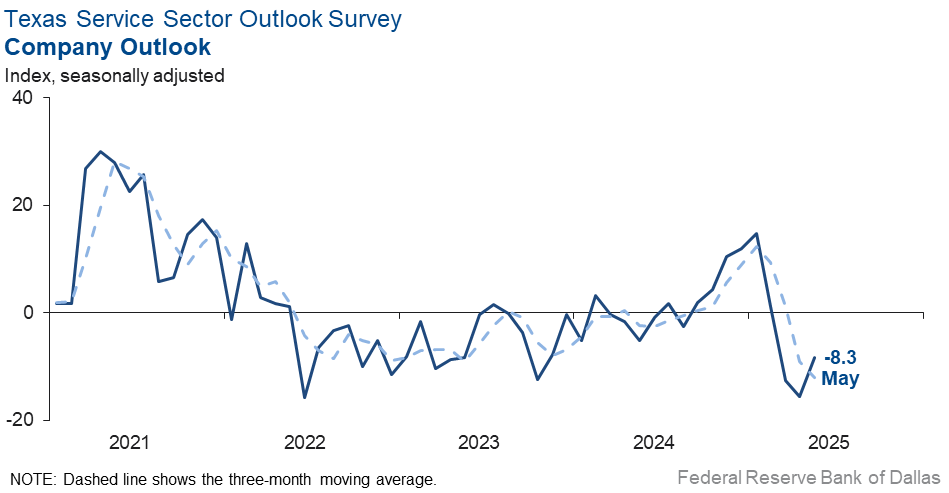
Perceptions of broader business conditions worsened in May, but uncertainty moderated. The general business activity index and the company outlook index rose but remained in negative territory at -10.1 and -8.3, respectively. Meanwhile, the outlook uncertainty index fell sharply to 18.7 from 40.5.
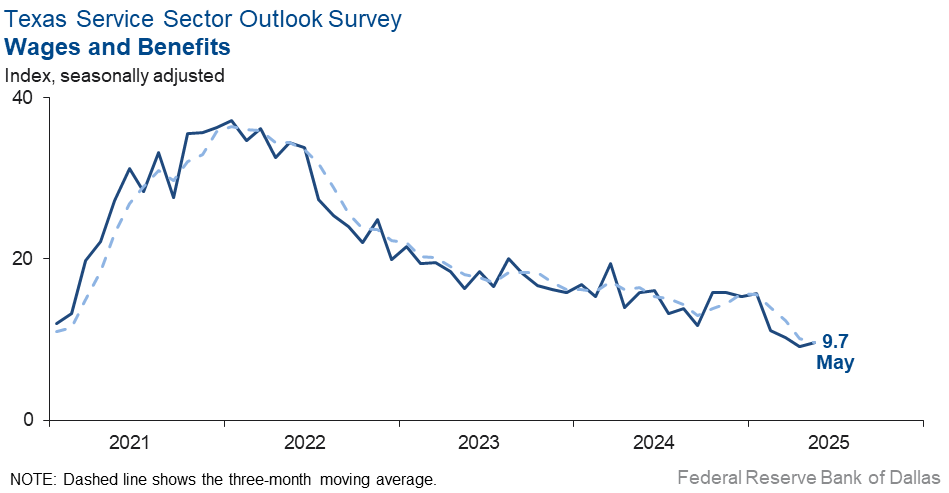
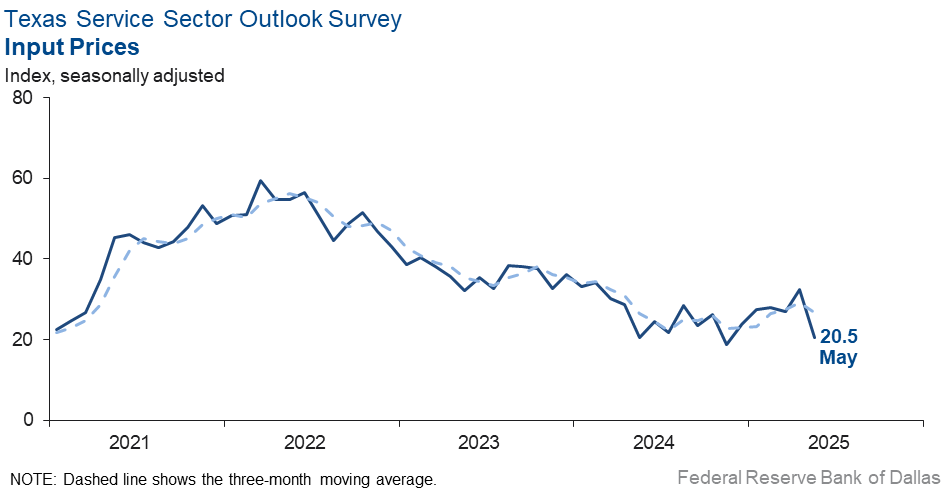
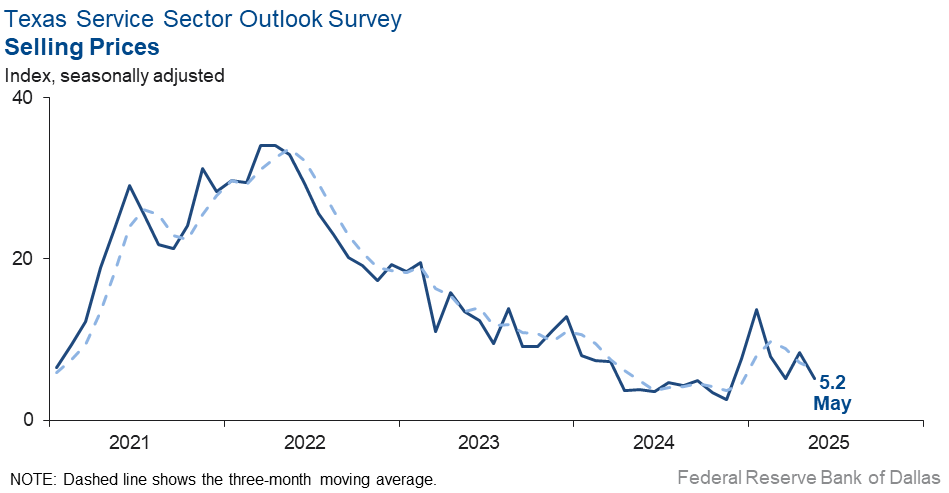
Selling and input price growth eased in May while wage growth remained stable. The selling prices index fell three points to 5.2, and the input prices index fell to 20.5 from 32.5. Both indexes were below their respective series averages. The wages and benefits index was little changed at 9.7.
Respondents’ expectations regarding future business activity were neutral to positive. The future general business activity index climbed 16 points to a near-zero reading. The future revenue index rose 10 points to 27.2. Other future service sector activity indexes such as employment and capital expenditures increased and remained in positive territory.

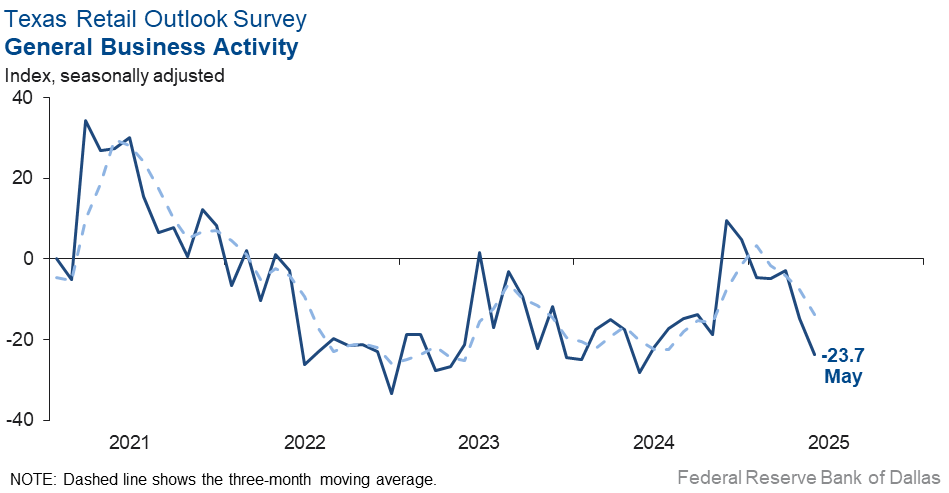
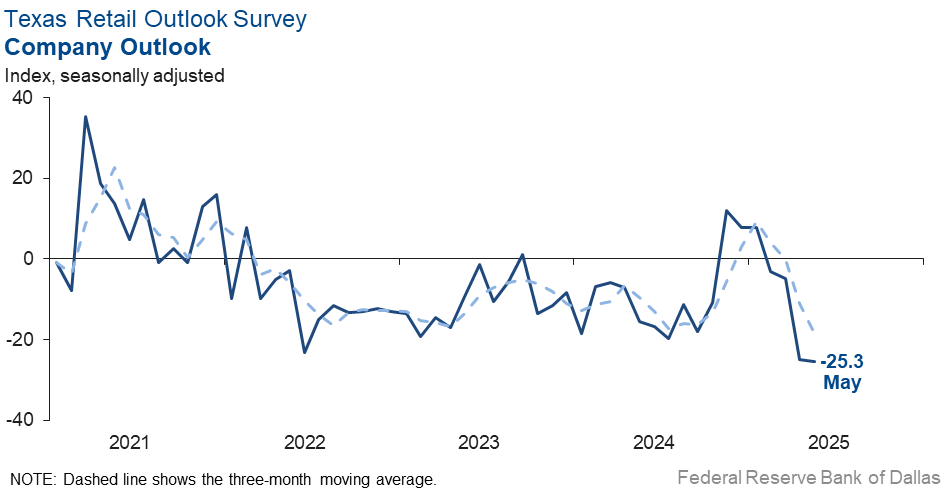
Texas Retail Outlook Survey
Texas retail sales decline notably
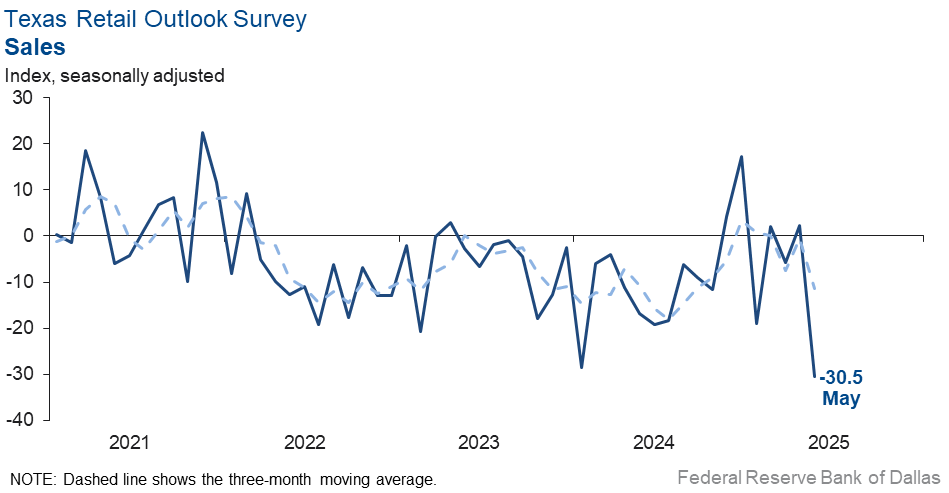
Retail sales activity contracted sharply in May, according to business executives responding to the Texas Retail Outlook Survey. The sales index, a key measure of state retail activity, plunged 33 points to -30.5, its lowest level since April 2020. Retailers’ inventories pushed further negative, with the May index falling to -10.7 from -2.4.
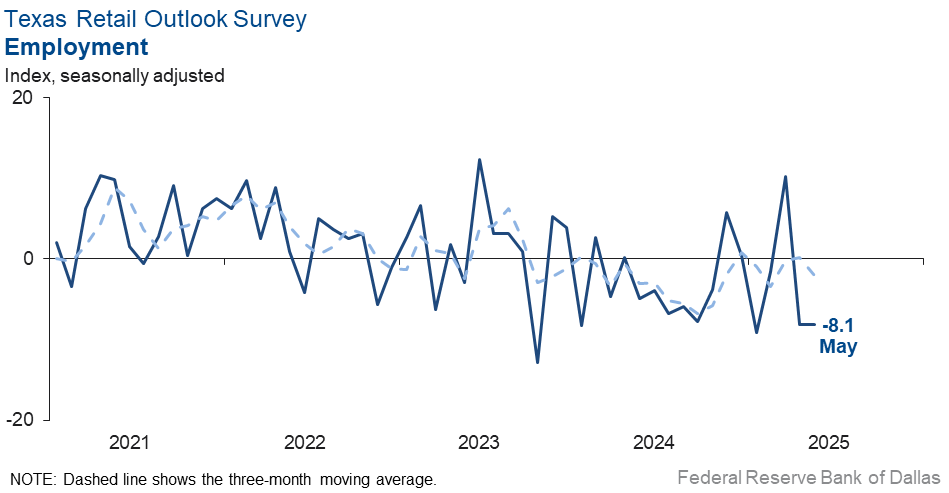
Retail sector labor market indicators suggested continued contraction in employment and workweeks. The employment index remained at -8.1, indicating a decline in employment. The part-time employment index increased four points but remained negative at -3.6, and the hours-worked index was unchanged at -3.8.
Perceptions of broader business conditions deteriorated further in May. The general business activity index declined deeper into negative territory, dropping to -23.7 from -14.8. The company outlook index remained negative at -25.3. The outlook uncertainty index retreated 11 points to 19.7, though it remained well above the series average of 11.3.
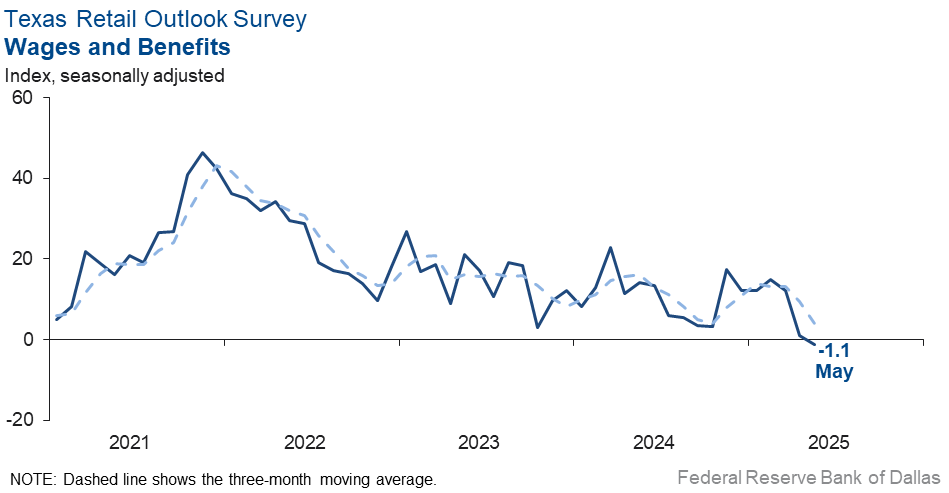
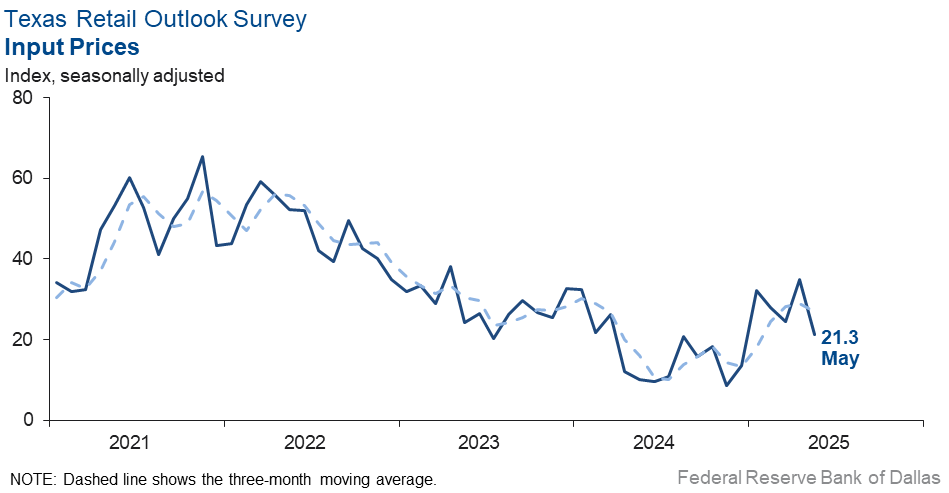
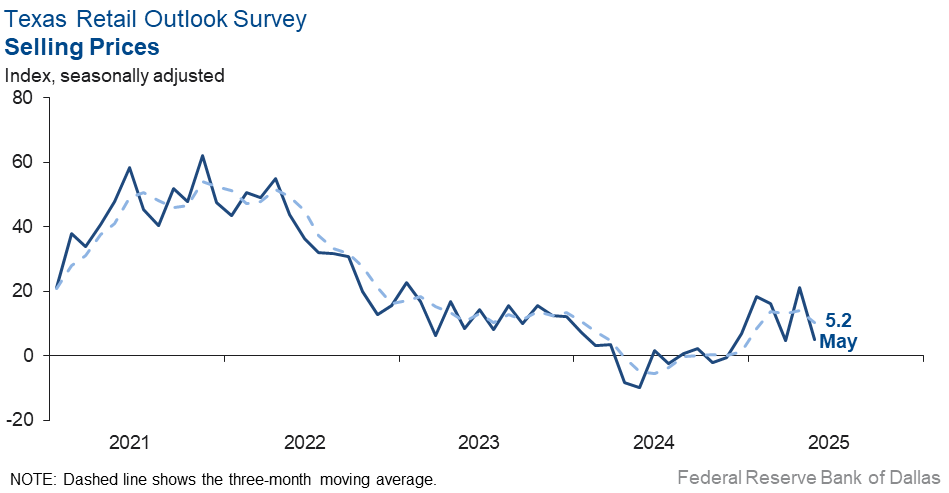
Price growth eased while wages were stable in May. The selling prices index fell 16 points to 5.2, and the input prices index declined 14 points to 21.3. Meanwhile, the wages and benefits index dipped to -1.1, its lowest reading since July 2020.
Expectations for future retail activity were mixed. The future general business activity index increased 23 points to -1.3, suggesting no growth in business activity six months from now. The future company outlook index climbed 22 points but remained in negative territory at -3.3. Meanwhile, the future sales and future employment indexes both jumped up from near zero readings to 13.7 and 11, respectively. The future capital expenditures index also turned positive, increasing to 16.5 from -12.5.
Next release: July 1, 2025
Data were collected May 13–21, and 253 of the 371 Texas service sector business executives surveyed submitted responses. The Dallas Fed conducts the Texas Service Sector Outlook Survey monthly to obtain a timely assessment of the state’s service sector activity. Firms are asked whether revenue, employment, prices, general business activity and other indicators increased, decreased or remained unchanged over the previous month.
Survey responses are used to calculate an index for each indicator. Each index is calculated by subtracting the percentage of respondents reporting a decrease from the percentage reporting an increase. When the share of firms reporting an increase exceeds the share reporting a decrease, the index will be greater than zero, suggesting the indicator has increased over the prior month. If the share of firms reporting a decrease exceeds the share reporting an increase, the index will be below zero, suggesting the indicator has decreased over the prior month. An index will be zero when the number of firms reporting an increase is equal to the number of firms reporting a decrease.
Data have been seasonally adjusted as necessary.
Texas Service Sector Outlook Survey
Historical data are available from January 2007 to the most current release month.
| Business Indicators Relating to Facilities and Products in Texas Current (versus previous month) | ||||||||
| Indicator | May Index | Apr Index | Change | Series Average | Trend* | % Reporting Increase | % Reporting No Change | % Reporting Decrease |
Revenue | –4.7 | 3.8 | –8.5 | 10.4 | 1(–) | 20.3 | 54.7 | 25.0 |
Employment | –0.2 | –5.1 | +4.9 | 6.0 | 2(–) | 11.1 | 77.6 | 11.3 |
Part–Time Employment | –0.7 | –3.4 | +2.7 | 1.3 | 3(–) | 5.0 | 89.3 | 5.7 |
Hours Worked | –1.2 | 1.6 | –2.8 | 2.5 | 1(–) | 6.1 | 86.6 | 7.3 |
Wages and Benefits | 9.7 | 9.1 | +0.6 | 15.6 | 60(+) | 13.2 | 83.3 | 3.5 |
Input Prices | 20.5 | 32.5 | –12.0 | 27.8 | 61(+) | 27.5 | 65.5 | 7.0 |
Selling Prices | 5.2 | 8.4 | –3.2 | 7.5 | 58(+) | 15.6 | 74.0 | 10.4 |
Capital Expenditures | 4.4 | 0.6 | +3.8 | 9.8 | 58(+) | 13.6 | 77.2 | 9.2 |
| General Business Conditions Current (versus previous month) | ||||||||
| Indicator | May Index | Apr Index | Change | Series Average | Trend** | % Reporting Improved | % Reporting No Change | % Reporting Worsened |
Company Outlook | –8.3 | –15.5 | +7.2 | 4.2 | 3(–) | 12.7 | 66.3 | 21.0 |
General Business Activity | –10.1 | –19.4 | +9.3 | 2.1 | 3(–) | 11.8 | 66.3 | 21.9 |
| Indicator | May Index | Apr Index | Change | Series Average | Trend* | % Reporting Increase | % Reporting No Change | % Reporting Decrease |
Outlook Uncertainty | 18.7 | 40.5 | –21.8 | 13.5 | 48(+) | 30.3 | 58.1 | 11.6 |
| Business Indicators Relating to Facilities and Products in Texas Future (six months ahead) | ||||||||
| Indicator | May Index | Apr Index | Change | Series Average | Trend* | % Reporting Increase | % Reporting No Change | % Reporting Decrease |
Revenue | 27.2 | 16.8 | +10.4 | 37.4 | 61(+) | 42.1 | 42.9 | 14.9 |
Employment | 17.6 | 9.8 | +7.8 | 23.0 | 61(+) | 25.2 | 67.2 | 7.6 |
Part–Time Employment | 3.2 | –2.0 | +5.2 | 6.5 | 1(+) | 10.1 | 83.0 | 6.9 |
Hours Worked | 4.7 | –0.2 | +4.9 | 5.9 | 1(+) | 8.7 | 87.3 | 4.0 |
Wages and Benefits | 34.2 | 29.2 | +5.0 | 37.4 | 61(+) | 35.9 | 62.4 | 1.7 |
Input Prices | 47.7 | 49.7 | –2.0 | 44.4 | 221(+) | 51.0 | 45.7 | 3.3 |
Selling Prices | 23.7 | 26.2 | –2.5 | 24.5 | 61(+) | 32.2 | 59.3 | 8.5 |
Capital Expenditures | 13.7 | 8.6 | +5.1 | 22.6 | 60(+) | 24.2 | 65.4 | 10.5 |
| General Business Conditions Future (six months ahead) | ||||||||
| Indicator | May Index | Apr Index | Change | Series Average | Trend** | % Reporting Improved | % Reporting No Change | % Reporting Worsened |
Company Outlook | 3.2 | –11.7 | +14.9 | 15.4 | 1(+) | 21.6 | 60.0 | 18.4 |
General Business Activity | –0.3 | –16.0 | +15.7 | 12.0 | 3(–) | 20.0 | 59.7 | 20.3 |
Historical data are available from January 2007 to the most current release month.
| Business Indicators Relating to Facilities and Products in Texas Retail (versus previous month) | ||||||||
| Indicator | May Index | Apr Index | Change | Series Average | Trend* | % Reporting Increase | % Reporting No Change | % Reporting Decrease |
| Retail Activity in Texas | ||||||||
Sales | –30.5 | 2.3 | –32.8 | 3.0 | 1(–) | 15.8 | 37.9 | 46.3 |
Employment | –8.1 | –8.1 | 0.0 | 1.5 | 2(–) | 10.0 | 71.9 | 18.1 |
Part–Time Employment | –3.6 | –7.2 | +3.6 | –1.5 | 3(–) | 9.1 | 78.2 | 12.7 |
Hours Worked | –3.8 | –3.8 | 0.0 | –2.2 | 6(–) | 4.0 | 88.2 | 7.8 |
Wages and Benefits | –1.1 | 1.0 | –2.1 | 11.1 | 1(–) | 10.2 | 78.5 | 11.3 |
Input Prices | 21.3 | 34.9 | –13.6 | 22.5 | 61(+) | 38.4 | 44.6 | 17.1 |
Selling Prices | 5.2 | 21.3 | –16.1 | 13.1 | 6(+) | 32.7 | 39.8 | 27.5 |
Capital Expenditures | –2.3 | –2.5 | +0.2 | 7.4 | 2(–) | 10.9 | 75.9 | 13.2 |
Inventories | –10.7 | –2.4 | –8.3 | 2.7 | 4(–) | 17.6 | 54.1 | 28.3 |
| Companywide Retail Activity | ||||||||
Companywide Sales | –35.8 | 4.7 | –40.5 | 4.2 | 1(–) | 12.4 | 39.5 | 48.2 |
Companywide Internet Sales | –25.2 | –2.8 | –22.4 | 3.7 | 3(–) | 11.3 | 52.2 | 36.5 |
| General Business Conditions, Retail Current (versus previous month) | ||||||||
| Indicator | May Index | Apr Index | Change | Series Average | Trend** | % Reporting Improved | % Reporting No Change | % Reporting Worsened |
Company Outlook | –25.3 | –25.0 | –0.3 | 1.2 | 4(–) | 10.1 | 54.5 | 35.4 |
General Business Activity | –23.7 | –14.8 | –8.9 | –2.7 | 5(–) | 10.3 | 55.7 | 34.0 |
| Outlook Uncertainty Current (versus previous month) | ||||||||
| Indicator | May Index | Apr Index | Change | Series Average | Trend* | % Reporting Increase | % Reporting No Change | % Reporting Decrease |
Outlook Uncertainty | 19.7 | 30.9 | –11.2 | 11.3 | 10(+) | 28.3 | 63.1 | 8.6 |
| Business Indicators Relating to Facilities and Products in Texas, Retail Future (six months ahead) | ||||||||
| Indicator | May Index | Apr Index | Change | Series Average | Trend* | % Reporting Increase | % Reporting No Change | % Reporting Decrease |
| Retail Activity in Texas | ||||||||
Sales | 13.7 | 0.1 | +13.6 | 30.1 | 24(+) | 35.3 | 43.1 | 21.6 |
Employment | 11.0 | –0.3 | +11.3 | 12.6 | 1(+) | 19.7 | 71.7 | 8.7 |
Part–Time Employment | 2.8 | –16.7 | +19.5 | 1.5 | 1(+) | 13.2 | 76.4 | 10.4 |
Hours Worked | –1.4 | –14.5 | +13.1 | 2.2 | 5(–) | 6.4 | 85.8 | 7.8 |
Wages and Benefits | 26.2 | 17.2 | +9.0 | 28.9 | 61(+) | 30.0 | 66.3 | 3.8 |
Input Prices | 47.7 | 49.7 | –2.0 | 33.9 | 61(+) | 51.0 | 45.7 | 3.3 |
Selling Prices | 13.7 | 8.6 | +5.1 | 28.3 | 61(+) | 24.2 | 65.4 | 10.5 |
Capital Expenditures | 16.5 | –12.5 | +29.0 | 16.4 | 1(+) | 25.8 | 64.9 | 9.3 |
Inventories | 0.1 | –3.7 | +3.8 | 10.6 | 1(+) | 22.5 | 55.1 | 22.4 |
| Companywide Retail Activity | ||||||||
Companywide Sales | 11.8 | –6.8 | +18.6 | 28.5 | 1(+) | 36.3 | 39.2 | 24.5 |
Companywide Internet Sales | 18.7 | 40.5 | –21.8 | 21.1 | 16(+) | 30.3 | 58.1 | 11.6 |
| General Business Conditions, Retail Future (six months ahead) | ||||||||
| Indicator | May Index | Apr Index | Change | Series Average | Trend** | % Reporting Improved | % Reporting No Change | % Reporting Worsened |
Company Outlook | –3.3 | –25.1 | +21.8 | 14.7 | 3(–) | 18.7 | 59.3 | 22.0 |
General Business Activity | –1.3 | –24.2 | +22.9 | 10.2 | 2(–) | 21.6 | 55.5 | 22.9 |
*Shown is the number of consecutive months of expansion or contraction in the underlying indicator. Expansion is indicated by a positive index reading and denoted by a (+) in the table. Contraction is indicated by a negative index reading and denoted by a (–) in the table.
**Shown is the number of consecutive months of improvement or worsening in the underlying indicator. Improvement is indicated by a positive index reading and denoted by a (+) in the table. Worsening is indicated by a negative index reading and denoted by a (–) in the table.
Data have been seasonally adjusted as necessary.
Texas Service Sector Outlook Survey
Texas Retail Outlook Survey
Texas Service Sector Outlook Survey
Comments from survey respondents
Survey participants are given the opportunity to submit comments on current issues that may be affecting their businesses. Some comments have been edited for grammar and clarity.
- The level of interest rates, oil and natural gas prices, drilling activity, and international trade policies are increasing the level of uncertainty.
- Leading indicators of recession are flashing yellow, if not red: slowdowns in hiring, increases in credit card delinquency and customers extending payment times. There’s too much uncertainty around tariffs, and fiscal deficits keep growing.
- Much of our funding is tied to federal grants, so the uncertainty at the federal level is concerning.
- Uncertainty continues. It’s difficult to determine whether the outlook has gotten worse; it's day by day, week by week. We have had client companies that have put hiring plans on hold and others that have increased hiring. It’s very dependent on the industry.
- I wish we could see some policy stability coming out of Washington.
- The incredible amount of uncertainty provided by the current administration is severely hampering our business and financial planning. The ill-advised tariffs have increased our supply costs by 10–20 percent, and the tariff costs are being passed along to the end customer. The general economic uncertainty has led to a decrease in our business forecasts, and even parents are becoming more economically sensitive about when to bring sick or injured children to our pediatric urgent care facility. We are, however, seeing a rise in families formerly insured through employers who are now either on COBRA benefits or having to register as self-pay patients.
- We are looking at an acquisition in another city. Uncertainty in the bond market and the potential for much higher long-term interest rates are making us question whether something potentially cataclysmic might occur to the economy, in which case we don't want to take on additional debt or make significant investments.
- We are seeing continuing concern over the current economic environment. Critical decisions with unknown potential impact on the economy remain to be realized. Revenue streams are steady, but there are a lot of moving parts, creating a difficult situation in forecasting future impacts on revenue streams.
- With more computerization, the residential lending industry has changed significantly over the years. Now the industry has the NAR [National Association of Realtors] antitrust, cash-is-king, corporate amassing of home ownership, student loan debt and the stunningly high cost of building materials issues to deal with. Our enterprise is seeking to create a new model.
- International relationships, visa policy changes and potential tariffs continue to threaten our forecast. Uncertainty about state and federal funding for higher education remains significant, although the state component should be resolved soon.
- People don't seem to be spending as much on fast food.
- Uncertainty continues to be top of mind when I plan for the future. Our petroleum industry has weakened due to falling energy prices, which could turn ugly fast. I remember the early ’80s when I witnessed large-scale layoffs. The oil industry was the first domino to fall, then every industry was affected. Home sales crashed, and bankruptcies were the norm.
- Business is slow. I hope it will pick up.
- Property insurance rates in Texas seem to be leveling off a bit, which is good news for insurance buyers.
- Discussions about tariffs [are an issue impacting our business].
- Tariffs will slow growth and revenue. Small firms can't cope like big ones.
- This sounds like a broken record, but until we solve the tariff issues, the real estate market will remain unsettled.
- We see higher enthusiasm among our customers. The concept of America First is building businesses in the U.S. and persuading many of our clients and prospects to perform some of their business work in the U.S.
- Tariffs [are an issue impacting our business].
- We are receiving so many mixed messages about the economy, including tariffs, inflation, labor, taxes, government cuts, etc. It is impossible to plan for growth!
- Expecting a strong second half (July–December) of 2025 for the U.S. as well as for global demand for our software products and support services.
- Construction activity is strong, but the impact of tariffs is undefined.
- There is still significant uncertainty due to slumping oil and gas commodity prices. Impact of tariffs now appears muted, at least in the short term (next 90 days).
- Federal government policy with respect to tariffs and immigration still weighs on our outlook for commercial construction, which directly influences our business as a commercial construction design engineer. If trade policy moderates and a sensible approach to immigration is taken, then our outlook—and the country's as a whole—stands to stabilize and improve.
- Please cut interest rates. They are killing our business.
- The reason for the increased revenues 6 months from now is that some work is scheduled for that time and has been for several months.
- I think we are starting to see a slowdown. It's hard to tell what is causing it.
- No significant difference from the last survey. High forward-looking uncertainty, particularly with government/Department of Defense budgets and approval timing.
- There is a slight worsening of activity from goals/expectations, due in part to continuous economic uncertainty. Also, we've noted ongoing behavior changes that have become increasingly challenging post-COVID. Regular communication is getting worse: clients not responding, taking meetings or confirming orders.
- Potential tariff deals have improved the overall outlook, although uncertainty given decision volatility remains. While uncertainty around government spending and contracting remains, it seems like things are becoming more stable as the current administration settles in.
- We are in the same spot as last month.
- I think the idea of tariffs has caused some caution in the market, but continued pauses and positive news will settle things down.
- We are worried about 2028 and beyond due to the current uncertainty around tariffs and the market.
- Reality is starting to outpace rhetoric. Investors are tied up in knots, business leaders we know are frustrated, and our residents are fearful. The rule of law appears to be in jeopardy. We don't like where any of this is headed. The only thing getting better is retention. Residents and employees alike are not eager to move.
- The dynamics of the Texas commercial real estate market continue to improve, due mostly to inmigration of manpower and corporate facilities.
- When you are a dealer for heavy equipment manufactured in part or in whole all over the world, tariffs have done nothing but create panic and unknowns. As the political picture becomes clearer, things will settle down and improve businesswise. However, we finished first quarter 2025 down 2.7 percent and we finished April down 6.4 percent, down from 2.7 percent in March. There is lots of activity, but most customers are not willing to pull the trigger until they see the economy improve and see reasons to make capital investments in their businesses.
- Supply chains in the HVAC industry are getting snarled again.
- Like many business owners, it may be that our situation hasn't changed due to tariffs. But spillover effects are starting to happen.
- Lower-income group's spending declines have slowed, providing a floor. Recent rains have boosted agriculture.
- The tariff scare seems to have negatively affected hiring activity, and that has showed itself with May placement (revenue) numbers. We would expect any signs of relief to positively affect hiring in the coming months, but we definitely experienced a hiccup.
- While tariffs continue to directly impact our business, the most significant increase in our optimism stems from the new administration’s efforts to address Commercial Driver’s License-(CDL) related challenges, particularly concerning nondomiciled CDLs and English-language proficiency standards. These measures are expected to reduce the presence of unqualified or unauthorized drivers from outside the U.S. who often operate at below-market rates. By leveling the playing field, these efforts support legally compliant carriers’ ability to offer competitive, livable wages while maintaining sustainable profitability.
- Tariffs are impacting costs and business activity for those with a lot of imports. The impact could potentially be a 20–30 percent reduction if tariffs hold.
- The tariff situation has made things worse. People are holding back on purchases.
- Pauses on the tariffs have settled things down for the time being. But the general uncertainty in world markets, coupled with a dip in world demand for energy, has driven oil prices down to levels that will pause most new drilling, potentially decreasing shipments later in the year.
- We have a very guarded outlook for 2025.
- Officially there are too many stores to buy appliances from for the amount of sales.
- While pending tariffs have increased the cost of raw materials and supplies such as green coffee and bags and cups, the impacts have been minimal. Our supply-chain team foresaw the potential impacts and bought ahead, but those stockpiles are nearing exhaustion as tariffs now seem to be subsiding. Generally, we've not seen major negative impacts due to the tariff dustup. Overall, sales were up dramatically in April, more than 12 percent, year over year. Grocery retail units were up nearly 95 percent. We remain optimistic.
- Increased costs in the poultry and beef markets will cause a price increase for our consumers.
- We haven't yet seen the effects of tariffs. We're bracing ourselves for adverse conditions if they are implemented.
- Having clarity on Mexico trade is helpful, and we have resumed trading with Mexican companies for first time since January. However, Southeast Asia business is still very affected.
- The on-again, off-again tariff situation makes supply-chain planning very difficult. The fact that Moody's downgraded U.S. Treasury debt is another bad omen for the economy.
- Uncertainty with regard to tariffs is making it very difficult to plan.
- Tariff-related uncertainty [is an issue impacting our business].
- New vehicle unit sales were up last two months. Our opinion is that consumers are buying now to avoid possible higher future prices due to tariffs.
- The retail auto business is in a state of uncertainty due to the lack of information from manufacturers on future vehicle pricing.
- I can't predict what will transpire six months from now, but I believe we will experience a downturn in the last half of 2025. Uncertainty increases by the day. May sales will be down significantly from March and April. Tariff concerns accelerated purchases and that is but one of many reasons May will be softer.
- Tariffs have increased uncertainty and prices for the near term, but it will benefit all in the long run. We are still seeing customers and employees in financial strain, I think from recent inflation and perhaps a variety of other causes.
Historical Data
Historical data can be downloaded dating back to January 2007.
Indexes
Download indexes for all indicators. For the definitions of all variables, see data definitions.
Texas Service Sector Outlook Survey |
Texas Retail Outlook Survey |
| Unadjusted | Unadjusted |
| Seasonally adjusted | Seasonally adjusted |
All Data
Download indexes and components of the indexes (percentage of respondents reporting increase, decrease, or no change). For the definitions of all variables, see data definitions.
Texas Service Sector Outlook Survey |
Texas Retail Outlook Survey |
| Unadjusted | Unadjusted |
| Seasonally adjusted | Seasonally adjusted |
Questions regarding the Texas Service Sector Outlook Survey can be addressed to Isabel Brizuela at isabel.brizuela@dal.frb.org.
Sign up for our email alert to be automatically notified as soon as the latest Texas Service Sector Outlook Survey is released on the web.