Texas Service Sector Activity Accelerates in October

Texas Service Sector Outlook Survey
Texas Service Sector Activity Accelerates in October
For this month’s survey, Texas business executives were asked supplemental questions on labor market and credit conditions. Results for these questions from the Texas Manufacturing Outlook Survey, Texas Service Sector Outlook Survey and Texas Retail Outlook Survey have been released together. Read the special questions results.
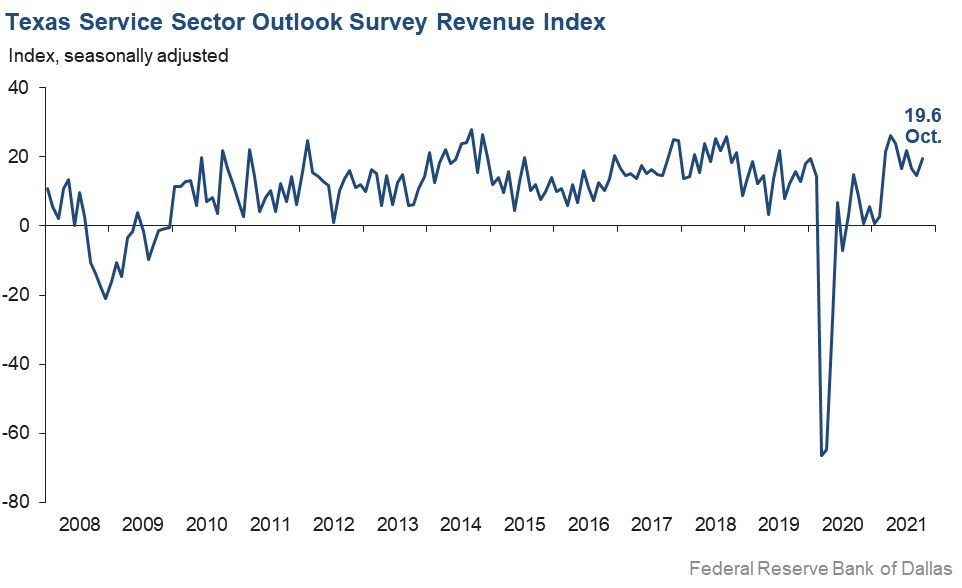
The Texas service sector’s pace of growth picked up in October, according to business executives responding to the Texas Service Sector Outlook Survey. The revenue index, a key measure of state service sector conditions, increased from 14.5 in September to 19.6 in October.
Labor market indicators suggest a significant acceleration in hiring and lengthening of average hours worked this month. The employment index increased five points to 14.2, and the part-time employment index rose from 4.6 to 6.7. The hours worked index surged nearly nine points to 14.0, with 17.5 percent of respondents noting more hours worked by their employees on average.
Perceptions of broader business conditions improved significantly in October. The general business activity index rose from 8.3 to 20.7, while the company outlook index picked up nearly eight points to 13.6. The outlook uncertainty index fell from 19.6 to 12.5—a reading that suggests uncertainty is still increasing but at a slower pace.
Wage and price pressures rose in October to extremely high levels. The wages and benefits index increased to 34.7, a record high in the survey’s 14-year history. The selling prices index rose to 22.7, while the input prices index climbed to 47.0—its highest reading since 2008.
Respondents’ expectations regarding future business activity were more positive compared with September. The future general business activity index rose slightly from 24.4 to 32.8, while the future revenue index increased to a five-month high of 56.1. Other future service sector activity indexes such as employment and capital expenditures increased in October, indicating that firms expect activity to rise further through early 2022.

Texas Retail Outlook Survey
Texas Retail Sales Slump
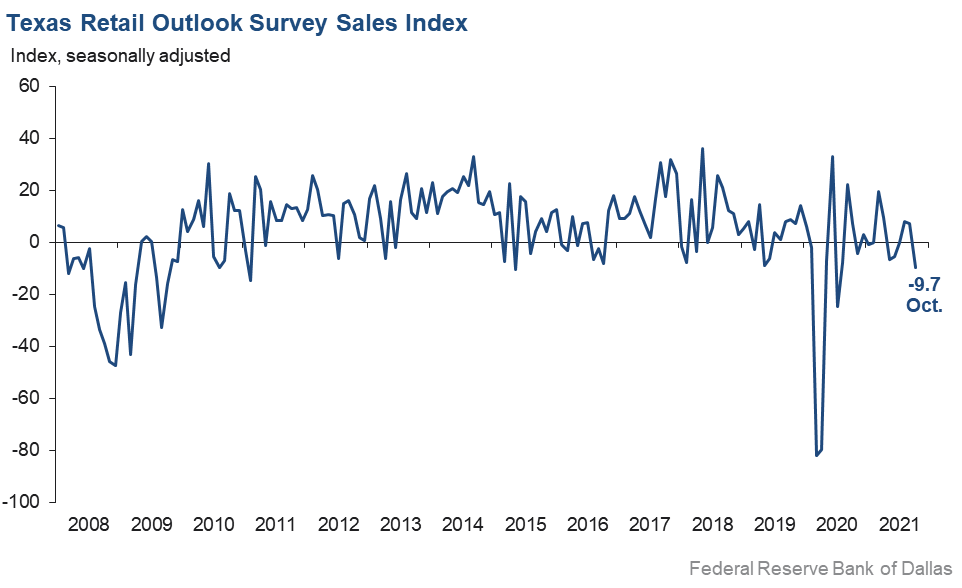
Retail sales activity declined in October, reversing after two months of growth, according to business executives responding to the Texas Retail Outlook Survey. The sales index, a key measure of state retail activity, dropped from 7.3 in September to -9.7 in October. Firms saw a new decline in inventories as well, with the inventories index reversing course from September to plummet nearly 21 points to -9.0.
Retail labor market indicators were mixed in October, as hiring was flat, but average hours worked continued to rise. The employment index dropped from 8.4 to 0, suggesting no net change in employment levels, while the hours worked index was largely unchanged at 9.6, a pandemic-era high. This suggests that retailers on net were not hiring new employees, but that existing employees were working more hours on average.
Retailers’ perceptions of broader business conditions became slightly pessimistic in October. The general business activity index fell from 10.0 to 1.6, while the company outlook index dipped into negative territory at -2.2. Nevertheless, the outlook uncertainty index declined to 8.5, with just 17.0 percent of respondents noting increased uncertainty compared with 27.0 percent last month.
Retail price pressures remained highly elevated in October, while wage pressures accelerated. The selling prices index slipped five points to 45.5—still near a record-high level—while the input prices index rose from 50.1 to 56.3. The wages and benefits index spiked nearly 14 points to 38.3, near the survey’s record high.
While current indicators suggest some weakness in retail, expectations for future activity picked up. The future general business activity index increased from 13.1 to 16.0, while the future sales index added nearly 17 points, rising to 44.6. Other indexes of future retail activity were more mixed, with expectations for hiring pulling back but future capital expenditures and other measures of activity suggesting steady growth in activity going into 2022.
The Texas Retail Outlook Survey is a component of the Texas Service Sector Outlook Survey that uses information only from respondents in the retail and wholesale sectors.
Next release: November 30, 2021
Data were collected October 12–20, and 280 Texas service sector business executives, of which 48 were retailers, responded to the survey. The Dallas Fed conducts the Texas Service Sector Outlook Survey monthly to obtain a timely assessment of the state’s service sector activity. Firms are asked whether revenue, employment, prices, general business activity and other indicators increased, decreased or remained unchanged over the previous month.
Survey responses are used to calculate an index for each indicator. Each index is calculated by subtracting the percentage of respondents reporting a decrease from the percentage reporting an increase. When the share of firms reporting an increase exceeds the share reporting a decrease, the index will be greater than zero, suggesting the indicator has increased over the prior month. If the share of firms reporting a decrease exceeds the share reporting an increase, the index will be below zero, suggesting the indicator has decreased over the prior month. An index will be zero when the number of firms reporting an increase is equal to the number of firms reporting a decrease. Data have been seasonally adjusted as necessary.
Texas Service Sector Outlook Survey
Historical data are available from January 2007 to the most current release month.
| Business Indicators Relating to Facilities and Products in Texas Current (versus previous month) | ||||||||
| Indicator | Oct Index | Sep Index | Change | Series Average | Trend* | % Reporting Increase | % Reporting No Change | % Reporting Decrease |
Revenue | 19.6 | 14.5 | +5.1 | 11.1 | 15(+) | 35.7 | 48.1 | 16.1 |
Employment | 14.2 | 9.2 | +5.0 | 6.2 | 15(+) | 24.7 | 64.8 | 10.5 |
Part‒Time Employment | 6.7 | 4.6 | +2.1 | 1.4 | null | 10.4 | 85.9 | 3.7 |
Hours Worked | 14.0 | 5.6 | +8.4 | 2.6 | 14(+) | 17.5 | 79.0 | 3.5 |
Wages and Benefits | 34.7 | 26.9 | +7.8 | 14.4 | 17(+) | 37.1 | 60.5 | 2.4 |
Input Prices | 47.0 | 42.9 | +4.1 | 25.5 | 18(+) | 49.1 | 48.8 | 2.1 |
Selling Prices | 22.7 | 20.2 | +2.5 | 5.8 | 15(+) | 25.3 | 72.1 | 2.6 |
Capital Expenditures | 12.1 | 12.4 | –0.3 | 9.7 | 14(+) | 17.2 | 77.7 | 5.1 |
| General Business Conditions Current (versus previous month) | ||||||||
| Indicator | Oct Index | Sep Index | Change | Series Average | Trend** | % Reporting Improved | % Reporting No Change | % Reporting Worsened |
Company Outlook | 13.6 | 5.9 | +7.7 | 5.5 | 15(+) | 24.1 | 65.4 | 10.5 |
General Business Activity | 20.7 | 8.3 | +12.4 | 3.7 | 9(+) | 28.9 | 62.9 | 8.2 |
| Indicator | Oct Index | Sep Index | Change | Series Average | Trend* | % Reporting Increase | % Reporting No Change | % Reporting Decrease |
Outlook Uncertainty† | 12.5 | 19.6 | –7.1 | 11.0 | 5(+) | 23.9 | 64.7 | 11.4 |
| Business Indicators Relating to Facilities and Products in Texas Future (six months ahead) | ||||||||
| Indicator | Oct Index | Sep Index | Change | Series Average | Trend* | % Reporting Increase | % Reporting No Change | % Reporting Decrease |
Revenue | 56.1 | 44.4 | +11.7 | 37.4 | 18(+) | 63.8 | 28.5 | 7.7 |
Employment | 41.5 | 36.2 | +5.3 | 22.4 | 18(+) | 48.9 | 43.7 | 7.4 |
Part‒Time Employment | 16.1 | 9.3 | +6.8 | 6.7 | null | 20.7 | 74.7 | 4.6 |
Hours Worked | 12.6 | 7.5 | +5.1 | 5.8 | 18(+) | 17.0 | 78.6 | 4.4 |
Wages and Benefits | 58.3 | 48.7 | +9.6 | 36.2 | 18(+) | 59.1 | 40.1 | 0.8 |
Input Prices | 49.6 | 53.1 | –3.5 | 43.5 | 178(+) | 52.5 | 44.6 | 2.9 |
Selling Prices | 38.2 | 34.3 | +3.9 | 23.2 | 18(+) | 43.5 | 51.2 | 5.3 |
Capital Expenditures | 30.6 | 27.7 | +2.9 | 23.3 | 17(+) | 36.3 | 58.0 | 5.7 |
| General Business Conditions Future (six months ahead) | ||||||||
| Indicator | Oct Index | Sep Index | Change | Series Average | Trend** | % Reporting Improved | % Reporting No Change | % Reporting Worsened |
Company Outlook | 30.1 | 23.8 | +6.3 | 16.9 | 15(+) | 37.6 | 54.9 | 7.5 |
General Business Activity | 32.8 | 24.4 | +8.4 | 14.1 | 15(+) | 40.0 | 52.8 | 7.2 |
Historical data are available from January 2007 to the most current release month.
| Business Indicators Relating to Facilities and Products in Texas Retail (versus previous month) | ||||||||
| Indicator | Oct Index | Sep Index | Change | Series Average | Trend* | % Reporting Increase | % Reporting No Change | % Reporting Decrease |
| Retail Activity in Texas | ||||||||
Sales | –9.7 | 7.3 | –17.0 | 5.4 | 1(–) | 21.0 | 48.4 | 30.7 |
Employment | 0.0 | 8.4 | –8.4 | 1.8 | 1() | 14.5 | 71.0 | 14.5 |
Part‒Time Employment | 4.9 | 6.5 | –1.6 | –1.8 | 8(+) | 11.8 | 81.3 | 6.9 |
Hours Worked | 9.6 | 9.2 | +0.4 | –1.9 | 3(+) | 17.9 | 73.8 | 8.3 |
Wages and Benefits | 38.3 | 24.6 | +13.7 | 9.6 | 15(+) | 44.6 | 49.1 | 6.3 |
Input Prices | 56.3 | 50.1 | +6.2 | 20.4 | 18(+) | 58.2 | 39.9 | 1.9 |
Selling Prices | 45.5 | 50.4 | –4.9 | 11.9 | 17(+) | 52.9 | 39.7 | 7.4 |
Capital Expenditures | 5.9 | 10.6 | –4.7 | 7.7 | 9(+) | 14.2 | 77.5 | 8.3 |
Inventories | –9.0 | 11.8 | –20.8 | 1.9 | 1(–) | 21.9 | 47.2 | 30.9 |
| Companywide Retail Activity | ||||||||
Companywide Sales | 0.7 | 10.7 | –10.0 | 7.0 | 8(+) | 26.5 | 47.7 | 25.8 |
Companywide Internet Sales | –4.3 | –8.0 | +3.7 | 5.8 | 2(–) | 14.8 | 66.1 | 19.1 |
| General Business Conditions, Retail Current (versus previous month) | ||||||||
| Indicator | Oct Index | Sep Index | Change | Series Average | Trend** | % Reporting Improved | % Reporting No Change | % Reporting Worsened |
Company Outlook | –2.2 | 2.4 | –4.6 | 3.5 | 1(–) | 13.9 | 70.0 | 16.1 |
General Business Activity | 1.6 | 10.0 | –8.4 | –0.1 | 8(+) | 14.3 | 73.0 | 12.7 |
| Outlook Uncertainty Current (versus previous month) | ||||||||
| Indicator | Oct Index | Sep Index | Change | Series Average | Trend* | % Reporting Increase | % Reporting No Change | % Reporting Decrease |
Outlook Uncertainty† | 8.5 | 20.8 | –12.3 | 9.1 | 5(+) | 17.0 | 74.5 | 8.5 |
| Business Indicators Relating to Facilities and Products in Texas, Retail Future (six months ahead) | ||||||||
| Indicator | Oct Index | Sep Index | Change | Series Average | Trend* | % Reporting Increase | % Reporting No Change | % Reporting Decrease |
| Retail Activity in Texas | ||||||||
Sales | 44.6 | 28.0 | +16.6 | 32.7 | 18(+) | 55.7 | 33.2 | 11.1 |
Employment | 16.3 | 30.4 | –14.1 | 12.8 | 18(+) | 30.3 | 55.7 | 14.0 |
Part‒Time Employment | 17.4 | 10.8 | +6.6 | 1.5 | 15(+) | 24.2 | 68.9 | 6.8 |
Hours Worked | 8.3 | 7.1 | +1.2 | 3.0 | 18(+) | 16.6 | 75.1 | 8.3 |
Wages and Benefits | 48.5 | 47.8 | +0.7 | 28.0 | 18(+) | 50.0 | 48.5 | 1.5 |
Input Prices | 35.6 | 48.9 | –13.3 | 33.4 | 18(+) | 46.7 | 42.2 | 11.1 |
Selling Prices | 24.5 | 50.0 | –25.5 | 29.4 | 18(+) | 37.8 | 48.9 | 13.3 |
Capital Expenditures | 15.9 | 15.2 | +0.7 | 17.5 | 17(+) | 27.3 | 61.4 | 11.4 |
Inventories | 27.1 | 25.0 | +2.1 | 10.0 | 18(+) | 45.8 | 35.5 | 18.7 |
| Companywide Retail Activity | ||||||||
Companywide Sales | 50.1 | 32.1 | +18.0 | 31.3 | 18(+) | 60.2 | 29.7 | 10.1 |
Companywide Internet Sales | 36.1 | 20.0 | +16.1 | 22.7 | 19(+) | 41.7 | 52.8 | 5.6 |
| General Business Conditions, Retail Future (six months ahead) | ||||||||
| Indicator | Oct Index | Sep Index | Change | Series Average | Trend** | % Reporting Improved | % Reporting No Change | % Reporting Worsened |
Company Outlook | 18.7 | 18.8 | –0.1 | 17.7 | 18(+) | 30.0 | 58.7 | 11.3 |
General Business Activity | 16.0 | 13.1 | +2.9 | 13.4 | 15(+) | 28.1 | 59.8 | 12.1 |
*Shown is the number of consecutive months of expansion or contraction in the underlying indicator. Expansion is indicated by a positive index reading and denoted by a (+) in the table. Contraction is indicated by a negative index reading and denoted by a (–) in the table.
**Shown is the number of consecutive months of improvement or worsening in the underlying indicator. Improvement is indicated by a positive index reading and denoted by a (+) in the table. Worsening is indicated by a negative index reading and denoted by a (–) in the table.
†Added to survey in January 2018.
Data have been seasonally adjusted as necessary, with the exception of the outlook uncertainty index which does not yet have a sufficiently long time series to test for seasonality.
Texas Service Sector Outlook Survey
Texas Retail Outlook Survey
Texas Service Sector Outlook Survey
Comments from Survey Respondents
These comments are from respondents’ completed surveys and have been edited for publication.
- I feel the general level of business activity has increased and is looking good for the economy.
- The battles between the federal and state government regarding vaccination now go beyond education and health care and will affect most companies. The uncertainty to the business is added to the worsening of labor relations, when employees expect the company to take a stance or provide clearer guidelines that are available. It is a strange state of affairs, where it is hard to see the benefits to the health of the economy or the country. Add in the battles on budgets and federal debt, and one may wonder how to make business decisions for the future in this environment.
- Staffing and attendance are problems.
- Inflation, backorders for parts, and a tough labor market have increased my concerns about the future.
- I lease trailers, and they cost double today what they used to in first quarter 2021. Trailer rental demand has increased, but in order to increase my capacity, I have to double my expenses when my rates did not increase more than 10 percent. Worse, I can’t buy more trailers now, because I do not know if the demand will remain the same in the next three years.
- The biggest threat to companies along the border is the continuous attacks from the Mexican president to the energy-related businesses. It is against the USMCA [U.S.–Mexico–Canada Agreement] and, therefore, decreases the investments on the U.S. side of the border. All of the infrastructure already built may become obsolete if the private companies are forbidden to import oil-related products into Mexico.
- We are seeing more and more delays at ocean ports.
- We have a fairly stable outlook for the very short term and are expecting some growth in 2022 in wages, revenue and cost to provide our services.
- Generally the same with inflation, more hiring challenges and Delta COVID causing, hopefully, more just short- or mid-term concerns.
- Revenue: Buyers are more cautious and the levels of due diligence to ensure purchasing decisions are "bought into" by multiple executives has increased, which has lengthened the sales process and makes the sales process more costly. In addition, very few buyers allow in-person meetings, which makes the sales process more lengthy and more difficult to ink new sales. Expenses: Inflation fears are widespread. Current clients are trying to lock in prices for longer terms as they renew contracts, and our management team is struggling with estimates on how high supplier prices, wages and benefits may go as we budget for next year. Talent: Outsourcing, including offshoring, for technology talent continues.
- With the loan fees from the Paycheck Protection Program (PPP) winding down and the paydown of loans being forgiven, revenue is down. Revenues are close to normalized. The uncertainty now on most customers’ and business owners’ minds is in reference to the turmoil at the government level. It has created a land rush in the rural markets that has driven the real estate markets two to three times higher. The real estate bubble has continued to go up, creating a concern for appraisal values being less than selling price as a reminder of the last bubble. This cycle seems to be stronger with so many buyers fleeing the metropolitan markets. This scramble to leave the city life has also created a reduction in inventory of houses within the city limits of many smaller communities. The taxable value of all properties has increased without an increase in rates, so tax revenue for public entities will still increase.
- We have seen a definite improvement in our business (supply of long-term capital to the commercial real estate markets) that is a function I think of property owners’ fear of rising interest rates next year but also some cyclical influences such as the state of the real estate financial markets five and 10 years ago and how this impacts the refinancing part of the business. I hear a lot of clients express concern (beyond the cost of capital) related to tax policy and also government mandates that could impact various segments of the commercial real estate market, most particularly the retail segment and some parts of the office segment. Absent the tax policy issue and changing government regulations, my outlook for what our business will be like in six months would be far more optimistic.
- The impediments to doing more business are less economic than they are bureaucratic and/or regulatory. There are too many people with too much power [who are] enabled to hamper business with no material consequences for doing so. Regulators, third-party report providers, surveyors and the like all limit the scope of their work to cut costs, placing the burden of innocence on us and our clients. This is sclerotic and must change.
- Supply-chain issues are beginning to impact us.
- Inflation does not appear to be as transitory as we are being told. Housing costs are climbing quickly. Consumer goods are rising as well. Oil and gas prices are also up with little expectation of a price correction. National debt is about to get out of control and the Federal Reserve’s balance sheet continues to balloon.
- Sales are about the same. It is hard to get workers—all want considerable increases over posted rates. Shortages of basic materials and supplies are beginning to hurt. Chemicals and related products are scarce, and there are considerable price increases.
- The lack of an available workforce is now forcing us to terminate some customers in order to maintain our service levels.
- Details around the new tax rates are creating uncertainty and making it difficult to plan or make defining choices in the short term.
- Labor shortage is universal. Supply-chain shortages slow all business.
- The construction time projections for build and finish-out of commercial space for my clients have been elongated or unknown. This is primarily due to supply-chain delays and shortage of labor teams/upcoming holidays.
- Supply restraints are what are restraining our company growth and profitability today.
- Conflicting COVID-19 policies/bans/mandates at the various levels of government make it very difficult to adopt workplace policies. This uncertainty creates an unhealthy business challenge/climate.
- Employees refuse to return to the office. We had a 56 percent turnover rate so far in 2021.
- We support nonprofits, and there is uncertainty at this time for the smaller and mid-sized organizations. Our six-month outlook remains positive because we have a strong relationship with a private foundation in the [Rio Grande] Valley who has asked us to submit a substantial proposal for capacity building in that area. If we get that contract, we will be fine, but we are noticing that some organizations are having to prioritize where the dollars go with a much keener lens these days.
- The volume of business in the real estate market continues to increase with no end in sight. We continue to set records in both revenue and volume but will see what happens once the new capital gains rate is put in place.
- We continue to stay busy and booked with trials and proceedings as courts continue to work through the deep COVID-related backlog. We believe it will take through the end of 2022 to catch up.
- Revenue for our company more than doubled from the second to third quarter. Inventory is our biggest challenge right now, but if we get our hands on it, it’s almost like pre-2008 as far as selling conditions.
- Price increases in all aspects of the business have had a negative effect. Not all price increases can be recovered without losing customers. There are still too many office buildings that have not reopened. There are opportunities, but they are slow to develop as decision-makers are covering more areas and being spread thin.
- Supply chain, supply chain, supply chain. Our customers cannot get the raw materials and parts they need to complete their projects, which in turn affects when we get their completed parts to inspect prior to delivery to the customer. Corporate aviation utilization is down for the last two months—not quite sure where that is headed. DOD’s [Department of Defense] subtler work is being postponed at the current time. No reason was given. Industrial-sector customers are seeing an increase in demand for fabrication due to wear and tear on the existing items, but with the lack of replacement parts, delivery is becoming harder and turn times are increasing into months not weeks.
- COVID declining improves our outlook. We are expecting general activity to continue to improve and remain robust.
- Fuel costs will have a negative impact on a number of things within our organization. Supply issues remain as well as supply costs. The dynamic nature of the prices of all things is making it difficult.
- The labor shortage is now critical. We are short of filling more than 20 percent of the full-time positions we have. Moreover, we are seeing departures from our current employee rolls, who were probably lured away for higher pay. A few took early retirement. Nevertheless, there are no replacements available.
- Conditions continue to improve as a result of PPP forgiveness, increased volumes and price increases. Supply-chain/logistics issues and staffing remain a concern but do not appear to be major threats.
- We are experiencing a lack of job applicants.
- Employment continues to be challenging. Individuals we interview leave after only a few days on the job, if they show up at all. Quality of applicants—entry-level positions in low-tech manufacturing—is certainly not stellar. We would like to consider moving into AI [artificial intelligence] applications to avoid this ongoing employment issue, which could be around for quite some time. But the AI issue could be cost-prohibitive. It may be worth investigating for the long run.
- We are seeing productivity losses with our employees. We are not as efficient as we were 18 months ago before the pandemic. We are paying more, and we have more work, but we are making less money due to labor efficiency. We raised wages 19 percent and prices 17.5 percent, but we are concerned about labor productivity. We are looking at more automation to reduce labor costs. And health care is significantly up.
- We are concerned about stagflation.
- We are shifting more toward a virtual mode from live mode in the delivery of our programs. Also, we are refreshing our legacy program offerings and developed a new program altogether. So, we are in a transition period that will take at least through next year to see how well our offerings are accepted with stakeholders.
- We are in the midst of the Great Resignation; impacts both the new and older generation; too much time on analysis; often leads to paralysis; desperate need for accuracy, not estimation!
- The potential vaccine mandate impacts approximately 30 of my younger employees, most of whom have recovered from COVID and have natural immunity. Vaccine reluctance is compounded by the fact one of our 23-year-old employees had a serious reaction that could have been fatal. Payroll expenses are skyrocketing, as we try to fill positions in a scarce market. Our professional group is unable to hire additional radiologists and is in the process of terminating one of their professional contracts. The labor shortage is of paramount importance, and a vaccine mandate, if adopted, will leave us mortally wounded.
- The biggest challenge continues to be staffing (human resources), even in the health care sector. A significantly higher percentage of clinical nursing staff (who actually take care of patients and not do administrative work) have cut back or retired during the COVID period. This created a shortage even before this entire vaccine issue has created a division amongst the "must vaccine" and "never vaccine" group even among highly educated clinicians, which has taken a life of its own beyond any reasoning.
- We cannot hire staff as no one is applying or wanting to work. Prior to COVID, we paid our certified nurse aides $12 per hour. Now, we are paying $18 per hour, a 50 percent increase, and we still cannot attract or hire. This has become a very critical issue for the ongoing survivability of our nursing home. In my 26 years in this business I've never seen the labor markets this bad (both in terms of availability and increased wages). And on top of it, the Biden administration's vaccine mandate is making the health care labor market even worse. People in government don't know what they are doing to those working on the front line of health care with their edicts from on high.
- Ongoing, burdensome COVID regulations placed on health care organizations are taking their toll on expenses and amplifying the staffing challenges we are already facing. In addition, the massive increase in insurance costs—health, as well as property and liability—due to COVID and from the major storms of 2020, have put extreme and overwhelming strain on top of the inflationary costs of goods we are already experiencing.
- There have been so many changes, and with political issues, COVID and the overall climate in foster care, the industry is extremely volatile. This makes the ability to project even worse.
- Supply-change disruptions are a concern.
- We face government uncertainty and lack of an understanding on how businesses operate from our government officials. Their policies are harming the business climate.
- The storm in September caused issues with no revenue for three days. I have applied for the SBA EIDL [Small Business Administration’s Economic Injury Disaster Loan] increase and at first was denied (because they didn't think I could pay it back). I did not get an EIDL loan during Hurricane Harvey for the same reason, and I am still standing in business almost eight years and need affordable money to borrow, not loan shark money, which is why my balance sheet has a story. If you add up the amount of the SBA loan payment, it is 40 percent less than what I am paying today.
- If office workers return to their offices in January, we will open for lunch. If not, we won’t be able to.
- Supply chain, labor and meat prices have been very challenging.
- Our supply chain is a concern but also the volatility in prices.
- Business travel and entertaining continue to be our largest revenue challenge. Hiring and retaining staff continues to be our main operational challenge, and we continue to turn away business because we cannot adequately staff in spite of increased wages paired with our already-generous benefits.
- Business is returning, but cost of goods is growing rapidly.
- A vaccine mandate could be unsettling for a large percentage of our workforce.
- The outlook continues to improve here, and that sense of optimism should continue as long as COVID hospitalizations/deaths continue to decline. The uncertainty and confusion surrounding the vaccines isn't helping, however.
- An open border with closed ports will not grow the economy.
- With regard to logistics, it is very hard to understand what is going to happen. Will the bottleneck be resolved? Or will it compound? Most fingers point in the direction of compounding as this is not just a port traffic issue; it has to do with over-the-road truck availability, warehousing, railroad capacity, etc. You can’t invoice what you can’t ship.
- We see runaway price increases in all commodities, driving increases in revenues, selling prices and inventory. We are having trouble attracting and retaining employees, which is creating wage increases across the board. Margins are suffering, and we are having difficulty raising selling prices fast enough.
- We continue to see hiring difficulties and are losing employees to other wage offers that are higher than their current pay. Our new-vehicle inventory is at an all-time low, and used-car prices continue to rise to a point that they are encroaching on new-vehicle prices.
- New-car inventories are still very short on parts, and they are also very hard to obtain from the original equipment manufacturers.
- We are facing supply-chain issues.
- New and used inventory remains a problem. Demand continues to exceed supply. The chip shortage impacting our industry should improve gradually over the next six months but will remain a problem for the next 12 months if demand continues at the current level.
- Chip and other supply-chain problems have severely impacted the automobile business.
- Finding new employees remains our No. 1 issue. Supply chain appeared to be getting better but has taken a turn for the worse. Pricing seems to show signs of increasing, along with lead times. No calm water ahead that I see. Batten down the hatch as rough waters are on the horizon. This is not fun for management and is stressful on employees.
Historical Data
Historical data can be downloaded dating back to January 2007.
Indexes
Download indexes for all indicators. For the definitions of all variables, see Data Definitions.
Texas Service Sector Outlook Survey |
Texas Retail Outlook Survey |
| Unadjusted | Unadjusted |
| Seasonally adjusted | Seasonally adjusted |
All Data
Download indexes and components of the indexes (percentage of respondents reporting increase, decrease, or no change). For the definitions of all variables, see Data Definitions.
Texas Service Sector Outlook Survey |
Texas Retail Outlook Survey |
| Unadjusted | Unadjusted |
| Seasonally adjusted | Seasonally adjusted |
Questions regarding the Texas Service Sector Outlook Survey can be addressed to Christopher Slijk at christopher.slijk@dal.frb.org.
Sign up for our email alert to be automatically notified as soon as the latest Texas Service Sector Outlook Survey is released on the web.