Texas Service Sector Growth Moderates in December

Texas Service Sector Outlook Survey
Texas Service Sector Growth Moderates in December
For this month’s survey, Texas business executives were asked supplemental questions on wages, prices and revenue restraints. Results for these questions from the Texas Manufacturing Outlook Survey, Texas Service Sector Outlook Survey and Texas Retail Outlook Survey have been released together. Read the special questions results.
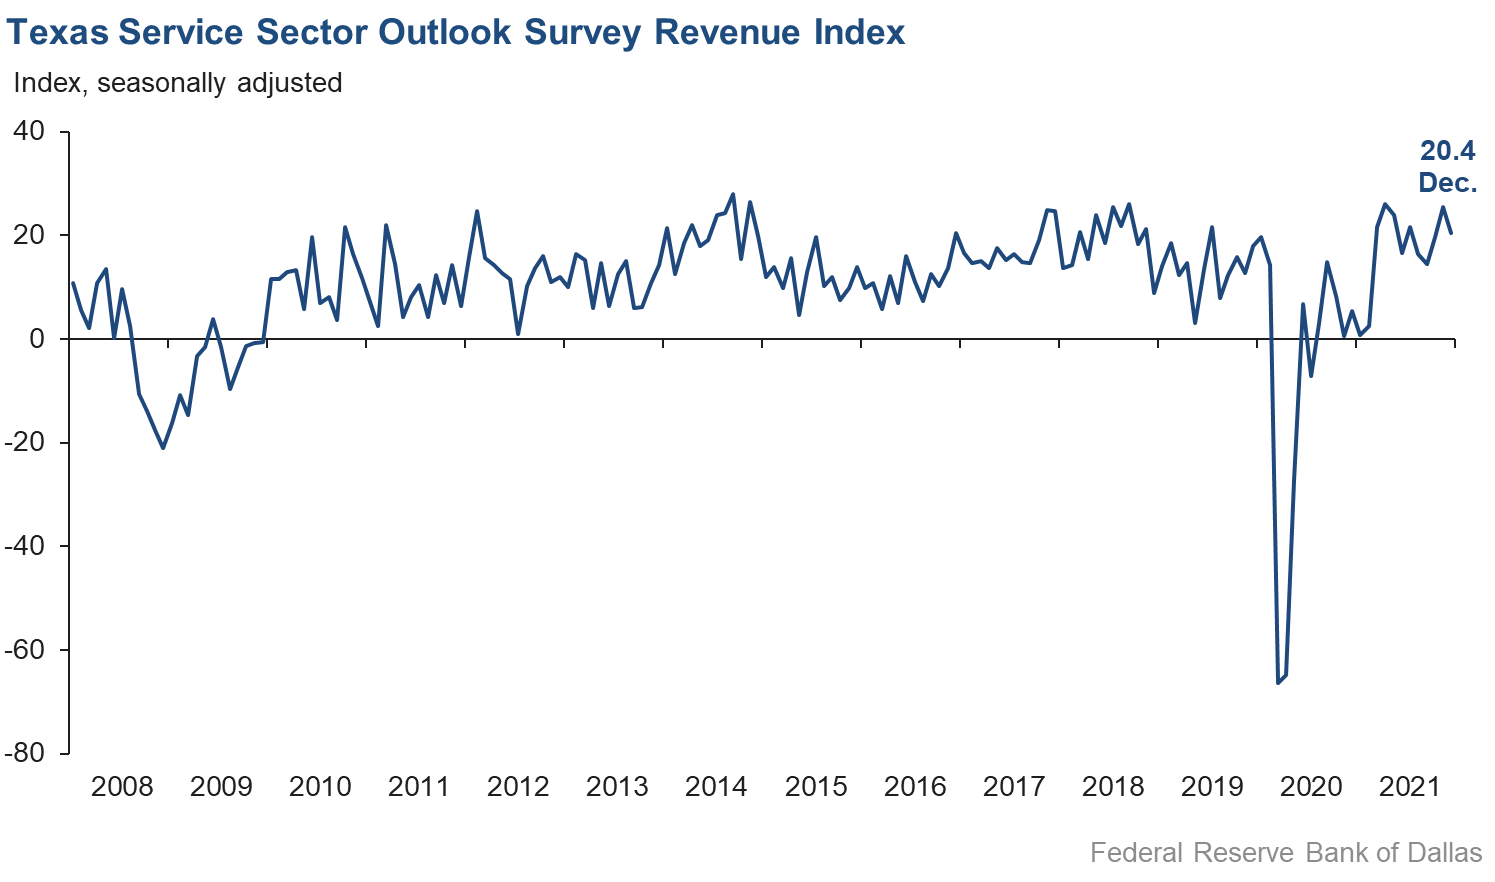
The Texas service sector’s pace of growth slowed in December, according to business executives responding to the Texas Service Sector Outlook Survey. The revenue index, a key measure of state service sector conditions, fell from 25.4 in November to 20.4 in December.
Labor market indicators suggest continued growth in hiring and hours worked. The employment index declined from 12.9 in November to 10.7 in December, while the part-time employment index weakened four points to 5.8. The hours worked index moderated from 13.3 to 10.2.
Perceptions of broader business conditions continued to improve in December, though at a slower pace compared with November. The general business activity index fell 10 points to 12.9, while the company outlook index declined from 16.8 to 13.7. Uncertainty persisted, though the outlook uncertainty index dipped from 13.0 to 10.5.
Wages and prices continued to increase in December, with indexes at or near historically high levels. The wages and benefits index was roughly unchanged at a record 35.4. The selling prices index edged down two points to 27.4, while the input prices index decreased from 51.8 to 47.8.
Respondents’ expectations regarding future business activity remained solidly positive, but optimism moderated slightly compared with October. The future general business activity index fell from 30.0 to 21.9, while the future revenue index dipped one point to 53.3. Other future service sector activity indexes such as employment and capital expenditures were mixed but remained strongly positive.

Texas Retail Outlook Survey
Growth in Texas Retail Sales Slows in December
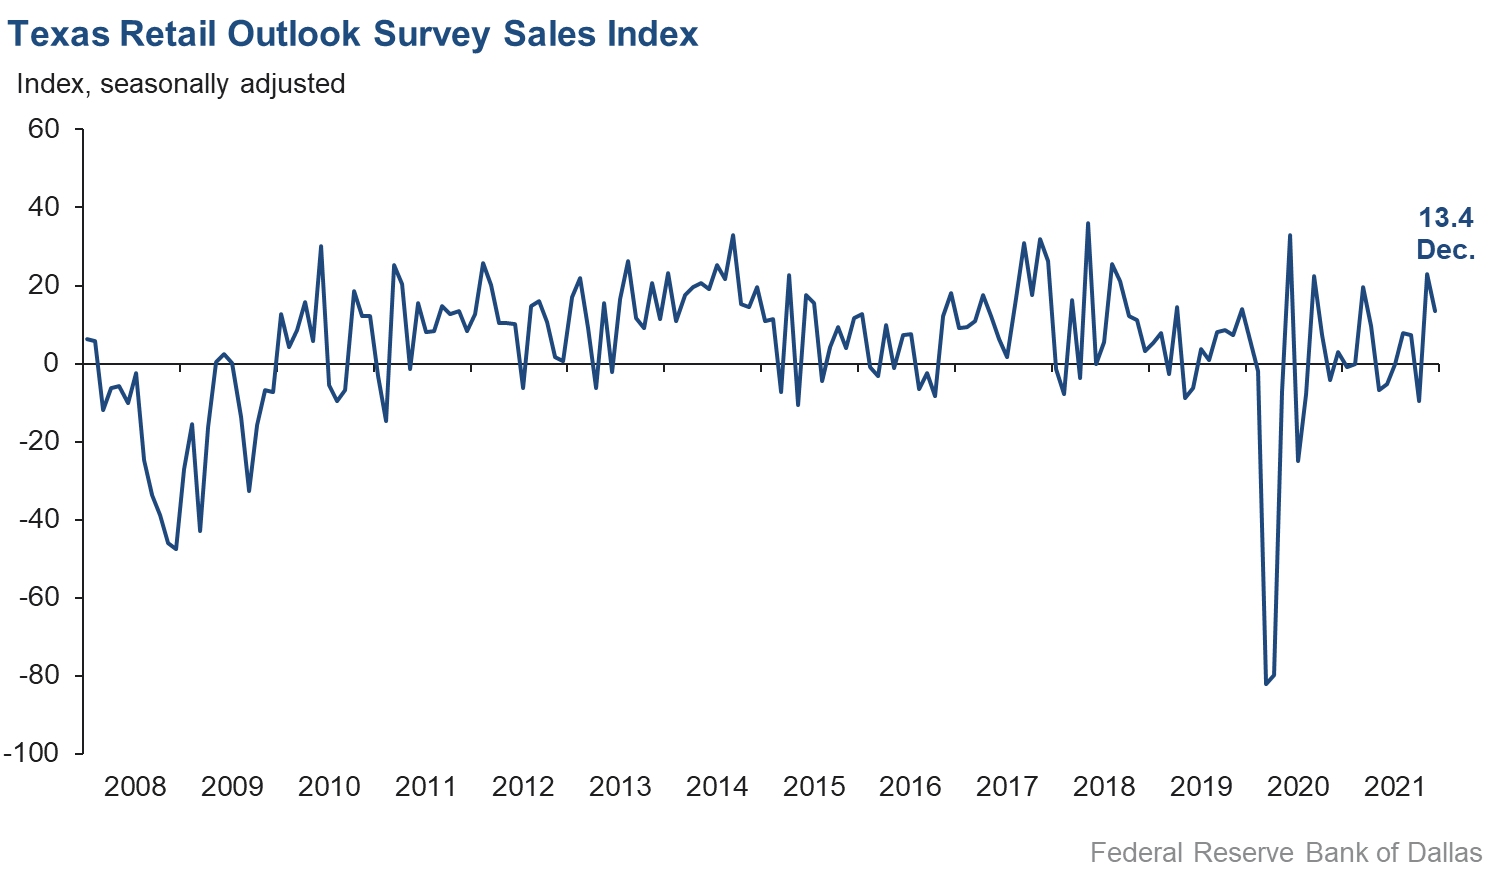
Retail sales activity grew at a slower pace than in November, according to business executives responding to the Texas Retail Outlook Survey. The sales index, a key measure of state retail activity, fell from 23.0 in November to 13.4 in December, still well above its annual average of 4.8. Firms continued to see a net build of inventories as the index picked up from 10.6 to 15.1—its highest reading in nearly three years.
Retail labor market indicators point to continued improvement in December. The employment index increased from 5.9 to 7.2, with 17 percent of respondents increasing their head count this month compared with 10 percent decreasing it. The hours worked index was roughly unchanged at 4.6.
Retailers’ perceptions of broader business conditions, though mixed, continued to suggest overall improvement. The general business activity index declined from 14.9 to 8.5, while the company outlook index added two points to rise to 14.6—its highest reading since April. Outlook uncertainty leveled off compared with last month, with the index falling from 16.0 to 2.4; the share of firms noting increased uncertainty fell from 20 percent in November to 10 percent.
Retail price and wage pressures eased in December, though the indexes remained elevated. The selling prices index declined 14 points from an all-time high to 45.6, while the input prices index fell 22 points to 44.3. The wages and benefits index dipped four points to 40.5.
Expectations for future retail activity remained robust. The future general business activity index fell from 18.3 to 10.6, while the future sales index increased eight points to 44.2. Other indexes of future retail activity remained strongly positive, suggesting stronger activity going into 2022.
The Texas Retail Outlook Survey is a component of the Texas Service Sector Outlook Survey that uses information only from respondents in the retail and wholesale sectors.
Next release: February 1, 2022
Data were collected December 13–21, and 264 Texas service sector business executives, of which 43 were retailers, responded to the survey. The Dallas Fed conducts the Texas Service Sector Outlook Survey monthly to obtain a timely assessment of the state’s service sector activity. Firms are asked whether revenue, employment, prices, general business activity and other indicators increased, decreased or remained unchanged over the previous month.
Survey responses are used to calculate an index for each indicator. Each index is calculated by subtracting the percentage of respondents reporting a decrease from the percentage reporting an increase. When the share of firms reporting an increase exceeds the share reporting a decrease, the index will be greater than zero, suggesting the indicator has increased over the prior month. If the share of firms reporting a decrease exceeds the share reporting an increase, the index will be below zero, suggesting the indicator has decreased over the prior month. An index will be zero when the number of firms reporting an increase is equal to the number of firms reporting a decrease. Data have been seasonally adjusted as necessary.
Texas Service Sector Outlook Survey
Historical data are available from January 2007 to the most current release month.
| Business Indicators Relating to Facilities and Products in Texas Current (versus previous month) | ||||||||
| Indicator | Dec Index | Nov Index | Change | Series Average | Trend* | % Reporting Increase | % Reporting No Change | % Reporting Decrease |
Revenue | 20.4 | 25.4 | –5.0 | 11.2 | 17(+) | 35.6 | 49.2 | 15.2 |
Employment | 10.7 | 12.9 | –2.2 | 6.3 | 17(+) | 20.0 | 70.7 | 9.3 |
Part–Time Employment | 5.8 | 9.8 | –4.0 | 1.4 | 13(+) | 10.5 | 84.8 | 4.7 |
Hours Worked | 10.2 | 13.3 | –3.1 | 2.7 | 16(+) | 13.6 | 83.0 | 3.4 |
Wages and Benefits | 35.4 | 35.1 | +0.3 | 14.7 | 19(+) | 36.2 | 63.0 | 0.8 |
Input Prices | 47.8 | 51.8 | –4.0 | 25.8 | 20(+) | 49.0 | 49.8 | 1.2 |
Selling Prices | 27.4 | 29.7 | –2.3 | 6.0 | 17(+) | 30.6 | 66.2 | 3.2 |
Capital Expenditures | 16.4 | 19.9 | –3.5 | 9.8 | 16(+) | 20.4 | 75.6 | 4.0 |
| General Business Conditions Current (versus previous month) | ||||||||
| Indicator | Dec Index | Nov Index | Change | Series Average | Trend** | % Reporting Improved | % Reporting No Change | % Reporting Worsened |
Company Outlook | 13.7 | 16.8 | –3.1 | 5.6 | 17(+) | 22.3 | 69.2 | 8.6 |
General Business Activity | 12.9 | 22.7 | –9.8 | 3.9 | 11(+) | 21.6 | 69.7 | 8.7 |
| Indicator | Dec Index | Nov Index | Change | Series Average | Trend* | % Reporting Increase | % Reporting No Change | % Reporting Decrease |
Outlook Uncertainty† | 10.5 | 13.0 | –2.5 | 11.0 | 7(+) | 19.9 | 70.7 | 9.4 |
| Business Indicators Relating to Facilities and Products in Texas Future (six months ahead) | ||||||||
| Indicator | Dec Index | Nov Index | Change | Series Average | Trend* | % Reporting Increase | % Reporting No Change | % Reporting Decrease |
Revenue | 53.3 | 54.4 | –1.1 | 37.6 | 20(+) | 57.6 | 38.1 | 4.3 |
Employment | 41.2 | 45.0 | –3.8 | 22.6 | 20(+) | 46.1 | 49.0 | 4.9 |
Part–Time Employment | 14.5 | 16.2 | –1.7 | 6.8 | 19(+) | 18.0 | 78.5 | 3.5 |
Hours Worked | 12.1 | 13.3 | –1.2 | 5.9 | 20(+) | 15.1 | 81.9 | 3.0 |
Wages and Benefits | 55.5 | 55.2 | +0.3 | 36.4 | 20(+) | 56.1 | 43.3 | 0.6 |
Input Prices | 57.4 | 59.6 | –2.2 | 43.7 | 180(+) | 58.0 | 41.4 | 0.6 |
Selling Prices | 43.4 | 46.6 | –3.2 | 23.5 | 20(+) | 46.5 | 50.4 | 3.1 |
Capital Expenditures | 35.5 | 34.4 | +1.1 | 23.4 | 19(+) | 39.8 | 55.9 | 4.3 |
| General Business Conditions Future (six months ahead) | ||||||||
| Indicator | Dec Index | Nov Index | Change | Series Average | Trend** | % Reporting Improved | % Reporting No Change | % Reporting Worsened |
Company Outlook | 20.2 | 26.2 | –6.0 | 17.0 | 17(+) | 30.5 | 59.2 | 10.3 |
General Business Activity | 21.9 | 30.0 | –8.1 | 14.2 | 17(+) | 31.8 | 58.3 | 9.9 |
Historical data are available from January 2007 to the most current release month.
| Business Indicators Relating to Facilities and Products in Texas Retail (versus previous month) | ||||||||
| Indicator | Dec Index | Nov Index | Change | Series Average | Trend* | % Reporting Increase | % Reporting No Change | % Reporting Decrease |
| Retail Activity in Texas | ||||||||
Sales | 13.4 | 23.0 | –9.6 | 5.6 | 2(+) | 33.0 | 47.5 | 19.6 |
Employment | 7.2 | 5.9 | +1.3 | 1.8 | 2(+) | 17.5 | 72.2 | 10.3 |
Part–Time Employment | 7.4 | 9.6 | –2.2 | –1.7 | 10(+) | 16.7 | 74.0 | 9.3 |
Hours Worked | 4.6 | 4.3 | +0.3 | –1.8 | 5(+) | 12.8 | 79.0 | 8.2 |
Wages and Benefits | 40.5 | 44.5 | –4.0 | 10.0 | 17(+) | 43.3 | 53.9 | 2.8 |
Input Prices | 44.3 | 65.9 | –21.6 | 20.8 | 20(+) | 48.9 | 46.5 | 4.6 |
Selling Prices | 45.6 | 59.5 | –13.9 | 12.4 | 19(+) | 48.3 | 49.0 | 2.7 |
Capital Expenditures | 5.2 | 24.3 | –19.1 | 7.8 | 11(+) | 9.9 | 85.4 | 4.7 |
Inventories | 15.1 | 10.6 | +4.5 | 2.1 | 2(+) | 29.5 | 56.1 | 14.4 |
| Companywide Retail Activity | ||||||||
Companywide Sales | 20.3 | 24.1 | –3.8 | 7.2 | 10(+) | 35.6 | 49.1 | 15.3 |
Companywide Internet Sales | 14.9 | 10.0 | +4.9 | 5.9 | 2(+) | 21.6 | 71.7 | 6.7 |
| General Business Conditions, Retail Current (versus previous month) | ||||||||
| Indicator | Dec Index | Nov Index | Change | Series Average | Trend** | % Reporting Improved | % Reporting No Change | % Reporting Worsened |
Company Outlook | 14.6 | 12.5 | +2.1 | 3.7 | 2(+) | 17.3 | 80.0 | 2.7 |
General Business Activity | 8.5 | 14.9 | –6.4 | 0.1 | 10(+) | 16.0 | 76.5 | 7.5 |
| Outlook Uncertainty Current (versus previous month) | ||||||||
| Indicator | Dec Index | Nov Index | Change | Series Average | Trend* | % Reporting Increase | % Reporting No Change | % Reporting Decrease |
Outlook Uncertainty† | 2.4 | 16.0 | –13.6 | 9.1 | 7(+) | 9.5 | 83.3 | 7.1 |
| Business Indicators Relating to Facilities and Products in Texas, Retail Future (six months ahead) | ||||||||
| Indicator | Dec Index | Nov Index | Change | Series Average | Trend* | % Reporting Increase | % Reporting No Change | % Reporting Decrease |
| Retail Activity in Texas | ||||||||
Sales | 44.2 | 36.7 | +7.5 | 32.8 | 20(+) | 50.2 | 43.8 | 6.0 |
Employment | 33.1 | 27.1 | +6.0 | 13.0 | 20(+) | 40.1 | 52.9 | 7.0 |
Part–Time Employment | 15.0 | 12.4 | +2.6 | 1.6 | 17(+) | 19.1 | 76.8 | 4.1 |
Hours Worked | 4.8 | 8.1 | –3.3 | 3.0 | 20(+) | 13.6 | 77.6 | 8.8 |
Wages and Benefits | 51.4 | 48.4 | +3.0 | 28.3 | 20(+) | 54.0 | 43.4 | 2.6 |
Input Prices | 48.9 | 52.4 | –3.5 | 33.6 | 20(+) | 51.2 | 46.5 | 2.3 |
Selling Prices | 44.2 | 45.2 | –1.0 | 29.6 | 20(+) | 51.2 | 41.9 | 7.0 |
Capital Expenditures | 23.3 | 27.5 | –4.2 | 17.6 | 19(+) | 32.6 | 58.1 | 9.3 |
Inventories | 35.8 | 19.6 | +16.2 | 10.2 | 20(+) | 45.2 | 45.5 | 9.4 |
| Companywide Retail Activity | ||||||||
Companywide Sales | 46.7 | 33.8 | +12.9 | 31.4 | 20(+) | 49.2 | 48.3 | 2.5 |
Companywide Internet Sales | 34.3 | 23.5 | +10.8 | 22.7 | 21(+) | 34.3 | 65.7 | 0.0 |
| General Business Conditions, Retail Future (six months ahead) | ||||||||
| Indicator | Dec Index | Nov Index | Change | Series Average | Trend** | % Reporting Improved | % Reporting No Change | % Reporting Worsened |
Company Outlook | 18.6 | 26.1 | –7.5 | 17.7 | 20(+) | 21.9 | 74.8 | 3.3 |
General Business Activity | 10.6 | 18.3 | –7.7 | 13.4 | 17(+) | 21.5 | 67.6 | 10.9 |
*Shown is the number of consecutive months of expansion or contraction in the underlying indicator. Expansion is indicated by a positive index reading and denoted by a (+) in the table. Contraction is indicated by a negative index reading and denoted by a (–) in the table.
**Shown is the number of consecutive months of improvement or worsening in the underlying indicator. Improvement is indicated by a positive index reading and denoted by a (+) in the table. Worsening is indicated by a negative index reading and denoted by a (–) in the table.
†Added to survey in January 2018.
Data have been seasonally adjusted as necessary, with the exception of the outlook uncertainty index which does not yet have a sufficiently long time series to test for seasonality.
Texas Service Sector Outlook Survey
Texas Retail Outlook Survey
Texas Service Sector Outlook Survey
Comments from Survey Respondents
These comments are from respondents’ completed surveys and have been edited for publication.
- Biden inflation is showing up in the cost of parts and oils we use in our business. Inflation alone means we have to increase our prices for labor and the selling prices on parts.
- Demand looks to remain steady into 2022. The cost of equipment is increasing as well as the cost of fuel.
- Demand continues to be high; in my business case (commercial trailer rentals), there is no equipment available for purchase at reasonable prices, and my rental rates cannot be increased. I can’t buy equipment at twice the price to lease at the same usual rates. These supply-chain issues will not subside until probably 2023 and until I can buy equipment at reasonable prices or be able to increase my rates. [Until then] everything will remain the same.
- Based on projections out of the Permian, we are expecting December to be near-record oil production that will make its way to the water in late December and January. Overall for 2022, we are expecting a better year in terms of shipments and revenue. We do, however, expect inflation to continue to pressure our costs, and we are both hiring and giving a 3.5 percent cost-of-living adjustment increase to our current employees, so we expect personnel costs to be higher in 2022.
- There are continued risks including international risks due to China, inflation and COVID.
- As the year comes to a close, we are hopeful for some economic stability next year. Prices are increasing rapidly. Wage increases are necessary yet will impact profitability significantly. We're floating price increases for 2022 with customers and prospects. The talent war is at full throttle. We have hired external firms to help with short-term projects and are near-shoring to supplement operational software coding development.
- Sales tax continues to increase gradually across the state and in our rural markets. The opening of the hunting season has played an important role in the increase in activity and is up substantially over last year. In our agriculture communities, the cotton crop has been providing strong yields and has reached some of the highest prices we have seen in many years. Real estate markets are at an all-time high—both for houses in town and raw farmland and ranchland. Brokers are very low on inventory for listings, and the days on the market are the shortest we have ever seen. As inflation and interest rate concerns begin to surface, the revenue projections for 2022 may have to be adjusted.
- Uncertainty is related to new or changes in government regulations, taxes and cost of capital that may impact our customers. In the short run, a fear of increasing cost of capital has caused a spike upward in our business.
- Inflation factors and how the Federal Reserve will manage through these issues remain uncertain. Supply-chain issues are still affecting every business customer we deal with, with no real end in sight. Benefits (health care costs) have increased by a double-digit percentage. Wages are increasing as competition for available employees increases.
- The challenge is to find qualified candidates who want to work and stay with a company for a career instead of a job. We can train people, but we need them to have the basic motivation to work.
- It is a tough time with employee wages—when you can find people that want a job. Maybe the available people will decide to come back to work. Sales are still soft due to oil and gas products and services.
- Generally, activity in our industry slows during December. We expect near-term COVID uncertainty to cause an even-slower month. However, once the current wave subsides, we expect the first and second quarters to be extremely busy.
- The spread of Omicron is of concern due to its impact on the business environment. As a financial services company, we are both impacted by and concerned with economic and investment market environments.
- A tight labor market and supply-chain disruptions are evident across all lines of business.
- Inflation making the news is causing us to reevaluate our cost-of-living wage increases; that, coupled with the COVID resurgence is causing us a little uncertainty as we watch those trends.
- The two biggest areas of uncertainty are: (1) the degree that the new variant impacts the overall economy; and (2) how long we experience inflation at rates exceeding 4 percent.
- Business seems to be stabilizing, and unless the new Omicron variant creates more issues, we think it will continue to stabilize as we move forward.
- Increasing the hourly wage for the lower-skilled employees has temporarily solved the low-end labor-supply issues. Our minimum wage is starting at $16 per hour plus benefits.
- The commercial real estate market is still on fire! We attributed most of this increase in business due to the possible increase in the capital gains rate in 2022, but our order count tells a different story. Our pipeline for 2022 is full, and we are not seeing the normal slowdown in orders for December. Now, if we can just avoid major inflation next year, we feel it will be another very strong year in the real estate business.
- The upsurge in the coronavirus is creating more anxiety about business prospects.
- 2021 will be our best-ever year by 15 percent or more. We are optimistic about 2022.
- Employee wages continue to rise versus the same services prior to COVID. We’ve given an estimated 15–20 percent higher wages, with a majority of potential employees working and asking for an even-higher wage in order to switch firms.
- The fourth quarter has seen much-improved economic conditions for consulting engineering.
- The outlook for six months from now is "hopeful" rather than having any concrete data that say it will get better.
- Construction pricing continues to be volatile and climbing. Workforce shortage continues. [There is] additional pressure on small businesses having to pay very competitive wages and benefits while not receiving a substantial increase in revenue.
- We expect 2022 to be even busier than 2021 and are currently hiring; we are planning a 20 percent increase in staff immediately.
- Cost and lack of employees have impacted our business.
- Demand for labor continues to increase, making securing talent for our client companies even harder and demand for our services even higher. At times in the past the challenge was securing jobs to fill; the challenge now is finding talent interested in the abundance of open jobs. Clients are increasing salary offers, increasing bonuses, adding signing bonuses, enhancing paid time off and benefits, improving flexibility—doing anything they can to secure the talent they need for the businesses.
- Wages and incentives for staff are now top priority, which impacts the bottom line. The level of luxury travel requests is down based upon news coverage of the new COVID-19 variant, and many trip cancellations are reported due to anxiety of travelers.
- Inflation and interest rate uncertainly are big concerns.
- It is still a very tight labor market.
- Cost increases and availability of products continue to create problems for our company and our customers. We are seeing increases in product costs from some vendors ranging from 8 percent to 40 percent. Products that had more than doubled in price during the 2019–20 year are still at pricing that is 40 percent greater than 2019.
- Financial hangover from quarantine continues to impact our operations for this fiscal year. Uncertainty is increased due to the Omicron variant.
- Heading into the end of yet another tough year, 2021; enough stress, Omicron reminded us we are not yet done; are we too demanding, to ask for soft landing? In 2022, hoping low inflation and boosters for everyone.
- Regarding increasing selling prices: In 2021 we offset input costs (PPE [personal protective equipment], lab costs, dental supply costs) by dropping "in-network" status with several insurance plans, thus increasing margins and revenue. With current inflation trends, we will offset higher costs (including the addition of higher-wage rates) by dropping most of the remaining "in-network" insurance plans (the two largest by number of patients enrolled); we will also increase by 5 percent list prices charged starting on Jan. 1, 2022, with a contingency of an additional increase starting June 30, 2022, if inflation doesn't stabilize.
- Government confusion about COVID continues to work against small business.
- All indicators are very strong for first quarter 2022. Only staffing and a significant new COVID-19 variant can prevent us from the anticipated growth in business.
- No surprises, the labor shortage and rising costs of labor and operating supplies are taking a majority of our profits. Bottom line is we are down 46 percent versus pre-COVID numbers, while sales are slightly up.
- Omicron is causing cancellations for regular business and private functions each day and increasing, especially for private functions. Going back to the office and business travel are also being put off, which worsens the situation.
- We are nervous about COVID again. Hoping that things remain at least the same for now is the idea. November was slower than expected, but it allowed for time to train a new workforce that seems to be coming back to work.
- Food and supply increases are astronomical. The employee situation continues to be precarious at best. This is bad.
- Supply-chain issues, the media’s obsession with various COVID variants and a lack of leadership in our government do not give a positive outlook for the near future.
- Our supply chain is getting better; there is still some shortage, but it’s not as hard as previous months. 2022 must be the best year ever for everyone; I can see that in the horizon.
- We have seen an increase in business due to holiday events. January will return to lower levels.
- I am undergoing an extensive renovation to remodel my existing locations to help justify the next price increase. Prices will increase in late January or early February to keep up with inflation.
- Uncertainty has increased due to Omicron.
- Uncertainty is increasing. Inflation is a concern, as well as the ability to hire qualified individuals.
- I spoke with lead equipment dealers this month and they said their projections show supply-chain issues through fourth quarter 2022. That's further out than we had expected. This could severely affect production, drive inflation, etc. We just heard that one North American auto manufacturer is taking 50,000 cars out of 2022 production projections. Side note: Commission structures need to be looked at due to lack of "invoiceability" in the next few quarters.
- COVID is back and is upsetting the workplace. We have seen an uptick internally as with our customers; this started around Thanksgiving. This makes it hard for us to plan our businesses.
- Demand continues to exceed supply in both new-vehicle and used-vehicle sales. There’s been no change on the parts and service side.
- Inflation has been substantial. Cost of freight has increased, and the freight service is not good at all.
- We continue to see our auto manufacturers cancel planned production at the last minute due to supply-chain issues.
- Supply-chain issues, particularly microchips, continue to plague the automobile business without any definite relief in sight.
- Some things are going up and some down. It is the craziest I have ever seen.
Historical Data
Historical data can be downloaded dating back to January 2007.
Indexes
Download indexes for all indicators. For the definitions of all variables, see Data Definitions.
Texas Service Sector Outlook Survey |
Texas Retail Outlook Survey |
| Unadjusted | Unadjusted |
| Seasonally adjusted | Seasonally adjusted |
All Data
Download indexes and components of the indexes (percentage of respondents reporting increase, decrease, or no change). For the definitions of all variables, see Data Definitions.
Texas Service Sector Outlook Survey |
Texas Retail Outlook Survey |
| Unadjusted | Unadjusted |
| Seasonally adjusted | Seasonally adjusted |