Texas Service Sector Activity Flat, Outlooks Worsen

Texas Service Sector Outlook Survey
Texas Service Sector Activity Flat, Outlooks Worsen
For this month’s survey, Texas business executives were asked supplemental questions on wages, prices and outlook concerns. Results for these questions from the Texas Manufacturing Outlook Survey, Texas Service Sector Outlook Survey and Texas Retail Outlook Survey have been released together. Read the special questions results.
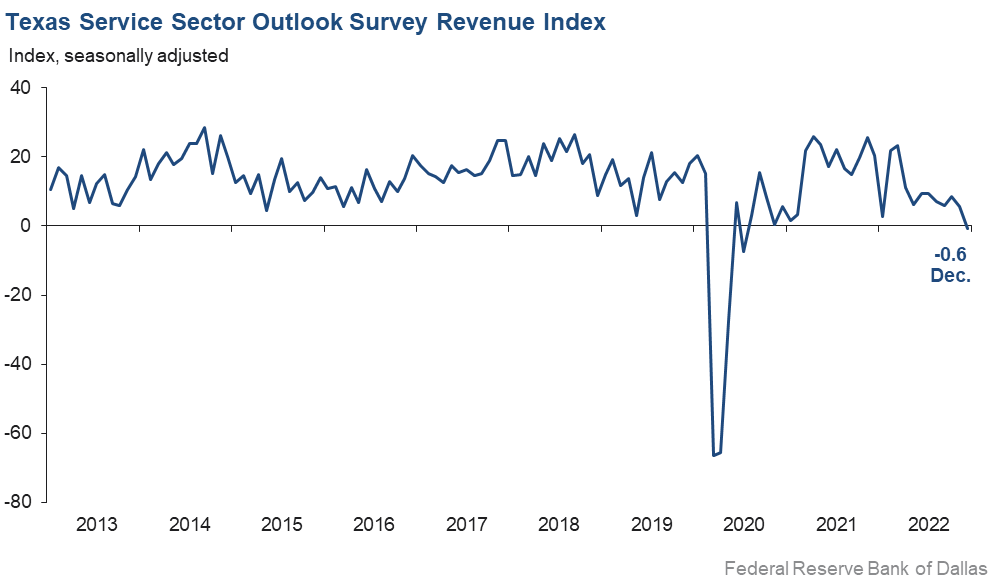
Texas service sector activity remained mostly flat in December, according to business executives responding to the Texas Service Sector Outlook Survey. The revenue index, a key measure of state service sector conditions, fell six points to near zero, suggesting little change in revenue from November.
Labor market indicators pointed to continued growth in employment, but at a slower pace than in November, and fewer hours worked in December. The employment index fell from 8.3 to 5.6, while the part-time employment index fell two points to -1.3. The hours worked index contracted from 4.6 to -1.7.
Perceptions of broader business conditions worsened further in December. The general business activity index fell from -11.0 in November to -19.8 in December. The company outlook index also fell, from -4.1 to -9.9, while the outlook uncertainty index remained elevated at 22.0, well above its series average of 13.2.
Growth in input prices and wages moderated in December, while growth in selling prices picked up slightly. The input prices index edged down from 46.2 to 43.3, while the wages and benefits index fell five points to 20.5, the lowest level since March 2021. The selling prices index increased from 17.6 to 20.1.
Respondents’ expectations regarding future business activity were mixed in December. The future general business activity index fell five points to -11.7. The future revenue index remained positive but dropped two points to 33.3. Other future service sector activity indexes such as employment and capital expenditures also decreased, suggesting waning optimism for growth next year.

Texas Retail Outlook Survey
Texas Retail Sales Continue to Decline
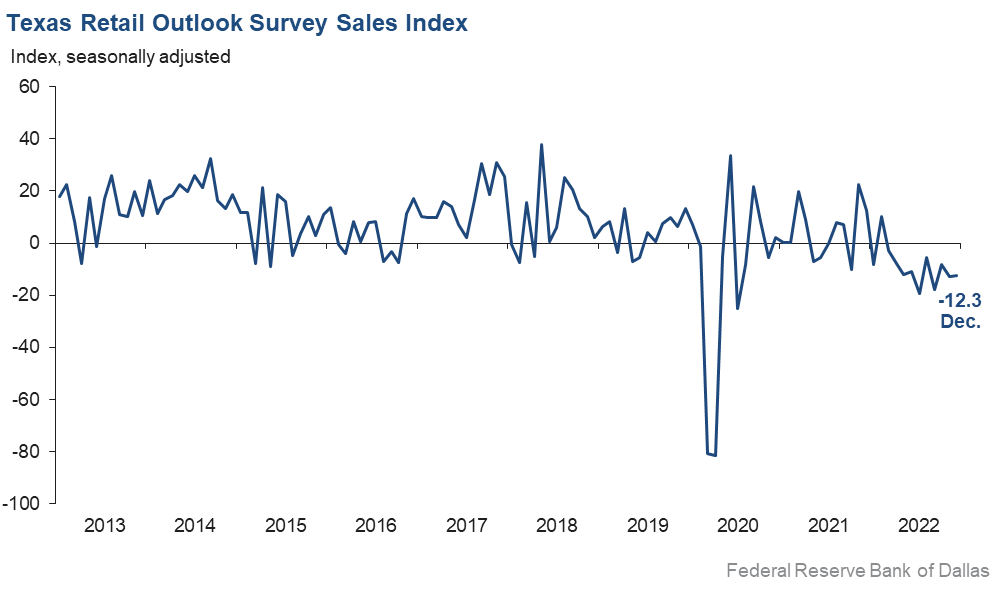
Retail sales continued to weaken in December, according to business executives responding to the Texas Retail Outlook Survey. The sales index, a key measure of state retail activity, was little changed at -12.3—a 10th consecutive month in negative territory. Retailers’ inventories continued to increase but at a slower pace than in November, with the index falling from 15.7 to 13.5.
Retail labor market indicators reflected mostly steady employment and shorter workweeks in December. The employment index increased from -4.6 to -0.5, suggesting near-zero growth in employment. The part-time employment index was largely unchanged at -4.9. The hours worked index fell 12 points to -10.7, with the share of firms reporting an increase in employees’ average hours worked dropping from 15.2 percent to 3.9.
Retailers’ perceptions of broader business conditions continued to worsen in December as both the general business activity and company outlook indexes remained deep in negative territory. The general business activity index fell 11 points to -33.0, while the company outlook index edged down to -13.5. The outlook uncertainty index fell 10 points from 27.7 to 17.6.
Growth in selling prices and wages picked up in December, while growth in input prices moderated. The selling prices index rose three points to 16.7. The wages and benefits index jumped eight points from 10.9 to 18.9, while the input prices index decreased five points to 33.8.
Expectations for future retail growth were mixed in December. The future general business activity index decreased from -17.6 to -27.7, while the future sales index improved slightly to 10.0. Other indexes of future retail activity such as employment and capital expenditures also provided mixed signals, with the future employment index turning negative for the first time since April 2020 and the capital expenditures index remaining positive.
The Texas Retail Outlook Survey is a component of the Texas Service Sector Outlook Survey that uses information only from respondents in the retail and wholesale sectors.
Next release: January 31, 2023
Data were collected December 13–21, and 317 Texas service sector business executives, of which 68 were retailers, responded to the survey. The Dallas Fed conducts the Texas Service Sector Outlook Survey monthly to obtain a timely assessment of the state’s service sector activity. Firms are asked whether revenue, employment, prices, general business activity and other indicators increased, decreased or remained unchanged over the previous month.
Survey responses are used to calculate an index for each indicator. Each index is calculated by subtracting the percentage of respondents reporting a decrease from the percentage reporting an increase. When the share of firms reporting an increase exceeds the share reporting a decrease, the index will be greater than zero, suggesting the indicator has increased over the prior month. If the share of firms reporting a decrease exceeds the share reporting an increase, the index will be below zero, suggesting the indicator has decreased over the prior month. An index will be zero when the number of firms reporting an increase is equal to the number of firms reporting a decrease. Data have been seasonally adjusted as necessary.
Texas Service Sector Outlook Survey
Historical data are available from January 2007 to the most current release month.
| Business Indicators Relating to Facilities and Products in Texas Current (versus previous month) | ||||||||
| Indicator | Dec Index | Nov Index | Change | Series Average | Trend* | % Reporting Increase | % Reporting No Change | % Reporting Decrease |
Revenue | –0.6 | 5.5 | –6.1 | 11.1 | 1(–) | 25.1 | 49.2 | 25.7 |
Employment | 5.6 | 8.3 | –2.7 | 6.6 | 29(+) | 18.1 | 69.4 | 12.5 |
Part–Time Employment | –1.3 | 0.9 | –2.2 | 1.6 | 1(–) | 7.6 | 83.5 | 8.9 |
Hours Worked | –1.7 | 4.6 | –6.3 | 2.9 | 1(–) | 7.4 | 83.5 | 9.1 |
Wages and Benefits | 20.5 | 25.4 | –4.9 | 15.7 | 31(+) | 25.6 | 69.3 | 5.1 |
Input Prices | 43.3 | 46.2 | –2.9 | 27.4 | 32(+) | 47.7 | 48.0 | 4.4 |
Selling Prices | 20.1 | 17.6 | +2.5 | 7.3 | 29(+) | 28.2 | 63.7 | 8.1 |
Capital Expenditures | 10.1 | 12.7 | –2.6 | 10.1 | 28(+) | 19.0 | 72.1 | 8.9 |
| General Business Conditions Current (versus previous month) | ||||||||
| Indicator | Dec Index | Nov Index | Change | Series Average | Trend** | % Reporting Improved | % Reporting No Change | % Reporting Worsened |
Company Outlook | –9.9 | –4.1 | –5.8 | 5.2 | 7(–) | 10.0 | 70.1 | 19.9 |
General Business Activity | –19.8 | –11.0 | –8.8 | 3.5 | 7(–) | 9.3 | 61.6 | 29.1 |
| Indicator | Dec Index | Nov Index | Change | Series Average | Trend* | % Reporting Increase | % Reporting No Change | % Reporting Decrease |
Outlook Uncertainty† | 22.0 | 23.4 | –1.4 | 13.2 | 19(+) | 31.5 | 58.9 | 9.5 |
| Business Indicators Relating to Facilities and Products in Texas Future (six months ahead) | ||||||||
| Indicator | Dec Index | Nov Index | Change | Series Average | Trend* | % Reporting Increase | % Reporting No Change | % Reporting Decrease |
Revenue | 33.3 | 35.3 | –2.0 | 37.8 | 32(+) | 50.4 | 32.5 | 17.1 |
Employment | 19.8 | 27.1 | –7.3 | 23.2 | 32(+) | 34.5 | 50.8 | 14.7 |
Part–Time Employment | 3.9 | 3.1 | +0.8 | 6.9 | 6(+) | 12.9 | 78.1 | 9.0 |
Hours Worked | 6.3 | 5.0 | +1.3 | 6.0 | 32(+) | 13.3 | 79.7 | 7.0 |
Wages and Benefits | 41.0 | 45.5 | –4.5 | 37.3 | 32(+) | 46.2 | 48.7 | 5.2 |
Input Prices | 51.4 | 50.8 | +0.6 | 44.6 | 192(+) | 56.3 | 38.8 | 4.9 |
Selling Prices | 37.9 | 35.7 | +2.2 | 24.5 | 32(+) | 44.7 | 48.4 | 6.8 |
Capital Expenditures | 19.6 | 22.1 | –2.5 | 23.5 | 31(+) | 31.4 | 56.7 | 11.8 |
| General Business Conditions Future (six months ahead) | ||||||||
| Indicator | Dec Index | Nov Index | Change | Series Average | Trend** | % Reporting Improved | % Reporting No Change | % Reporting Worsened |
Company Outlook | –1.1 | 4.3 | –5.4 | 16.3 | 1(–) | 19.6 | 59.7 | 20.7 |
General Business Activity | –11.7 | –6.3 | –5.4 | 13.3 | 8(–) | 18.3 | 51.7 | 30.0 |
Historical data are available from January 2007 to the most current release month.
| Business Indicators Relating to Facilities and Products in Texas Retail (versus previous month) | ||||||||
| Indicator | Dec Index | Nov Index | Change | Series Average | Trend* | % Reporting Increase | % Reporting No Change | % Reporting Decrease |
| Retail Activity in Texas | ||||||||
Sales | –12.3 | –12.7 | +0.4 | 4.7 | 10(–) | 19.1 | 49.5 | 31.4 |
Employment | –0.5 | –4.6 | +4.1 | 1.9 | 2(–) | 13.2 | 73.0 | 13.7 |
Part–Time Employment | –4.9 | –4.3 | –0.6 | –1.6 | 7(–) | 7.6 | 79.9 | 12.5 |
Hours Worked | –10.7 | 1.7 | –12.4 | –1.7 | 1(–) | 3.9 | 81.5 | 14.6 |
Wages and Benefits | 18.9 | 10.9 | +8.0 | 11.0 | 29(+) | 24.5 | 69.9 | 5.6 |
Input Prices | 33.8 | 38.7 | –4.9 | 22.3 | 32(+) | 48.1 | 37.7 | 14.3 |
Selling Prices | 16.7 | 13.5 | +3.2 | 13.9 | 31(+) | 36.0 | 44.7 | 19.3 |
Capital Expenditures | 5.1 | 8.8 | –3.7 | 8.1 | 23(+) | 14.1 | 76.9 | 9.0 |
Inventories | 13.5 | 15.7 | –2.2 | 2.2 | 6(+) | 30.7 | 52.1 | 17.2 |
| Companywide Retail Activity | ||||||||
Companywide Sales | –11.5 | –10.5 | –1.0 | 6.1 | 8(–) | 24.3 | 40.0 | 35.8 |
Companywide Internet Sales | –18.0 | –16.0 | –2.0 | 4.9 | 8(–) | 8.3 | 65.4 | 26.3 |
| General Business Conditions, Retail Current (versus previous month) | ||||||||
| Indicator | Dec Index | Nov Index | Change | Series Average | Trend** | % Reporting Improved | % Reporting No Change | % Reporting Worsened |
Company Outlook | –13.5 | –12.3 | –1.2 | 2.8 | 10(–) | 8.5 | 69.5 | 22.0 |
General Business Activity | –33.0 | –21.8 | –11.2 | –0.9 | 8(–) | 4.6 | 57.8 | 37.6 |
| Outlook Uncertainty Current (versus previous month) | ||||||||
| Indicator | Dec Index | Nov Index | Change | Series Average | Trend* | % Reporting Increase | % Reporting No Change | % Reporting Decrease |
Outlook Uncertainty† | 17.6 | 27.7 | –10.1 | 10.8 | 19(+) | 29.4 | 58.8 | 11.8 |
| Business Indicators Relating to Facilities and Products in Texas, Retail Future (six months ahead) | ||||||||
| Indicator | Dec Index | Nov Index | Change | Series Average | Trend* | % Reporting Increase | % Reporting No Change | % Reporting Decrease |
| Retail Activity in Texas | ||||||||
Sales | 10.0 | 8.6 | +1.4 | 32.1 | 32(+) | 35.3 | 39.4 | 25.3 |
Employment | –1.2 | 9.1 | –10.3 | 13.1 | 1(–) | 19.5 | 59.8 | 20.7 |
Part–Time Employment | –5.2 | 2.4 | –7.6 | 1.7 | 1(–) | 11.0 | 72.8 | 16.2 |
Hours Worked | –10.2 | –1.8 | –8.4 | 3.0 | 3(–) | 8.7 | 72.4 | 18.9 |
Wages and Benefits | 26.1 | 32.9 | –6.8 | 29.2 | 32(+) | 37.7 | 50.7 | 11.6 |
Input Prices | 38.1 | 39.7 | –1.6 | 34.4 | 32(+) | 50.8 | 36.5 | 12.7 |
Selling Prices | 25.4 | 21.3 | +4.1 | 30.1 | 32(+) | 44.4 | 36.5 | 19.0 |
Capital Expenditures | 9.4 | 11.3 | –1.9 | 17.8 | 31(+) | 25.0 | 59.4 | 15.6 |
Inventories | 3.0 | 12.1 | –9.1 | 10.7 | 32(+) | 31.7 | 39.7 | 28.7 |
| Companywide Retail Activity | ||||||||
Companywide Sales | 7.8 | 1.4 | +6.4 | 30.6 | 32(+) | 35.8 | 36.2 | 28.0 |
Companywide Internet Sales | 15.4 | 0.0 | +15.4 | 22.3 | 1(+) | 30.8 | 53.8 | 15.4 |
| General Business Conditions, Retail Future (six months ahead) | ||||||||
| Indicator | Dec Index | Nov Index | Change | Series Average | Trend** | % Reporting Improved | % Reporting No Change | % Reporting Worsened |
Company Outlook | –12.4 | –10.4 | –2.0 | 16.5 | 8(–) | 15.3 | 57.0 | 27.7 |
General Business Activity | –27.7 | –17.6 | –10.1 | 12.0 | 9(–) | 12.0 | 48.3 | 39.7 |
*Shown is the number of consecutive months of expansion or contraction in the underlying indicator. Expansion is indicated by a positive index reading and denoted by a (+) in the table. Contraction is indicated by a negative index reading and denoted by a (–) in the table.
**Shown is the number of consecutive months of improvement or worsening in the underlying indicator. Improvement is indicated by a positive index reading and denoted by a (+) in the table. Worsening is indicated by a negative index reading and denoted by a (–) in the table.
†Added to survey in January 2018.
Data have been seasonally adjusted as necessary, with the exception of the outlook uncertainty index which does not yet have a sufficiently long time series to test for seasonality.
Texas Service Sector Outlook Survey
Texas Retail Outlook Survey
Texas Service Sector Outlook Survey
Comments from Survey Respondents
These comments are from respondents’ completed surveys and have been edited for publication.
- A massive yield rate inversion clearly predicts a recession. We think a soft landing is impossible. Expiring tax cuts, along with aggressive government regulations, are causing our clients to believe the recession will continue throughout 2023.
- We are actively investing in marketing and sales to grow our business. We believe there will be a general softening of the market, and we intend to take advantage with aggressive sales and marketing.
- Large-scale real estate projects are dying. There is clearly a trend for less activity. Likewise, our Texas Alcoholic Beverage Commission licensing business (which dates to the 1960s) is way off. Small operators cannot find access to loans. Two additional contracts committed. This is the best backlog we’ve ever had.
- There seems to be some very positive items on the horizon for our company, but it is a real struggle at this point.
- Our orders continue to trend down as they did last month, and most of our clients are saying they do not plan on transacting any real estate deals through the first half of next year. This could all change depending on where inflation and the interest rate settle. There just needs to be some clarity before the real estate market recovers.
- We have closed a number of deals this quarter and expect a revenue increase of 100 percent for 2023.
- We are projecting over 10 percent growth in revenue for 2023. Projects continue to come in. The backlog is 14 months.
- The outlook has not been good or bad, just dull.
- Supply-chain issues have had an impact on the specialty items we purchase. Some items are not available with no expectation of those returning. We have been unable to find a new supplier of the same or similar items.
- [We have a] huge problem still with a shortage of experienced staff. Wage pressures and remote work options are continuing to put stress on employers trying to retain staff and grow business. Poaching is occurring as a result of an extreme shortage of labor.
- Our business outlook remains the same. [There is] tight funding for contract growth and a competitive market for top-tier technical talent.
- Despite all the talk of a technical recession, no real evidence has emerged.
- Business activity has been hurt by inflation and expectations of a recession. Clients are postponing all but strictly necessary projects until there is more clarity about the course of the economy.
- Inflation and Washington dysfunction continue to be the biggest disruptions to future planning.
- Interest rate hikes are creating a slowdown in the lowest tier of our market segmentation.
- We feel that things have stabilized somewhat. Price increases from our vendors have flattened out. We do not foresee future price increases from vendors to exceed 3 percent for the next six months.
- We still can't find employees.
-
We are a commodity-based business. Buyers overbought in summer, anticipating a large surplus of boxes. However, this did not materialize.
-
Hiring remains difficult, but there are signs that wages and employee availability may be moderating toward a more optimistic hiring market for us. Some elements of inflation, particularly those that affect repairs and capital improvements, are moderating.
- Input costs continue to be a major problem (wages and inventory/supplies). The labor market appears to be softening, with more qualified candidates applying for open positions and less odd behavior such as "ghosting" after contact is made. We anticipate an increase in both unemployment and uninsured rates, which would disproportionately impact our health care business.
- [There are] tremendous challenges in hiring.
-
These are uncertain times. Today's news on the November Consumer Price Index was generally good. As we approach the new year, our first quarter is shaping up as expected. Second quarter has the indicators that suggest we will achieve our numbers.
-
We believe in the inverted yield curve, so we fear the Fed [Federal Reserve] must induce a recession to slow down price growth. Business gets tougher every day, and signs of slowing down are everywhere.
-
Things are relatively stable month to month now, with a very positive year behind us. We just approved a 2023 budget last week, with higher revenues, salaries and capital expenditures. [We are] generally optimistic about continued demand for Texas energy.
- More global variables with downside risks are increasing (looking more credible) as time goes on. This environment will cause some decisions to be slowed or paused domestically and internationally in the next year. Onshoring and to some degree near-shoring supply-chain shifts will be significantly more expensive to implement and sustain over time. This trend is not being accurately forecast by many for the increased costs and degree of difficulty.
- Tight capital markets continue to hamper our ability to invest. As a result, we are shifting attention to profitability and taking appropriate cost-cutting action. Declining consumer spending has created uncertainty for our customers and, transitively, our business as well. As a result, we are continuing to focus on more upmarket, mature customers who are more insulated from spending and demand fluctuations. We have seen some of our input costs decline in certain areas, but many have held stable. Likewise, across our own services, we are cutting prices in certain areas but maintaining or even increasing prices in others. Fed [Federal Reserve] actions, from our perspective, seem to have had disparate effects on demand and ability/willingness to pay across market sectors and company segments.
-
The uncertainty of inflation and interest rates in the coming quarters is impacting how we hire and make investments. In addition, the lack of competent skilled technology [talent] in the market is having a ripple effect on delivering services and growing the business.
- [There is] no change in uncertainty, and inflation does not look transitory like the experts said.
- The reason for the expected increase in revenue is related to the expectation that bank lenders will seek to shrink their commercial mortgage portfolios, and those borrowers will turn more to the insurance company sector as a source of debt capital for their commercial real estate investments.
- Increased regulation continues to be a concern. The added expense of adapting to more compliance restraints is driving up cost of operations and limiting the company's ability to serve our customers.
-
We are mildly encouraged that the Consumer Price Index moderated last month. If the rate of inflation will moderate, we think that is good for everyone.
-
Leasing activity has remained robust. While the cost of tenant improvements has increased, net rental rates have also increased, thereby offsetting the increase in build-out costs. As a result of increased revenue, management fee income has increased since it is calculated as a fixed percentage of gross income. We lost one property manager but have replaced that position and added an additional property manager. We plan to hire a new junior accountant in 2023 to replace a person who resigned in 2022. In the land development division of the business, we continue to enter into new-pad sales and ground lease agreements, all with nationally branded retailers.
-
Multifamily investment real estate is facing a looming crisis. Rising debt service and outrageous insurance costs cannot be fully recouped through rent increases. Deals will fail as a result, and pressure on management companies like ours is intensifying. Larger service companies that can offer savings through insurance pools are putting smaller operators at a competitive disadvantage.
-
Market fluctuations impact our investment portfolio success.
-
We feel that a recession is coming, and that means our bad debt will increase.
- We are committed to three new cafes in 2023 but are now considering a pause while we evaluate the impacts of what we believe is a coming recession.
- My leadership team believes that the first six months of 2023 will be flat in comparison to 2022 revenues. We also believe there will be some companies shutting down Dec. 31 rather than struggle with the high cost of sales and the high cost of labor and thin profit margins in 2023. High interest rates will also force some companies out.
- We are turning away business during the busy season of December due to lack of employees. We hear the same from most other restaurants. When we can hire an employee, they don't stay—aren't willing to work. Downtown offices continue to have low occupancy. Business travel to downtown remains considerably below pre-COVID [levels]. All our costs including payroll have continued to increase all year, and if we have empty seats, it's very difficult to justify price increases. I thought 2020 and 2021 were tough, but 2022 has been brutal, and talking about a recession in 2023 isn’t a great Christmas present.
- Spending after October slowed quite a bit. We know that once January hits, it will be even slower. So that is not a good feeling. We also do not want to increase our prices because our demographic is already feeling it from everywhere else, and we don't want to lose [those customers].
- While prices seem to have peaked, they have not come down yet. Consumers are starting to pull back.
-
The supply of Apple iPhone devices has declined due to China lockdowns, impacting sales.
- Traffic flow is down, the average sales per transaction is down about $20. [People are] looking for deals and cutting back on spending.
- Overhead costs have become uncontrollable due to increased regulation, the need to raise salaries to keep up with inflation, increasing insurance costs and increasing property taxes.
-
The position of a specialty independent pharmacy in the health care industry remains difficult considering the antitrust concerns of larger conglomerates.
- The decrease in selling prices is confined to the used-vehicle category.
- Compressed margins will challenge our business model. Interest rate hikes are bad for our business.
- We are seeing a slight increase in inventories of new vehicles and some general softening of demand. Used-car prices have dropped sharply.
- Business remains good. We just focus on what we can control.
Historical Data
Historical data can be downloaded dating back to January 2007.
Indexes
Download indexes for all indicators. For the definitions of all variables, see Data Definitions.
Texas Service Sector Outlook Survey |
Texas Retail Outlook Survey |
| Unadjusted | Unadjusted |
| Seasonally adjusted | Seasonally adjusted |
All Data
Download indexes and components of the indexes (percentage of respondents reporting increase, decrease, or no change). For the definitions of all variables, see Data Definitions.
Texas Service Sector Outlook Survey |
Texas Retail Outlook Survey |
| Unadjusted | Unadjusted |
| Seasonally adjusted | Seasonally adjusted |
Questions regarding the Texas Service Sector Outlook Survey can be addressed to Jesus Cañas at jesus.canas@dal.frb.org.
Sign up for our email alert to be automatically notified as soon as the latest Texas Service Sector Outlook Survey is released on the web.