
Texas Service Sector Outlook Survey
Texas service sector activity continues to grow, price pressures remain elevated
For this month’s survey, Texas business executives were asked supplemental questions on operating margins and expected demand. Results for these questions from the Texas Manufacturing Outlook Survey, Texas Service Sector Outlook Survey and Texas Retail Outlook Survey have been released together. Read the special questions results.
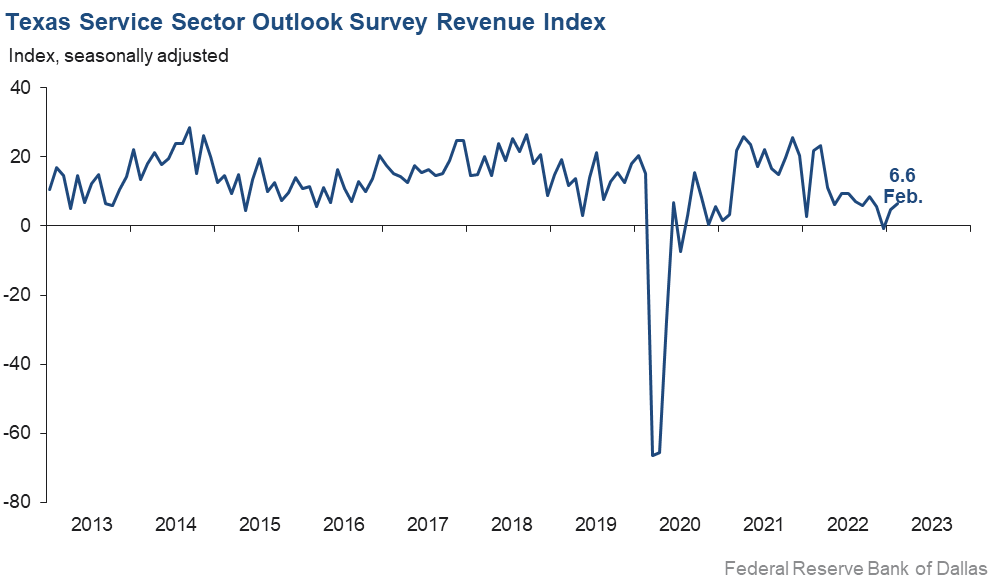
Growth in Texas service sector activity continued in February, according to business executives responding to the Texas Service Sector Outlook Survey. The revenue index, a key measure of state service sector conditions, edged up 1.7 points to 6.6, suggesting a slight pickup in activity growth.
Labor market indicators pointed to continued growth in employment and workweeks. The employment index fell two points from 10.5 to 8.8, while the part-time employment index rose three points to 4.0. The hours worked index improved from 0.9 to 1.8.
Perceptions of broader business conditions continued to worsen in February, though pessimism has been waning. The general business activity index moved up six points to -9.3. The company outlook index also improved from -8.3 to -1.7, while the outlook uncertainty index fell seven points to 12.9, just below its series average of 13.4.
Price and wage pressures remained elevated, though there was some moderation in wage growth. The input prices index ticked up from 38.8 to 40.6, while the selling prices index remained mostly flat at 19.8. The wages and benefits index moved down two points to 19.4, still elevated relative to its average reading of 15.7.
Respondents’ expectations regarding future business activity were mixed in February. The future general business activity index remained negative but mostly flat at -3.6. The future revenue index stayed positive, edging up three points to 42.2. Other future service sector activity indexes such as employment and capital expenditures remained in solidly positive territory, suggesting optimism for growth this year.

Texas Retail Outlook Survey
Texas retail sales decline further
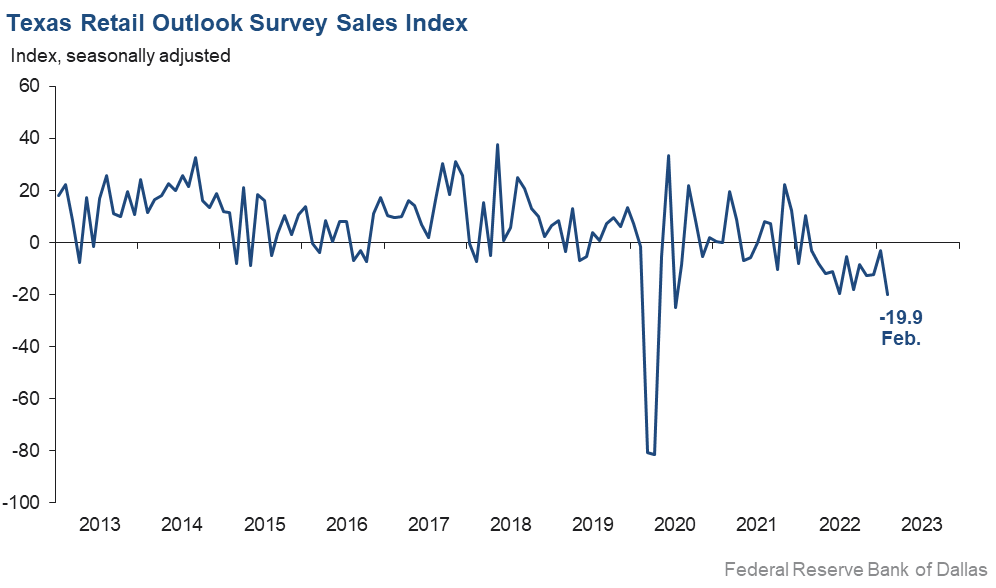
Retail sales continued to weaken in February, according to business executives responding to the Texas Retail Outlook Survey. The sales index, a key measure of state retail activity, dropped from -3.0 to -19.9, suggesting sales fell at a much faster pace than in January. Retailers’ inventories increased at a faster rate than last month, with the index growing from 3.2 to 9.6.
Retail labor market indicators reflected higher employment growth and shorter workweeks in February. The employment index rose from 2.0 to 6.9, suggesting a pickup in employment growth. The part-time employment index improved from -1.1 to 1.7. The hours worked index increased five points to -1.6.
Retailers’ perceptions of broader business conditions continued to worsen in February as both the general business activity and company outlook indexes remained deep in negative territory. The general business activity index was largely flat at -18.7, while the company outlook index edged down to -18.4. The outlook uncertainty index increased eight points to 13.2.
Price and wage pressures eased in February. The selling prices index decreased six points to 17.2, while the input prices index was flat at 33.7. The wages and benefits index dropped 10 points to 16.6.
Expectations for future retail growth were mixed in February. The future general business activity index remained unchanged at -17.0, while the future sales index rose 10 points from 1.8 to 11.4. Other indexes of future retail activity such as employment and capital expenditures remained solidly positive, reflecting expectations for growth in retail activity later in the year.
The Texas Retail Outlook Survey is a component of the Texas Service Sector Outlook Survey that uses information only from respondents in the retail and wholesale sectors.
Next release: March 28, 2023
Data were collected February 14–22, and 315 Texas service sector business executives, of which 69 were retailers, responded to the survey. The Dallas Fed conducts the Texas Service Sector Outlook Survey monthly to obtain a timely assessment of the state’s service sector activity. Firms are asked whether revenue, employment, prices, general business activity and other indicators increased, decreased or remained unchanged over the previous month.
Survey responses are used to calculate an index for each indicator. Each index is calculated by subtracting the percentage of respondents reporting a decrease from the percentage reporting an increase. When the share of firms reporting an increase exceeds the share reporting a decrease, the index will be greater than zero, suggesting the indicator has increased over the prior month. If the share of firms reporting a decrease exceeds the share reporting an increase, the index will be below zero, suggesting the indicator has decreased over the prior month. An index will be zero when the number of firms reporting an increase is equal to the number of firms reporting a decrease. Data have been seasonally adjusted as necessary.
Texas Service Sector Outlook Survey
Historical data are available from January 2007 to the most current release month.
| Business Indicators Relating to Facilities and Products in Texas Current (versus previous month) | ||||||||
| Indicator | Feb Index | Jan Index | Change | Series Average | Trend* | % Reporting Increase | % Reporting No Change | % Reporting Decrease |
Revenue | 6.6 | 4.9 | +1.7 | 11.1 | 2(+) | 31.7 | 43.1 | 25.1 |
Employment | 8.8 | 10.5 | –1.7 | 6.6 | 31(+) | 18.8 | 71.2 | 10.0 |
Part–Time Employment | 4.0 | 1.2 | +2.8 | 1.5 | 2(+) | 8.4 | 87.2 | 4.4 |
Hours Worked | 1.8 | 0.9 | +0.9 | 2.8 | 2(+) | 8.7 | 84.4 | 6.9 |
Wages and Benefits | 19.4 | 21.7 | –2.3 | 15.7 | 33(+) | 23.0 | 73.4 | 3.6 |
Input Prices | 40.6 | 38.8 | +1.8 | 27.5 | 34(+) | 43.3 | 54.0 | 2.7 |
Selling Prices | 19.8 | 18.9 | +0.9 | 7.5 | 31(+) | 27.2 | 65.4 | 7.4 |
Capital Expenditures | 10.6 | 6.4 | +4.2 | 10.1 | 31(+) | 18.2 | 74.2 | 7.6 |
| General Business Conditions Current (versus previous month) | ||||||||
| Indicator | Feb Index | Jan Index | Change | Series Average | Trend** | % Reporting Improved | % Reporting No Change | % Reporting Worsened |
Company Outlook | –1.7 | –8.3 | +6.6 | 5.0 | 9(–) | 14.5 | 69.3 | 16.2 |
General Business Activity | –9.3 | –15.0 | +5.7 | 3.3 | 9(–) | 13.3 | 64.1 | 22.6 |
| Indicator | Feb Index | Jan Index | Change | Series Average | Trend* | % Reporting Increase | % Reporting No Change | % Reporting Decrease |
Outlook Uncertainty† | 12.9 | 20.0 | –7.1 | 13.4 | 21(+) | 22.3 | 68.3 | 9.4 |
| Business Indicators Relating to Facilities and Products in Texas Future (six months ahead) | ||||||||
| Indicator | Feb Index | Jan Index | Change | Series Average | Trend* | % Reporting Increase | % Reporting No Change | % Reporting Decrease |
Revenue | 42.2 | 39.4 | +2.8 | 37.8 | 34(+) | 53.2 | 35.8 | 11.0 |
Employment | 28.9 | 24.4 | +4.5 | 23.2 | 34(+) | 36.3 | 56.2 | 7.4 |
Part–Time Employment | 5.7 | 4.4 | +1.3 | 6.9 | 8(+) | 11.7 | 82.3 | 6.0 |
Hours Worked | 4.4 | 1.7 | +2.7 | 6.0 | 34(+) | 8.3 | 87.8 | 3.9 |
Wages and Benefits | 40.4 | 38.7 | +1.7 | 37.3 | 34(+) | 42.7 | 55.0 | 2.3 |
Input Prices | 53.7 | 47.2 | +6.5 | 44.7 | 194(+) | 57.8 | 38.1 | 4.1 |
Selling Prices | 31.9 | 35.2 | –3.3 | 24.6 | 34(+) | 39.6 | 52.7 | 7.7 |
Capital Expenditures | 22.4 | 24.2 | –1.8 | 23.5 | 33(+) | 28.1 | 66.2 | 5.7 |
| General Business Conditions Future (six months ahead) | ||||||||
| Indicator | Feb Index | Jan Index | Change | Series Average | Trend** | % Reporting Improved | % Reporting No Change | % Reporting Worsened |
Company Outlook | 10.8 | 6.3 | +4.5 | 16.2 | 2(+) | 23.5 | 63.8 | 12.7 |
General Business Activity | –3.6 | –4.4 | +0.8 | 13.0 | 10(–) | 17.3 | 61.9 | 20.9 |
Historical data are available from January 2007 to the most current release month.
| Business Indicators Relating to Facilities and Products in Texas Retail (versus previous month) | ||||||||
| Indicator | Feb Index | Jan Index | Change | Series Average | Trend* | % Reporting Increase | % Reporting No Change | % Reporting Decrease |
| Retail Activity in Texas | ||||||||
Sales | –19.9 | –3.0 | –16.9 | 4.5 | 12(–) | 22.9 | 34.3 | 42.8 |
Employment | 6.9 | 2.0 | +4.9 | 1.9 | 2(+) | 14.4 | 78.1 | 7.5 |
Part–Time Employment | 1.7 | –1.1 | +2.8 | –1.6 | 1(+) | 7.5 | 86.7 | 5.8 |
Hours Worked | –1.6 | –6.1 | +4.5 | –1.8 | 3(–) | 4.5 | 89.4 | 6.1 |
Wages and Benefits | 16.6 | 26.8 | –10.2 | 11.1 | 31(+) | 21.8 | 73.0 | 5.2 |
Input Prices | 33.7 | 33.3 | +0.4 | 22.5 | 34(+) | 40.7 | 52.3 | 7.0 |
Selling Prices | 17.2 | 23.4 | –6.2 | 14.0 | 33(+) | 31.0 | 55.2 | 13.8 |
Capital Expenditures | 10.1 | 6.9 | +3.2 | 8.1 | 25(+) | 22.2 | 65.7 | 12.1 |
Inventories | 9.6 | 3.2 | +6.4 | 2.2 | 9(+) | 27.8 | 54.0 | 18.2 |
| Companywide Retail Activity | ||||||||
Companywide Sales | –13.0 | –6.2 | –6.8 | 5.9 | 12(–) | 20.5 | 46.0 | 33.5 |
Companywide Internet Sales | –22.2 | –1.6 | –20.6 | 4.8 | 5(–) | 5.5 | 66.8 | 27.7 |
| General Business Conditions, Retail Current (versus previous month) | ||||||||
| Indicator | Feb Index | Jan Index | Change | Series Average | Trend** | % Reporting Improved | % Reporting No Change | % Reporting Worsened |
Company Outlook | –18.4 | –14.5 | –3.9 | 2.6 | 12(–) | 7.7 | 66.2 | 26.1 |
General Business Activity | –18.7 | –19.6 | +0.9 | –1.1 | 10(–) | 9.7 | 61.9 | 28.4 |
| Outlook Uncertainty Current (versus previous month) | ||||||||
| Indicator | Feb Index | Jan Index | Change | Series Average | Trend* | % Reporting Increase | % Reporting No Change | % Reporting Decrease |
Outlook Uncertainty† | 13.2 | 5.7 | +7.5 | 10.7 | 21(+) | 25.0 | 63.2 | 11.8 |
| Business Indicators Relating to Facilities and Products in Texas, Retail Future (six months ahead) | ||||||||
| Indicator | Feb Index | Jan Index | Change | Series Average | Trend* | % Reporting Increase | % Reporting No Change | % Reporting Decrease |
| Retail Activity in Texas | ||||||||
Sales | 11.4 | 1.8 | +9.6 | 31.7 | 8(+) | 33.5 | 44.4 | 22.1 |
Employment | 10.1 | 6.9 | +3.2 | 13.0 | 34(+) | 19.5 | 71.1 | 9.4 |
Part–Time Employment | –5.4 | –1.9 | –3.5 | 1.7 | 3(–) | 4.8 | 85.0 | 10.2 |
Hours Worked | –0.3 | –14.4 | +14.1 | 2.8 | 5(–) | 3.5 | 92.7 | 3.8 |
Wages and Benefits | 31.2 | 21.2 | +10.0 | 29.2 | 34(+) | 33.3 | 64.6 | 2.1 |
Input Prices | 39.4 | 23.4 | +16.0 | 34.4 | 34(+) | 52.5 | 34.4 | 13.1 |
Selling Prices | 25.8 | 21.5 | +4.3 | 30.0 | 34(+) | 43.5 | 38.7 | 17.7 |
Capital Expenditures | 18.3 | 19.3 | –1.0 | 17.8 | 33(+) | 28.3 | 61.7 | 10.0 |
Inventories | 8.6 | 4.0 | +4.6 | 10.7 | 34(+) | 30.8 | 46.9 | 22.2 |
| Companywide Retail Activity | ||||||||
Companywide Sales | 7.2 | –0.4 | +7.6 | 30.3 | 1(+) | 27.6 | 52.0 | 20.4 |
Companywide Internet Sales | 15.4 | 7.9 | +7.5 | 22.2 | 3(+) | 21.2 | 73.1 | 5.8 |
| General Business Conditions, Retail Future (six months ahead) | ||||||||
| Indicator | Feb Index | Jan Index | Change | Series Average | Trend** | % Reporting Improved | % Reporting No Change | % Reporting Worsened |
Company Outlook | –8.0 | –8.7 | +0.7 | 16.1 | 10(–) | 11.5 | 69.1 | 19.5 |
General Business Activity | –17.0 | –17.0 | 0.0 | 11.6 | 11(–) | 10.4 | 62.2 | 27.4 |
*Shown is the number of consecutive months of expansion or contraction in the underlying indicator. Expansion is indicated by a positive index reading and denoted by a (+) in the table. Contraction is indicated by a negative index reading and denoted by a (–) in the table.
**Shown is the number of consecutive months of improvement or worsening in the underlying indicator. Improvement is indicated by a positive index reading and denoted by a (+) in the table. Worsening is indicated by a negative index reading and denoted by a (–) in the table.
†Added to survey in January 2018.
Data have been seasonally adjusted as necessary, with the exception of the outlook uncertainty index which does not yet have a sufficiently long time series to test for seasonality.
Texas Service Sector Outlook Survey
Texas Retail Outlook Survey
Texas Service Sector Outlook Survey
Comments from survey respondents
These comments are from respondents’ completed surveys and have been edited for publication.
- We are very optimistic regarding growth. Clients continue to push project-based decisions, so we are carrying costs with the hopes of projects converting.
- The level of development has dropped the most we have seen since the Great Recession. Our number of opportunities is down 75 percent from this time last year. There is real cause for concern that everything is going to just stop. Several national multifamily companies have stopped projects, and few are in the making. Employers need employees because we are getting a lot of calls. However, employers seem slow to commit to the hiring process. I think small businesses are nervous because of what they read, but they still need people.
- The commercial real estate market has taken a pause due to the uncertainty of how long the interest rate increases will continue. We have seen a 40 percent drop in commercial orders year over year and a 60 percent drop in revenue. On the bright side, residential orders have picked up substantially the past two months, while inventory remains low. Our outlook for the future of the DFW real estate market is still positive, but we are uncertain about what the next six-to-12-month period will bring.
- Consulting in the engineering arena has increased due to legal activities among engineering companies and construction companies, we continue to experience a shortage of qualified labor. We've had very little interest from job postings made in the last two months. We cannot find experienced professional staff. Productivity continues to slip while clients apply downward pressure on fees.
- The debate over increasing the debt limit and potential consequences only adds to the uncertainty.
- We see a slight slowing of the construction industry. At this point, it is a welcome break compared to the last five years.
- We face a rising cost of the goods that we use to provide janitorial and building maintenance services. The wages received are not comparable to the amount of capital expenditures.
- The inability to control inflation and the continued rise in interest rates remain a concern.
- While many pundits prognosticate a soft landing, the U.S. economy finds way to continue expanding.
- Despite rising revenues, margins remain decreased due to higher payroll costs, including substantial overtime expenses due to a shortage of qualified technologists.
- January sales met our expectation, but costs were higher. We see February much the same way in terms of revenues. We are working hard to bring costs down. I anticipate this being the case for most of the first half of 2023.
- Workforce issues continue to plague this sector.
- High interest rates have affected buyers of homes. Uncertainties about the economy continue.
- Many apartment owners in our area are starting to feel the pain of increased interest rates, higher property taxes and massive insurance hikes. Rent increases are currently off the table and occupancy has stagnated, so owners, investors and lenders are jockeying to see how the pain pie is going to be divided and who is going to put up the cash to carry on. The lenders are not anxious to end up with portfolios of problem assets, and small investors have not yet accepted that not only are distributions going to evaporate, but cash calls are also on the way. The retail investors we deal with often count on distributions to live on. It's going to get ugly. Meanwhile, vendors of goods and services are being strung out on payments to the extent that some of the little guys will be “killed off.”
- [We have the] same issue: Finding candidates who are willing to work.
- It’s a crazy world; fuel goes down in price at this time, but it is announced that Russia is about to reduce its oil production, which in turn will make it [prices] go up. Demand for transportation in the U.S. has softened, but nearshoring has increased the demand for resources at the U.S. border with Mexico. It is extremely hard to make any good predictions about the near future, much less for the medium or long term. Therefore, currently, we are just rolling with the punches.
- The continuation of risk assessment by clients/customers continues. Some see supply-chain risk for longer, while others are slower to decide as the predictions of sticky inflation remain.
- The Fed’s [Federal Reserve] continued increasing interest rates have significantly slowed loan demand across all sectors. Inflation/cost of living has further slowed loan demand as borrowers are not qualifying for loans at the levels they once were. The agricultural production sector continues to be challenged by increasing input costs and continued escalation in equipment costs. Smaller family farmers and ranchers who lack the larger economies of scale are facing very challenging times.
- We are pressured to be as lean as possible (expenses), while trying to grow the top line (revenues) continues to be the No. 1 challenge. Prospective clients’ due diligence for purchases is more burdensome than ever. Every business is facing the unprecedented cost of wages and the war for talent.
- Most uncertainty today is primarily focused on the Federal Reserve’s tightening and forecasting/projections. The labor market remains tight and highly price competitive.
- We are deeply concerned about government spending and policies on energy. The push to electrify vehicles will have an adverse impact on our business. (Low-income people cannot afford them.)
- For those of us who have to meet payrolls, look our employees in the eye and generate real revenue, it's a different world. Price elasticity of demand is the only thing keeping prices from going up further.
- As a financial services company, we are impacted by economic and investment market conditions. Forward looking, I anticipate revenues declining later this year due to market conditions. In the near term, costs are higher. Insurance costs for 2023 and recent employee payroll increases (mainly cost of living adjustments) are increasing labor costs this year.
- We are expanding with new staff and partner affiliations in our services. We are taking on additional clients in this expansion as well.
- We pass through premiums from our insurance companies, so our revenues increase with rate increases for personal and business coverages. We're not working any differently, just spending more time explaining to customers why their premiums increased (which we can ultimately blame on higher claims costs due to inflation and parts/labor scarcity plus catastrophic weather claims in Texas). We are looking for experienced help to add to our staff, but the supply is very limited.
- We saw a sizeable impact to demand in the second half of last year. We are beginning to see those numbers improve, and businesses seem to have more confidence than in late 2022.
- We think people are uneasy right now and trying to have restraint.
- [I am] getting nervous about the Ukraine situation—how that will affect our economy. Also, labor shortage is a real problem for us right now.
- [We are] still facing supply-chain headwinds with semiconductors and long lead times due to record demand for electrical infrastructure equipment.
- We expect interest rates to further affect vehicle sales. Affordability will continue to be an issue.
- Customer traffic has decreased noticeably from the prior month.
- We are still waiting for parts; in some cases, the owner is waiting up to six months.
- Stores are selling below our cost now. A race to the bottom—same rate as 2019 unit sales.
- Inflation has impacted every business in every industry, especially health care. With the value of the dollar decreasing, the amount of effort and labor required to increase market share increases. Performance evaluations tend to occur at the end of the fiscal year or beginning of the fiscal year. At that point, company expenses or cost of labor will increase. The reimbursements in health care are tightening up margins more and more each month, which make competition fierce. More competition should yield higher-quality goods and services for patients, but this is not occurring in health care. Patients do not have equal access to health care. Patients are being funneled into providers of prescription meds, which have such a monopoly that quality of care and costs are not directly correlated. These issues in antitrust and collusion continue to harm independent pharmacies and disrupt the care for the public at large.
- We are seeing a softening in trucking prices. This lags ocean-container pricing, which started softening in November. We are also finding it easier to get orders picked up and moved, which indicates trucking capacity is opening. We think the supply-chain services (trucking/warehousing/refrigerated containers) for food service and grocery are starting to get back to prepandemic levels with respect to capacity. As customers moved out of traditional proteins and cuts (i.e., chicken wings) during the [height of the] pandemic and switched into lower-cost options like thigh meat, it has added volatility to the price of certain commodities. We're seeing smaller swings in volatility as supply/demand pricing starts to balance out.
- A shortage of employees and difficulty retaining employees remain significant struggles and are constraining our gross sales. Reduced business travel remains about the same as it has been as well as back to office/office occupancy. The stats I see published on the return to office seem mythical.
- Workers are not back in offices. [There is] soft lunch business, less daytime events, people moving out of downtown—[we] don’t need to be near the office anymore. A new apartment building across from one of our restaurants has a 13 percent occupancy.
- The Federal Reserve is not doing enough to slow inflation. They should have continued with a 50-basis-point increase.
Historical Data
Historical data can be downloaded dating back to January 2007.
Indexes
Download indexes for all indicators. For the definitions of all variables, see Data Definitions.
Texas Service Sector Outlook Survey |
Texas Retail Outlook Survey |
| Unadjusted | Unadjusted |
| Seasonally adjusted | Seasonally adjusted |
All Data
Download indexes and components of the indexes (percentage of respondents reporting increase, decrease, or no change). For the definitions of all variables, see Data Definitions.
Texas Service Sector Outlook Survey |
Texas Retail Outlook Survey |
| Unadjusted | Unadjusted |
| Seasonally adjusted | Seasonally adjusted |
Questions regarding the Texas Service Sector Outlook Survey can be addressed to Jesus Cañas at jesus.canas@dal.frb.org.
Sign up for our email alert to be automatically notified as soon as the latest Texas Service Sector Outlook Survey is released on the web.