
Texas Service Sector Outlook Survey
Growth in Texas service activity moderates
For this month’s survey, Texas business executives were asked supplemental questions on remote work and the impact of recent federal government legislation. Results for these questions from the Texas Manufacturing Outlook Survey, Texas Service Sector Outlook Survey and Texas Retail Outlook Survey have been released together. Read the special questions results.
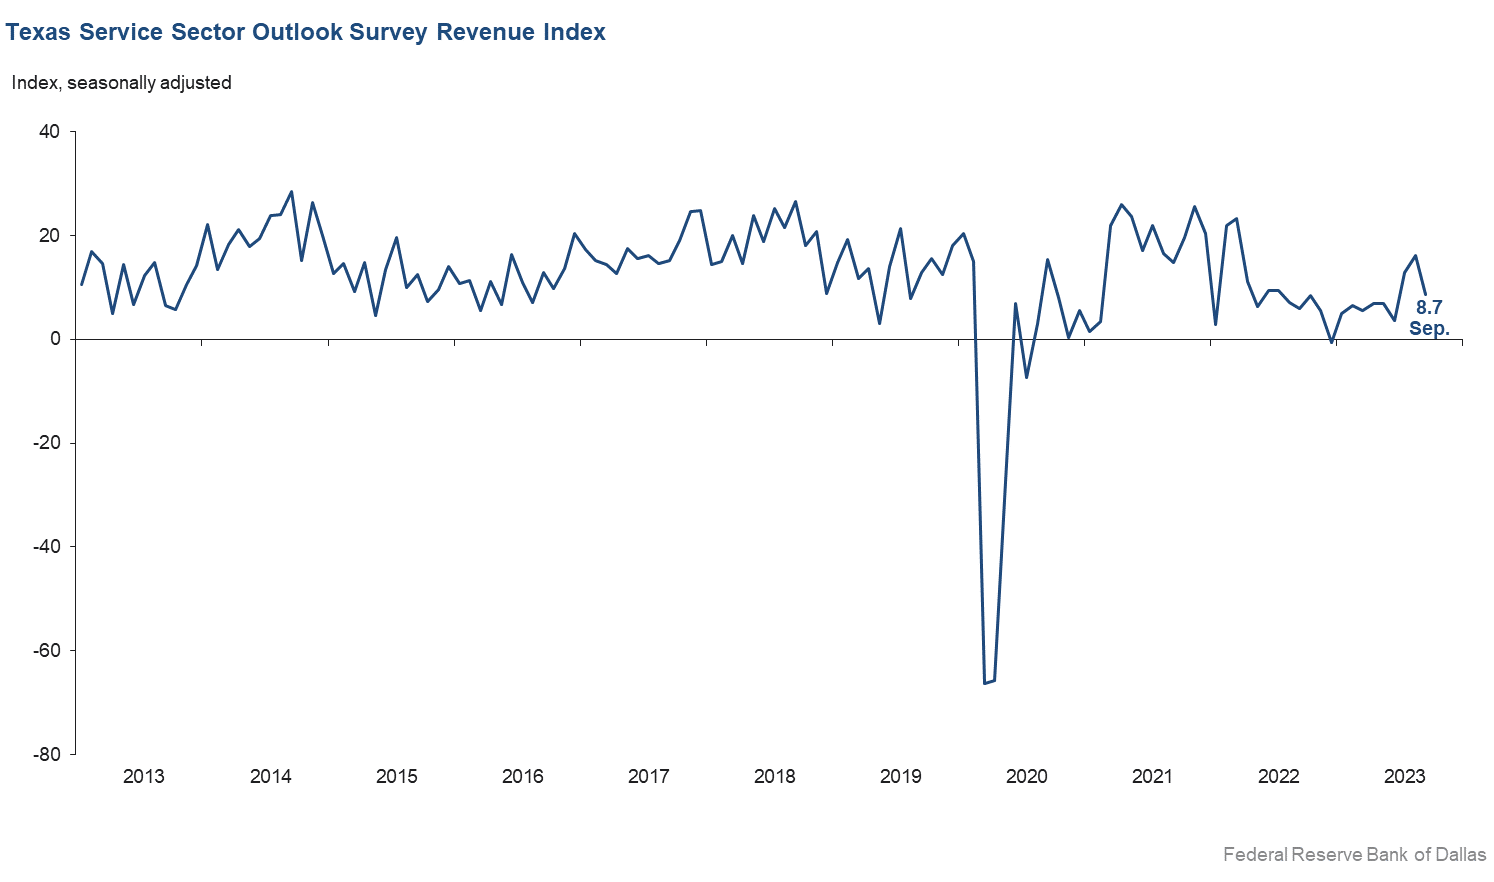
Texas service sector activity expanded at a slower pace in September, according to business executives responding to the Texas Service Sector Outlook Survey. The revenue index, a key measure of state service sector conditions, fell eight points to 8.7.
Labor market indicators pointed to slower growth in employment and modest growth in work hours. The employment index fell from 9.3 to 2.7, its lowest level in six months. The part-time employment index fell five points to -1.7, while the hours worked index was relatively unchanged at 3.0.
Perceptions of broader business conditions worsened in September. The general business activity index fell six points to -8.6 while the company outlook index edged down to -4.4. The outlook uncertainty index ticked up from 11.6 to 14.8.
Selling price pressures and wage growth eased while input prices pressures were relatively unchanged in September. The input prices index was flat at 37.6 while the selling prices index fell four points to 9.8, though both indexes remained above their respective series averages. The wages and benefits index fell two points to 18.5 but continued to exceed its average reading of 15.8.
Respondents’ expectations regarding future service sector activity were mixed in September. The future general business activity index fell from 3.9 to -3.4. The future revenue index remained positive but decreased six points to 31.8. Other future service sector activity indexes such as employment and capital expenditures also fell but remained in positive territory, reflecting expectations for continued growth in the next six months.

Texas Retail Outlook Survey
Texas retail sales deteriorate further
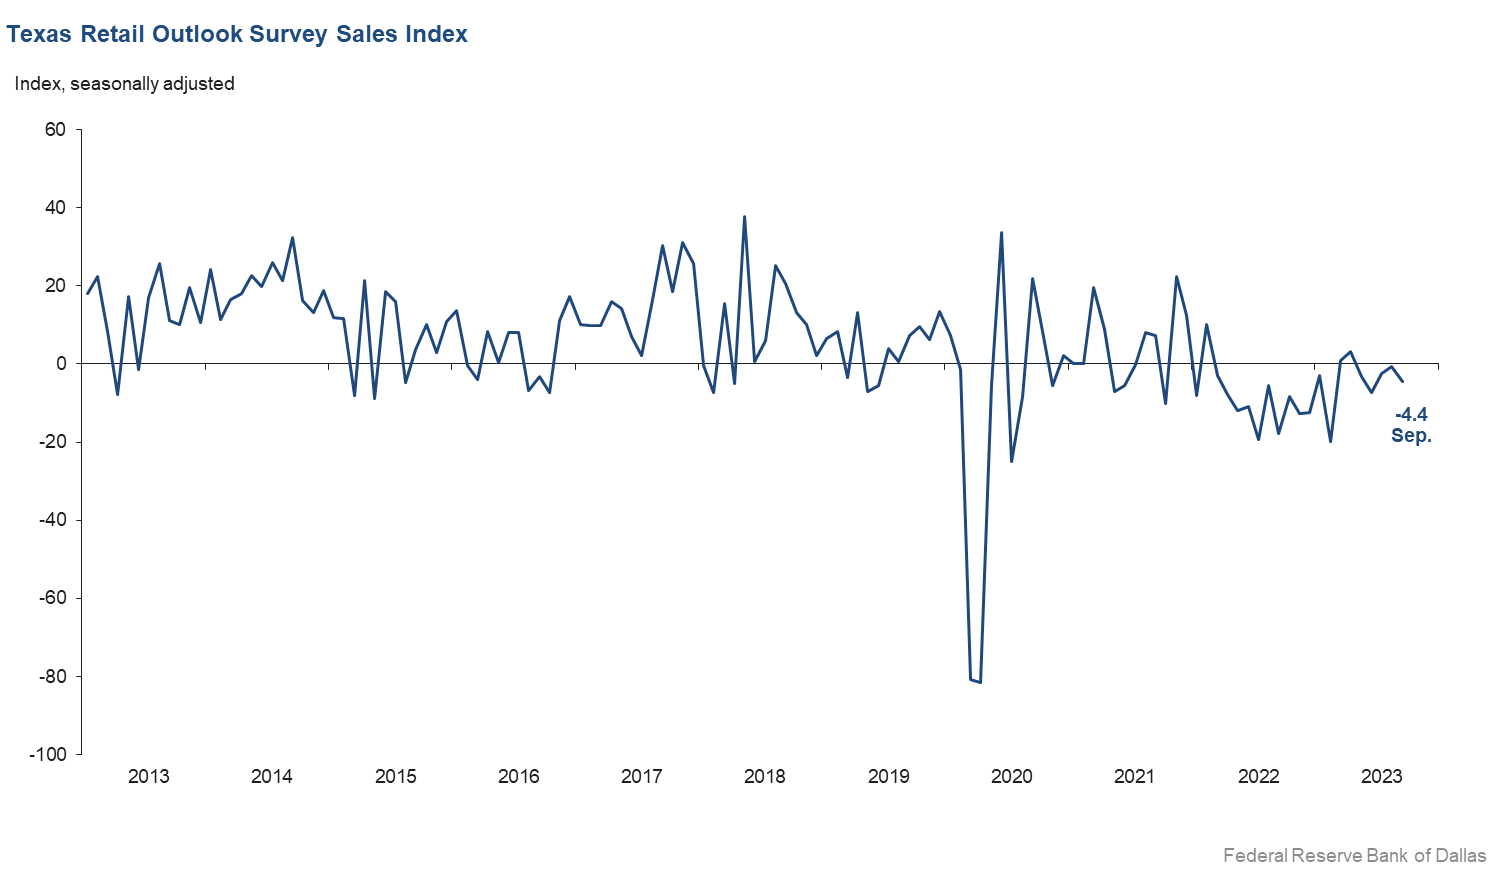
Retail sales declined in September, according to business executives responding to the Texas Retail Outlook Survey. The sales index, a key measure of state retail activity, fell from -0.6 to -4.4, marking its fifth consecutive month in negative territory. Retailers’ inventories increased at a slower rate, with the index declining from 17.2 to 13.9.
Retail labor market indicators reflected flat employment and workweeks in September. The employment index ticked down from 3.0 to 0.6, with the near-zero reading suggestive of no change in employment. The part-time employment index increased four points to 2.3, while the hours worked index rose 11 points to 0.6.
Retailers’ perceptions of broader business conditions were mixed in September. The general business activity index dropped from -4.0 to -10.2, while the company outlook index increased from -4.5 to 2.1. The outlook uncertainty index fell four points to 13.2.
Selling price pressures eased while input prices pressures rose in September. Wage pressures held steady. The selling prices index fell six points to 10.8, and the input prices index rose three points to 30.1. The wages and benefits index was flat at 18.5.
Expectations for future retail growth were mixed in September. The future general business activity index fell from 6.6 to -0.3, reflecting little change in expectations. The future sales index fell 11 points to 9.6, yet the positive reading indicates continued growth. Other indexes of future retail activity, such as employment and capital expenditures, showed mixed movements but remained in positive territory, reflecting expectations for continued growth in retail activity later in the year.
The Texas Retail Outlook Survey is a component of the Texas Service Sector Outlook Survey that uses information only from respondents in the retail and wholesale sectors.
Next release: October 31, 2023
Data were collected September 12–20, and 277 Texas service sector business executives, of which 54 were retailers, responded to the survey. The Dallas Fed conducts the Texas Service Sector Outlook Survey monthly to obtain a timely assessment of the state’s service sector activity. Firms are asked whether revenue, employment, prices, general business activity and other indicators increased, decreased or remained unchanged over the previous month.
Survey responses are used to calculate an index for each indicator. Each index is calculated by subtracting the percentage of respondents reporting a decrease from the percentage reporting an increase. When the share of firms reporting an increase exceeds the share reporting a decrease, the index will be greater than zero, suggesting the indicator has increased over the prior month. If the share of firms reporting a decrease exceeds the share reporting an increase, the index will be below zero, suggesting the indicator has decreased over the prior month. An index will be zero when the number of firms reporting an increase is equal to the number of firms reporting a decrease. Data have been seasonally adjusted as necessary.
Texas Service Sector Outlook Survey
Historical data are available from January 2007 to the most current release month.
| Business Indicators Relating to Facilities and Products in Texas Current (versus previous month) | ||||||||
| Indicator | Sep Index | Aug Index | Change | Series Average | Trend* | % Reporting Increase | % Reporting No Change | % Reporting Decrease |
Revenue | 8.7 | 16.2 | –7.5 | 11.0 | 9(+) | 31.2 | 46.3 | 22.5 |
Employment | 2.7 | 9.3 | –6.6 | 6.5 | 6(+) | 15.5 | 71.6 | 12.8 |
Part–Time Employment | –1.7 | 2.8 | –4.5 | 1.5 | 1(–) | 5.2 | 87.9 | 6.9 |
Hours Worked | 3.0 | 2.4 | +0.6 | 2.8 | 3(+) | 8.7 | 85.6 | 5.7 |
Wages and Benefits | 18.5 | 20.4 | –1.9 | 15.8 | 40(+) | 21.2 | 76.1 | 2.7 |
Input Prices | 37.6 | 37.8 | –0.2 | 27.8 | 41(+) | 39.7 | 58.2 | 2.1 |
Selling Prices | 9.8 | 14.2 | –4.4 | 7.6 | 38(+) | 19.1 | 71.6 | 9.3 |
Capital Expenditures | 6.5 | 9.2 | –2.7 | 10.1 | 38(+) | 14.7 | 77.1 | 8.2 |
| General Business Conditions Current (versus previous month) | ||||||||
| Indicator | Sep Index | Aug Index | Change | Series Average | Trend** | % Reporting Improved | % Reporting No Change | % Reporting Worsened |
Company Outlook | –4.4 | –1.2 | –3.2 | 4.6 | 2(–) | 13.2 | 69.2 | 17.6 |
General Business Activity | –8.6 | –2.7 | –5.9 | 2.8 | 16(–) | 15.5 | 60.4 | 24.1 |
| Indicator | Sep Index | Aug Index | Change | Series Average | Trend* | % Reporting Increase | % Reporting No Change | % Reporting Decrease |
Outlook Uncertainty | 14.8 | 11.6 | +3.2 | 13.5 | 28(+) | 23.9 | 67.0 | 9.1 |
| Business Indicators Relating to Facilities and Products in Texas Future (six months ahead) | ||||||||
| Indicator | Sep Index | Aug Index | Change | Series Average | Trend* | % Reporting Increase | % Reporting No Change | % Reporting Decrease |
Revenue | 31.8 | 37.3 | –5.5 | 37.6 | 41(+) | 48.2 | 35.3 | 16.4 |
Employment | 25.9 | 27.9 | –2.0 | 23.3 | 41(+) | 37.1 | 51.7 | 11.2 |
Part–Time Employment | 0.8 | 3.6 | –2.8 | 6.7 | 5(+) | 10.1 | 80.6 | 9.3 |
Hours Worked | 3.4 | 10.3 | –6.9 | 5.9 | 41(+) | 10.1 | 83.2 | 6.7 |
Wages and Benefits | 42.8 | 42.4 | +0.4 | 37.5 | 41(+) | 46.6 | 49.6 | 3.8 |
Input Prices | 45.6 | 47.8 | –2.2 | 44.7 | 201(+) | 50.2 | 45.3 | 4.6 |
Selling Prices | 26.9 | 28.2 | –1.3 | 24.7 | 41(+) | 36.5 | 53.9 | 9.6 |
Capital Expenditures | 12.1 | 14.9 | –2.8 | 23.2 | 40(+) | 23.2 | 65.8 | 11.1 |
| General Business Conditions Future (six months ahead) | ||||||||
| Indicator | Sep Index | Aug Index | Change | Series Average | Trend** | % Reporting Improved | % Reporting No Change | % Reporting Worsened |
Company Outlook | 7.6 | 9.6 | –2.0 | 15.8 | 4(+) | 24.8 | 58.0 | 17.2 |
General Business Activity | –3.4 | 3.9 | –7.3 | 12.4 | 1(–) | 20.5 | 55.6 | 23.9 |
Historical data are available from January 2007 to the most current release month.
| Business Indicators Relating to Facilities and Products in Texas Retail (versus previous month) | ||||||||
| Indicator | Sep Index | Aug Index | Change | Series Average | Trend* | % Reporting Increase | % Reporting No Change | % Reporting Decrease |
| Retail Activity in Texas | ||||||||
Sales | –4.4 | –0.6 | –3.8 | 4.2 | 5(–) | 28.6 | 38.4 | 33.0 |
Employment | 0.6 | 3.0 | –2.4 | 1.9 | 4(+) | 10.4 | 79.8 | 9.8 |
Part–Time Employment | 2.3 | –1.7 | +4.0 | –1.6 | 1(+) | 5.6 | 91.1 | 3.3 |
Hours Worked | 0.6 | –10.1 | +10.7 | –1.9 | 1(+) | 7.8 | 85.0 | 7.2 |
Wages and Benefits | 18.5 | 19.0 | –0.5 | 11.3 | 38(+) | 20.7 | 77.1 | 2.2 |
Input Prices | 30.1 | 26.9 | +3.2 | 22.7 | 41(+) | 33.7 | 62.7 | 3.6 |
Selling Prices | 10.8 | 16.5 | –5.7 | 13.9 | 40(+) | 23.7 | 63.4 | 12.9 |
Capital Expenditures | 13.1 | 3.7 | +9.4 | 8.1 | 2(+) | 14.8 | 83.5 | 1.7 |
Inventories | 13.9 | 17.2 | –3.3 | 2.5 | 16(+) | 29.0 | 55.9 | 15.1 |
| Companywide Retail Activity | ||||||||
Companywide Sales | –9.9 | 0.3 | –10.2 | 5.5 | 1(–) | 24.6 | 41.0 | 34.5 |
Companywide Internet Sales | –9.2 | 0.0 | –9.2 | 4.4 | 1(–) | 14.0 | 62.8 | 23.2 |
| General Business Conditions, Retail Current (versus previous month) | ||||||||
| Indicator | Sep Index | Aug Index | Change | Series Average | Trend** | % Reporting Improved | % Reporting No Change | % Reporting Worsened |
Company Outlook | 2.1 | –4.5 | +6.6 | 2.3 | 1(+) | 19.5 | 63.1 | 17.4 |
General Business Activity | –10.2 | –4.0 | –6.2 | –1.6 | 3(–) | 20.2 | 49.4 | 30.4 |
| Outlook Uncertainty Current (versus previous month) | ||||||||
| Indicator | Sep Index | Aug Index | Change | Series Average | Trend* | % Reporting Increase | % Reporting No Change | % Reporting Decrease |
Outlook Uncertainty | 13.2 | 16.9 | –3.7 | 11.3 | 28(+) | 22.6 | 67.9 | 9.4 |
| Business Indicators Relating to Facilities and Products in Texas, Retail Future (six months ahead) | ||||||||
| Indicator | Sep Index | Aug Index | Change | Series Average | Trend* | % Reporting Increase | % Reporting No Change | % Reporting Decrease |
| Retail Activity in Texas | ||||||||
Sales | 9.6 | 20.3 | –10.7 | 31.1 | 4(+) | 32.9 | 43.8 | 23.3 |
Employment | 16.9 | 11.0 | +5.9 | 13.0 | 41(+) | 28.3 | 60.3 | 11.4 |
Part–Time Employment | 5.6 | –0.2 | +5.8 | 1.5 | 1(+) | 11.9 | 81.8 | 6.3 |
Hours Worked | 4.2 | 0.7 | +3.5 | 2.6 | 2(+) | 10.6 | 83.0 | 6.4 |
Wages and Benefits | 34.3 | 31.0 | +3.3 | 29.2 | 41(+) | 38.0 | 58.3 | 3.7 |
Input Prices | 29.4 | 32.8 | –3.4 | 34.1 | 41(+) | 41.2 | 47.1 | 11.8 |
Selling Prices | 13.8 | 20.7 | –6.9 | 29.4 | 41(+) | 31.4 | 51.0 | 17.6 |
Capital Expenditures | 3.9 | 10.1 | –6.2 | 17.1 | 2(+) | 13.7 | 76.5 | 9.8 |
Inventories | 5.8 | 9.1 | –3.3 | 10.8 | 41(+) | 26.6 | 52.6 | 20.8 |
| Companywide Retail Activity | ||||||||
Companywide Sales | 11.9 | 15.4 | –3.5 | 29.6 | 4(+) | 33.9 | 44.1 | 22.0 |
Companywide Internet Sales | 4.5 | 15.6 | –11.1 | 21.6 | 3(+) | 17.8 | 68.9 | 13.3 |
| General Business Conditions, Retail Future (six months ahead) | ||||||||
| Indicator | Sep Index | Aug Index | Change | Series Average | Trend** | % Reporting Improved | % Reporting No Change | % Reporting Worsened |
Company Outlook | 13.8 | 3.9 | +9.9 | 15.5 | 4(+) | 24.9 | 64.0 | 11.1 |
General Business Activity | –0.3 | 6.6 | –6.9 | 10.9 | 1(–) | 24.3 | 51.1 | 24.6 |
*Shown is the number of consecutive months of expansion or contraction in the underlying indicator. Expansion is indicated by a positive index reading and denoted by a (+) in the table. Contraction is indicated by a negative index reading and denoted by a (–) in the table.
**Shown is the number of consecutive months of improvement or worsening in the underlying indicator. Improvement is indicated by a positive index reading and denoted by a (+) in the table. Worsening is indicated by a negative index reading and denoted by a (–) in the table.
Data have been seasonally adjusted as necessary.
Texas Service Sector Outlook Survey
Texas Retail Outlook Survey
Texas Service Sector Outlook Survey
Comments from survey respondents
These comments are from respondents’ completed surveys and have been edited for publication.
- Near term, there’s a great deal of uncertainty to forecast workload and labor availability. Employee retention, wage pressure and productivity are still problematic. Employees' focus on work seems to have not yet recovered from the COVID-era entitlement thinking and lack of drive.
- Things are not getting better. We wrote the fewest number of proposals in a seven-year period─even worse than during the pandemic. High interest rates and construction pricing are really hurting new construction starts. Developers are leery of starting new projects. We are seeing no signs of things improving.
- A possible federal government shutdown is very concerning.
- While our company is poised for growth and improved profitability, it feels like the economy in general is slowing down. We are most worried about a possible precipitous drop in the economy.
- Our outlook is about the same as it was last month. The transaction volume in the real estate market has continued to slow down, and this is going to hurt the overall economy. We will have a better idea of where this market is going by the end of the year, but it doesn't look like the real estate market will recover anytime soon.
- Very hard to find operational talent.
- Sales have slowed slightly. We own a retained search firm. People are still looking for talent, but they seem a little less interested in signing a contract than one or two months ago.
- We are adding a third person to the team and interviewing for a fourth. With that in mind, we are feeling more confident with the increase in business inquiries in the pipeline that we have built. However, the hiring of additional staff causes some worry about sustainability.
- Industrial development relative to facilities has decreased, reportedly because of the increase in cost of financing.
- Most new business opportunities have dried up; work with existing clients is shrinking or moving to near-shore partners.
- Generally, we are seeing a slight increase in new business activity. We hired a salesperson that should increase revenue over the next six months.
- Inflation, uncertainty about China and the U.S. political situation are the three largest distractions for business development.
- The labor pool continues to be tight and isn't changing. Clients and companies are nervous about hiring due to economic uncertainty, inflation, interest rates and more. Hiring decisions are taking longer, leading to reduced revenue for search and staffing firms. We are broadening our client and candidate base, communicating to clients that the labor pool is not changing and elongating hiring decisions is not to their benefit, and letting candidates know wages are not increasing as they were before. While we anticipate an uptick in hiring in 2024 after the dust from 2023 settles, we have an election year, which will lead to continued uncertainty. Adapting and being responsive will be key.
- We are seeing less generation of material available for recycling from industrial manufacturing. This indicates a slowdown in business activity.
- Our enrollment continues to increase, which increases total revenue. The forecasted college-demographic cliff has not hit our region yet, and that will likely be true for a few more years.
- We have noticed fewer new customers, and established customers are reluctant or slow to make purchases.
- Inflation is eating up all our planning costs, and I see nothing but increasing costs.
- We are coming off a very slow second half of August and a continuation of the same in September. This business cycle is as bad as we have seen in some time.
- We do not believe the Federal Reserve has navigated a soft landing. We think they have delayed the recession. We say that because it seems business is more difficult in the last 45 days. Equipment prices have increased 30 percent in the last couple of years, and interest rates have tripled. It would be unreasonable to think those increased costs are not going to significantly decrease business at some time.
- While demand for our brand of property management services is needed more than ever, we are increasingly concerned that multifamily debt holders' delay-and-pray approach is obfuscating the true extent of problematic loans. While many challenged owners are finding ways to make their mortgage payments, other performance metrics such as debt service coverage ratio are wildly out of whack. To make payments, apartment owners with floating rate debt are running up payables, deferring maintenance and taking shortcuts that are undermining the value of the underlying assets and shortchanging renters. In our opinion, the sooner everyone in the food chain accepts their slice of the pain pie, the sooner this asset class will recover and the better residents will be served. Unfortunately, the game of chicken many are playing is only serving to destroy values, companies and the life savings of retirees who have invested.
- Capital market conditions (debt and equity) for commercial real estate transactions are challenging. We don't anticipate thawing prior to the middle of next year.
- We are expecting a softening real estate market for the next 12 to 18 months.
- We are entering into our busy season, which is the reason for the current revenue increase. We anticipate revenue to fall sharply again in November.
- The biggest risk is access to working capital. Banks seem to be tightening and looking for alternate forms of capital including hard money lenders.
- General uncertainty about the economy heading into an election year is keeping a lid on capital expenditures.
- In the transportation industry, prices have continued to decrease while costs increase.
- We remain optimistic about the mid-term outlook for the energy sector in Texas.
- Uncertainties about a government shutdown and demand leading into the holidays have created general corporate anxiety. While some sectors of the economy seem to be loosening up, others are just as or more at risk as they were six months ago. While we are not experiencing any materially adverse events, the fear, uncertainty and doubt about the coming quarter are creating a tepid outlook and a general feeling of healthy pessimism.
- We repair trucks for small companies and owner operators. Their business has slowed down, which affects our business. Freight hasn't bumped up much with the start of school.
- Prospects as well as current customers are pushing for cost reductions. We are estimating what the fallout will be to our business, so expense and employee reductions are being considered. Our market is greatly impacted by the increased Federal Deposit Insurance Corp. charges and requirements due to the few banks that failed in the spring.
- The expected increase in 2024 is due to software product productivity developments and related interest, plus tech ease of use and adoption, and security of the platform.
- Increased interest rates have definitely killed deals, and the next 12 to 18 months look like a huge slowdown in development and real estate deals. It’s time to stop the interest rate increases.
- The current economic environment has created many challenges for the small businesses in our communities. The political environment has created concern about the future of our country and the impact on business activity, especially in rural markets.
- As interest rates for commercial mortgages continue to increase, and as more property owners come to realize that higher rates are normal rates, we expect more borrowers will begin to refinance property for longer maturities or terms. Additionally, over the next six to 12 months, borrowers and lenders who are faced with maturing loans, which cannot be refinanced with the same lender, will be forced to do things they have been postponing, especially at year-end 2023 and at the end of the first quarter of 2024.
- Hiring new (reliable) truck drivers is almost impossible.
- We think weather is a huge factor in Dallas right now. People are over the heat, and they don't get out. Our online business has picked up a little bit but still not enough to offset the decrease. People aren't going anywhere with the heat.
- The rise in interest rates is greatly affecting the ability of small businesses to borrow money in the short term.
- We are seeing more affordability issues with the retail customer, and it is affecting selling prices. Used-car values are dropping as new-vehicle inventories increase and pricing gets discounted.
- The United Auto Workers (UAW) union strike is going to affect us for sure.
- Market conditions continue to deteriorate. Affordability is a major concern. The UAW strike looms, and the impact, if it occurs, will be devastating.
- Customer traffic and confidence has dropped in September. Increased interest rates and inflation combined have raised monthly payments above affordability.
- We are seeing a softening in the marketplace; however, we have been able to offset this softening by increasing market share.
- Housing activity continues to drop. For retail, most sales are tied to people moving from one place to another. That’s not happening here.
- As compared to 2019, lack of downtown office activity as well as decreased business travel continue to be significant drags on revenue. Labor continues to be a problem, and new-hire turnover remains higher than pre-COVID. While slowing inflation has contributed to lower cost of goods sold, it is significantly higher than pre-COVID. We struggled to find profit and loss insurance and were not able to insure for our full value.
Historical Data
Historical data can be downloaded dating back to January 2007.
Indexes
Download indexes for all indicators. For the definitions of all variables, see data definitions.
Texas Service Sector Outlook Survey |
Texas Retail Outlook Survey |
| Unadjusted | Unadjusted |
| Seasonally adjusted | Seasonally adjusted |
All Data
Download indexes and components of the indexes (percentage of respondents reporting increase, decrease, or no change). For the definitions of all variables, see data definitions.
Texas Service Sector Outlook Survey |
Texas Retail Outlook Survey |
| Unadjusted | Unadjusted |
| Seasonally adjusted | Seasonally adjusted |
Questions regarding the Texas Service Sector Outlook Survey can be addressed to Jesus Cañas at jesus.canas@dal.frb.org.
Sign up for our email alert to be automatically notified as soon as the latest Texas Service Sector Outlook Survey is released on the web.