
Texas Service Sector Outlook Survey
Growth resumes in Texas service sector, but outlooks continue to worsen
For this month’s survey, Texas business executives were asked supplemental questions on credit conditions. Results for these questions from the Texas Manufacturing Outlook Survey, Texas Service Sector Outlook Survey and Texas Retail Outlook Survey have been released together. Read the special questions results.
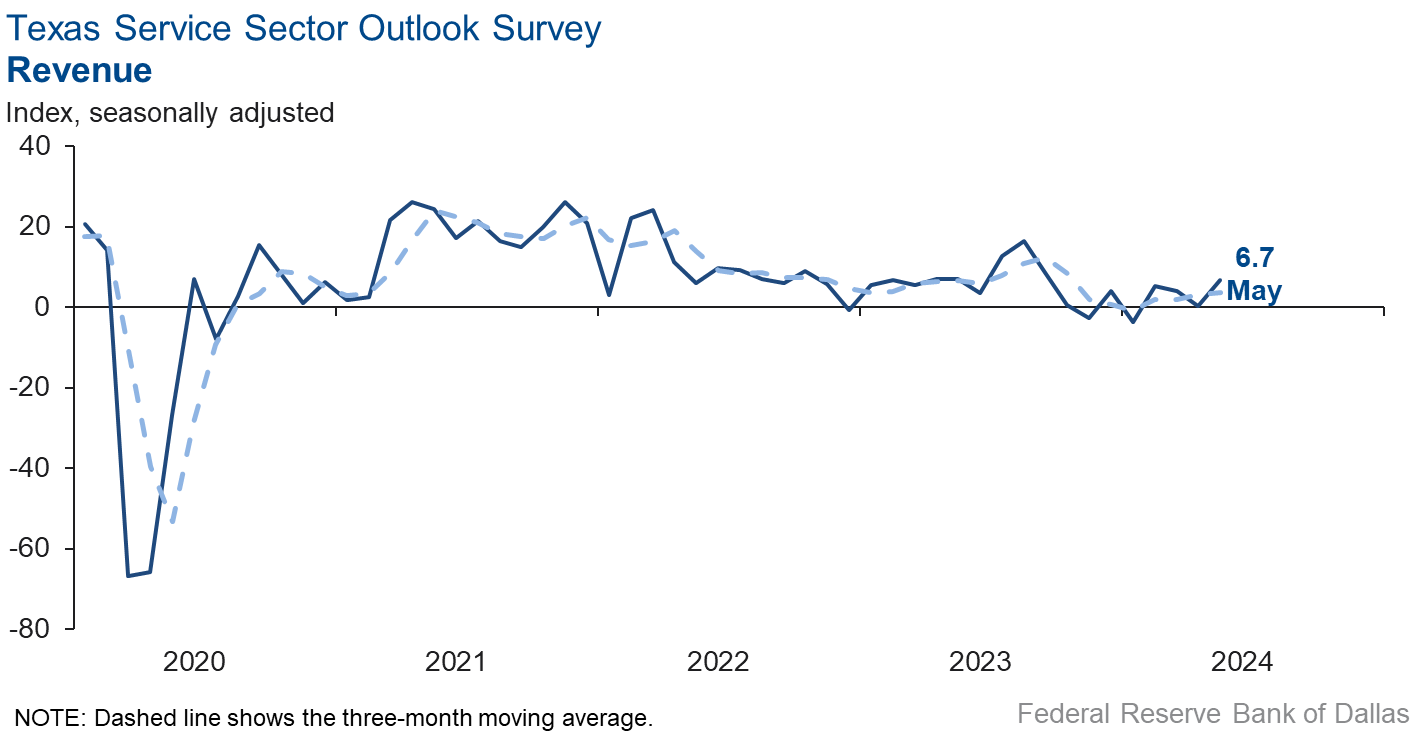
Growth in the Texas service sector expanded in May after activity stalled in April, according to business executives responding to the Texas Service Sector Outlook Survey. The revenue index, a key measure of state service sector conditions, increased from 0.3 to 6.7, a reading suggestive of an increase in activity.
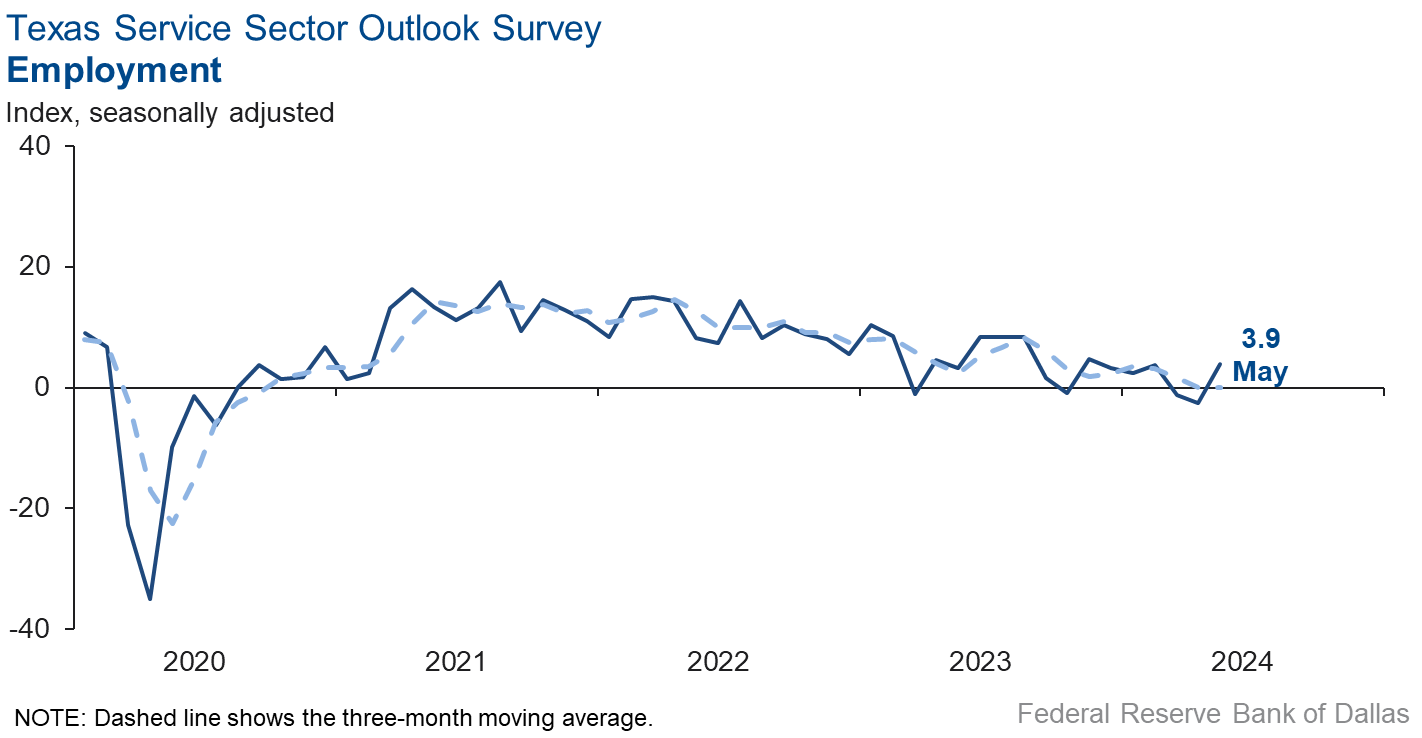
Labor market measures suggested a resumption of employment growth but no improvement in workweeks in May. The employment index jumped from -2.6 to 3.9. The part-time employment index fell to -2.5, while the hours worked index increased two points to -0.4, with the near-zero reading suggestive of flat growth.
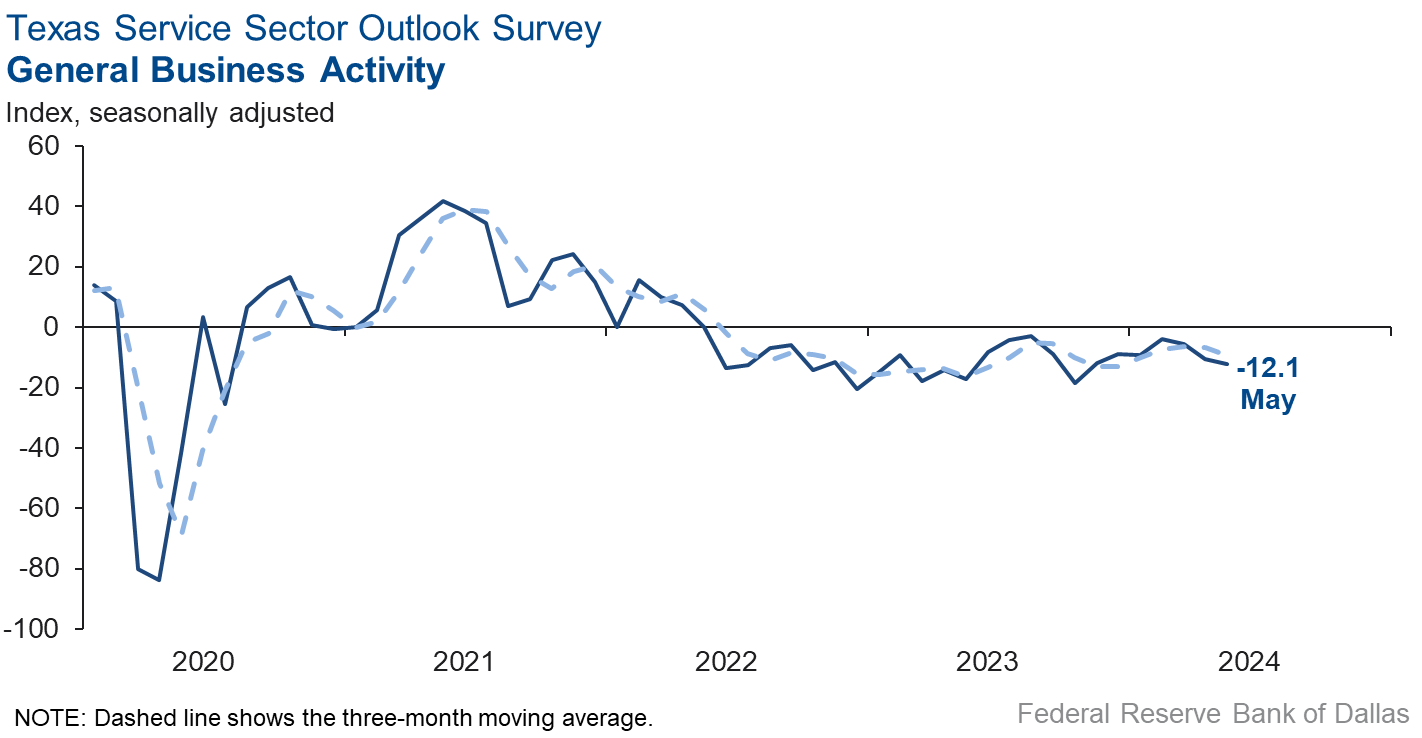
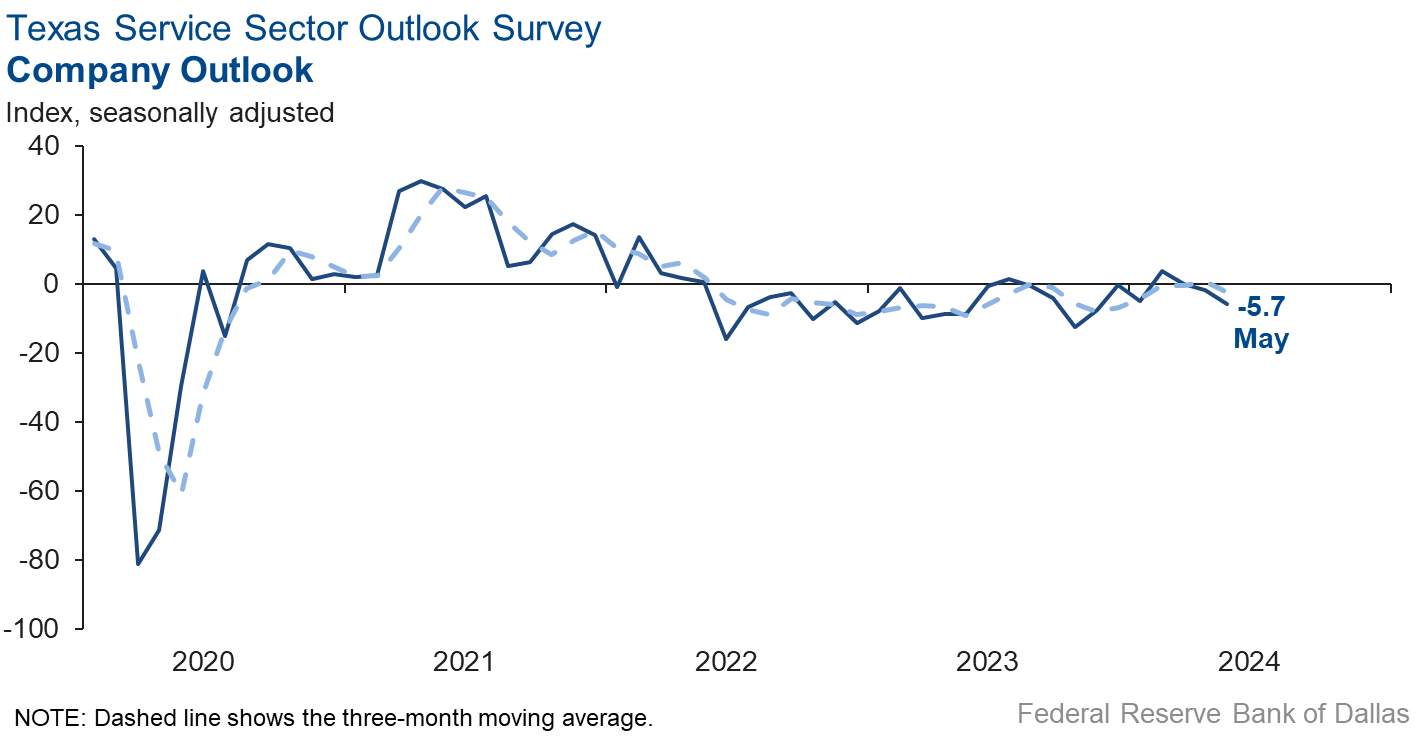
Respondents in May continued to perceive worsening broader business conditions. The general business activity index remained negative and fell two points to -12.1. The company outlook index also fell, from -1.8 to -5.7. The outlook uncertainty index was mostly steady at 12.1.
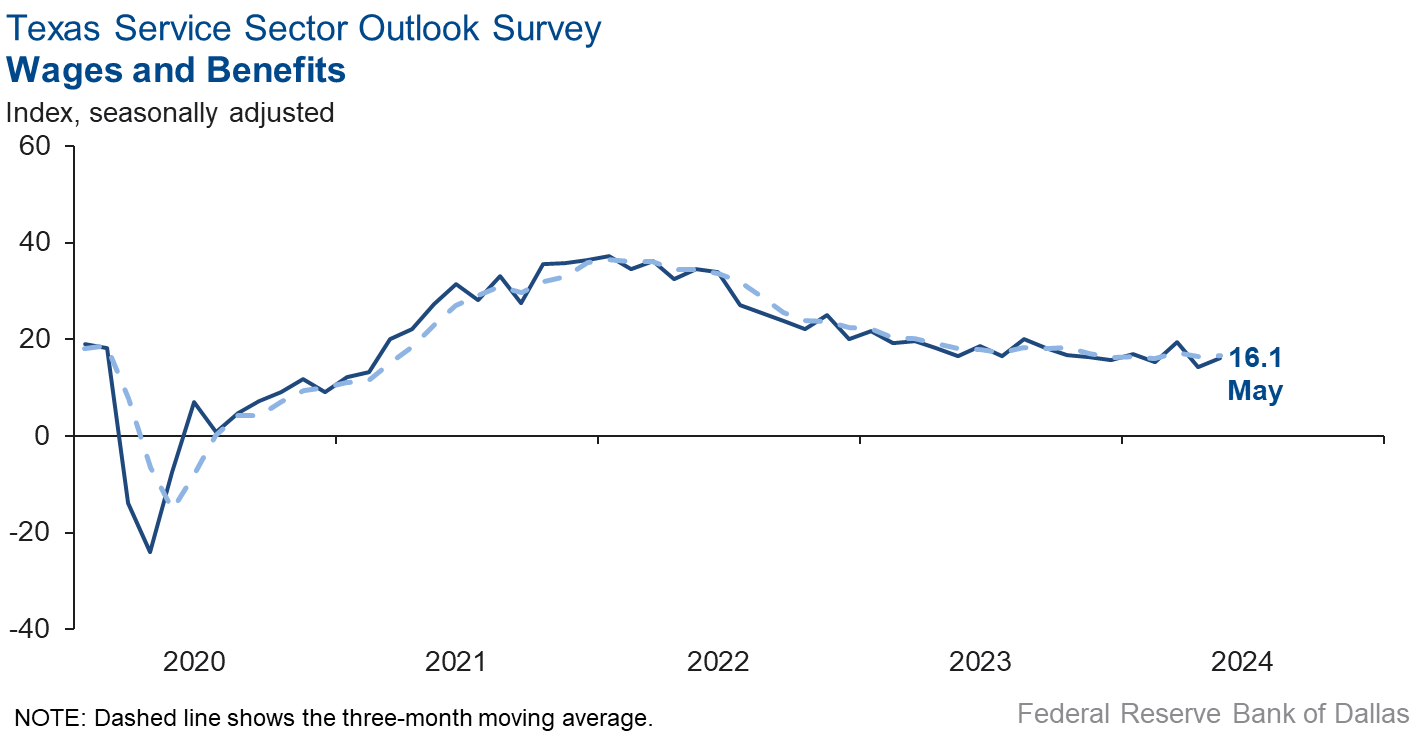
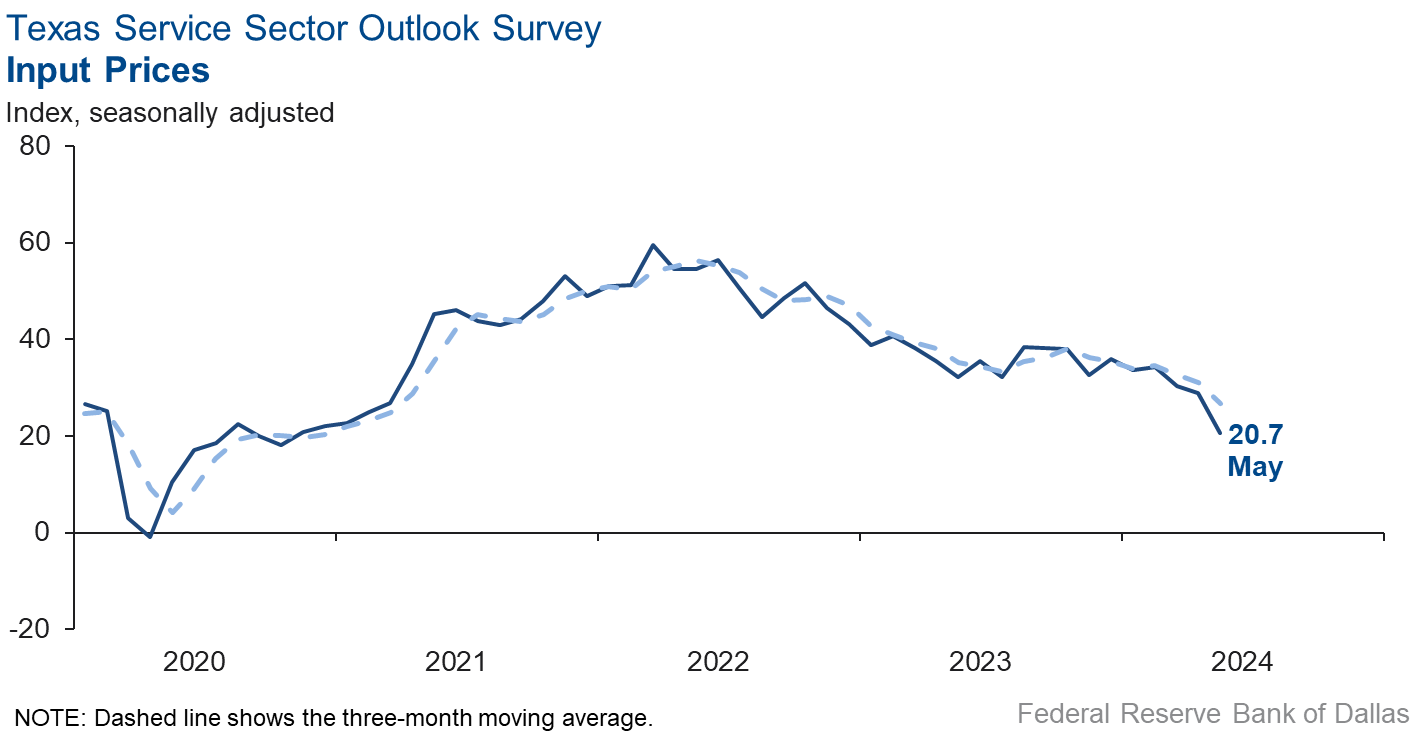
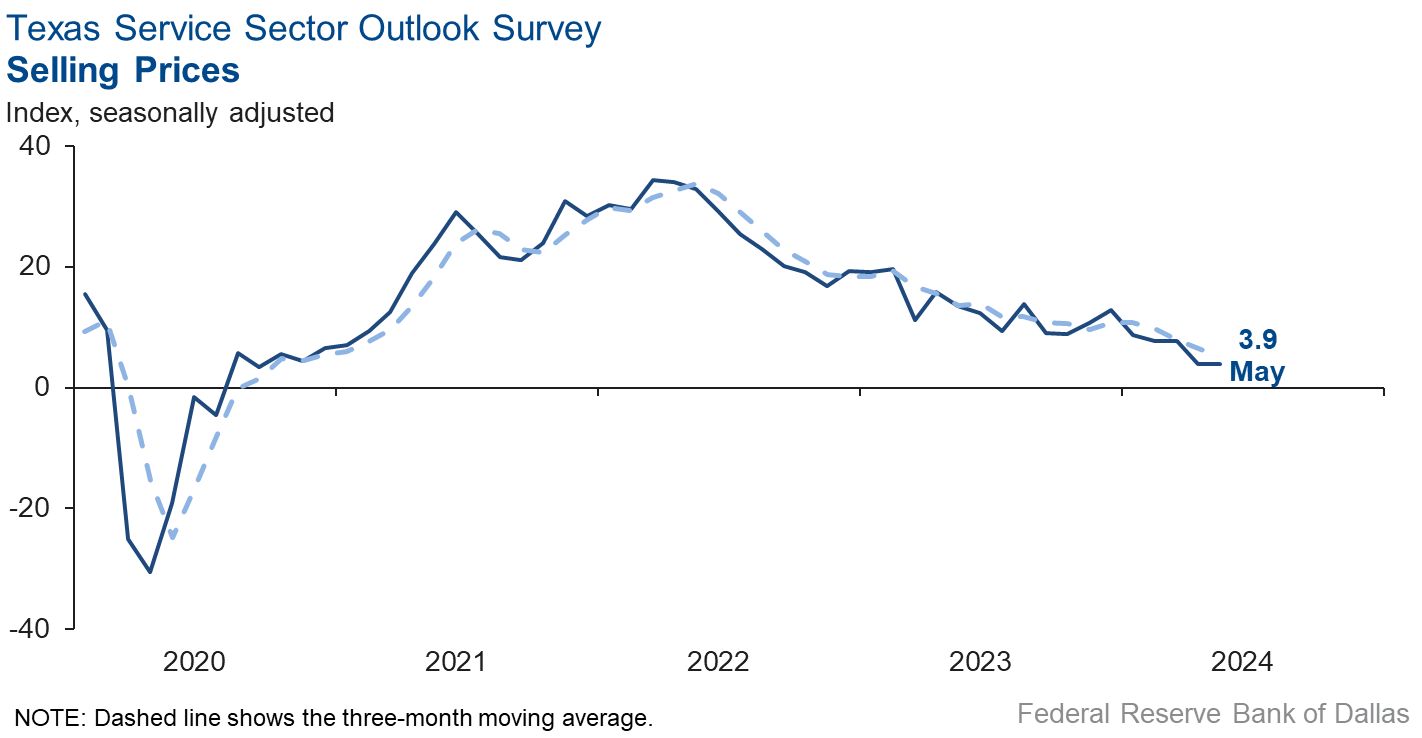
Input price pressures continued to ease, and selling price pressures remained the same in May. Wage pressures increased slightly. The input price index fell from 28.8 to 20.7, while the selling price index was unchanged at 3.9. The wages and benefits index increased two points to 16.1.
Respondents’ expectations regarding future business activity reflected optimism in May. The future general business activity index improved to neutral territory, increasing from -1.9 to 1.1. The future revenue index stayed positive but fell two points to 31.1 Other future service sector activity indexes such as employment and capital expenditures remained in positive territory, reflecting expectations for continued growth in the next six months.

Texas Retail Outlook Survey
Texas retail sales weaken further
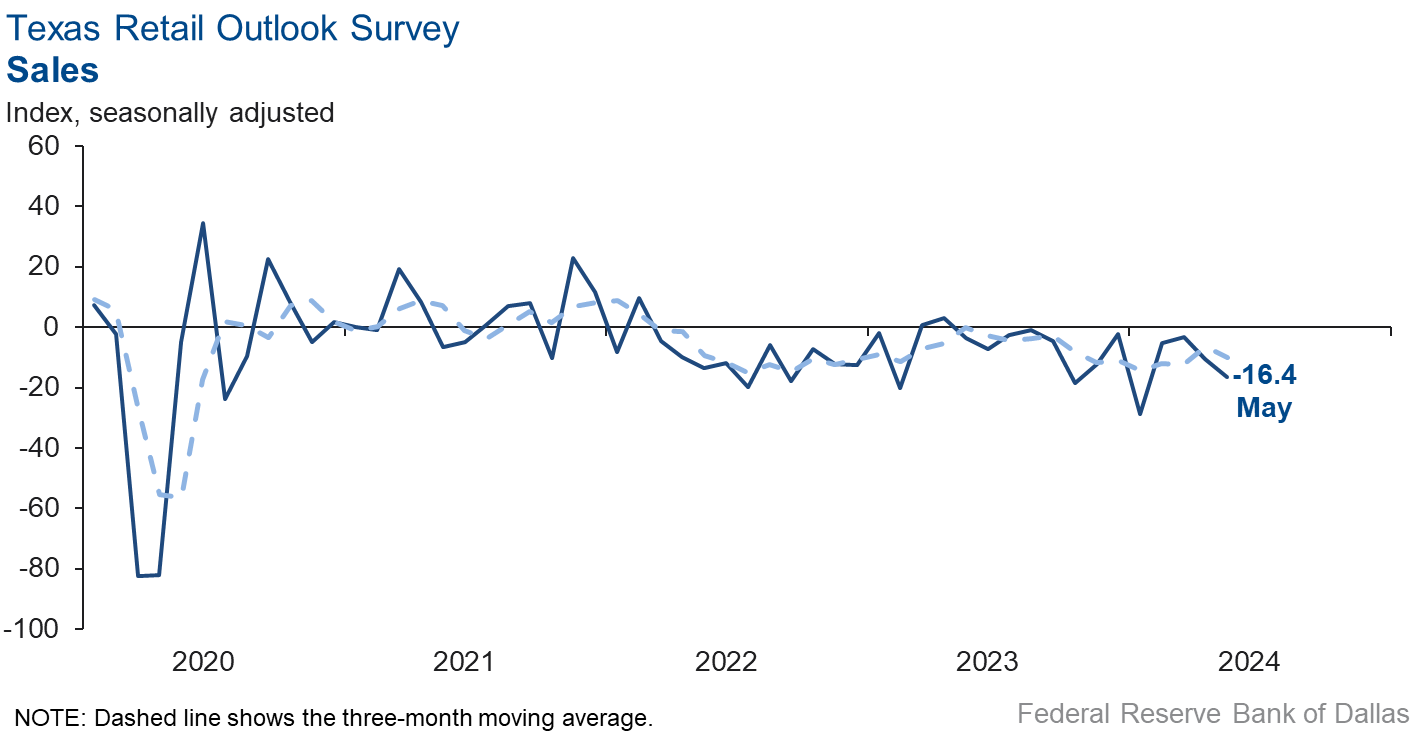
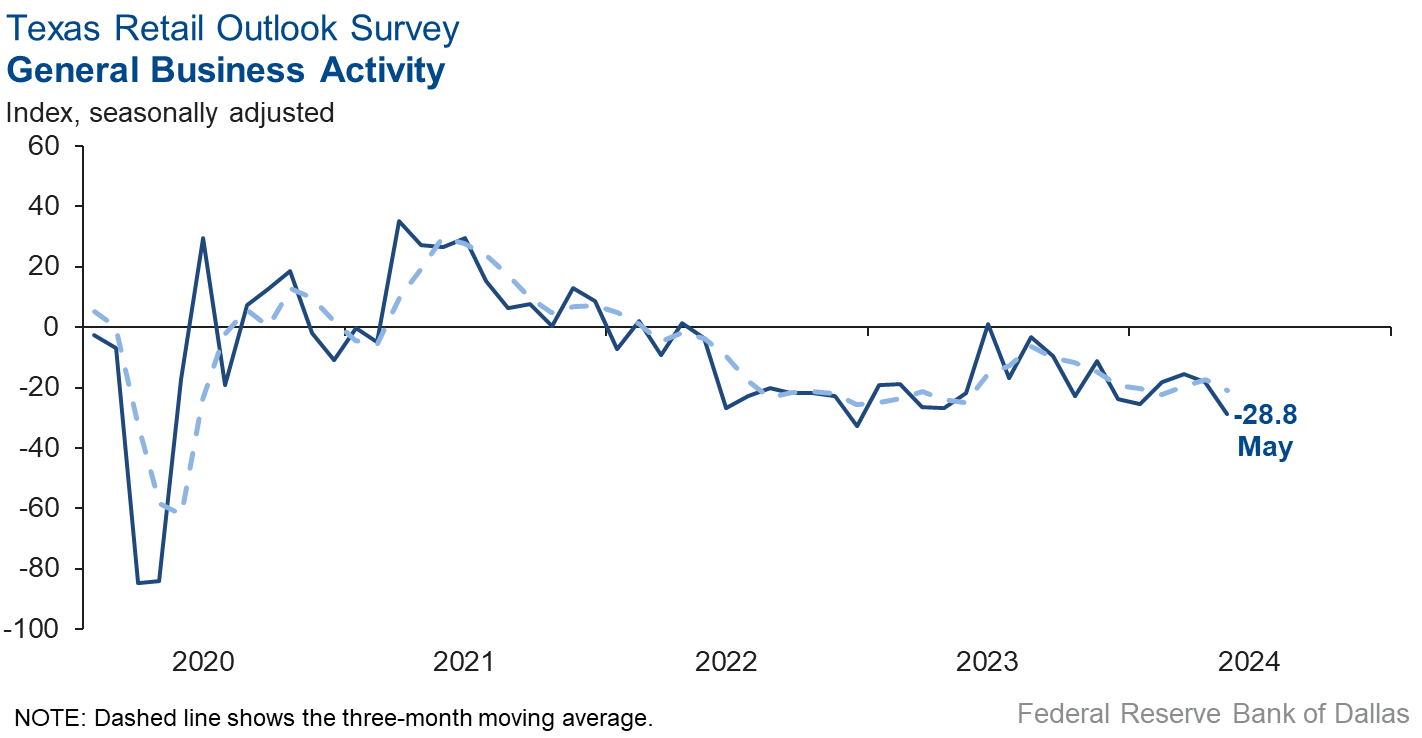
Retail sales activity declined in May, according to business executives responding to the Texas Retail Outlook Survey. The sales index, a key measure of state retail activity, fell from -10.4 to -16.4, indicating retail sales fell at a faster rate than during the previous month. Retailers’ inventories increased over the month, with the May index at 2.4.
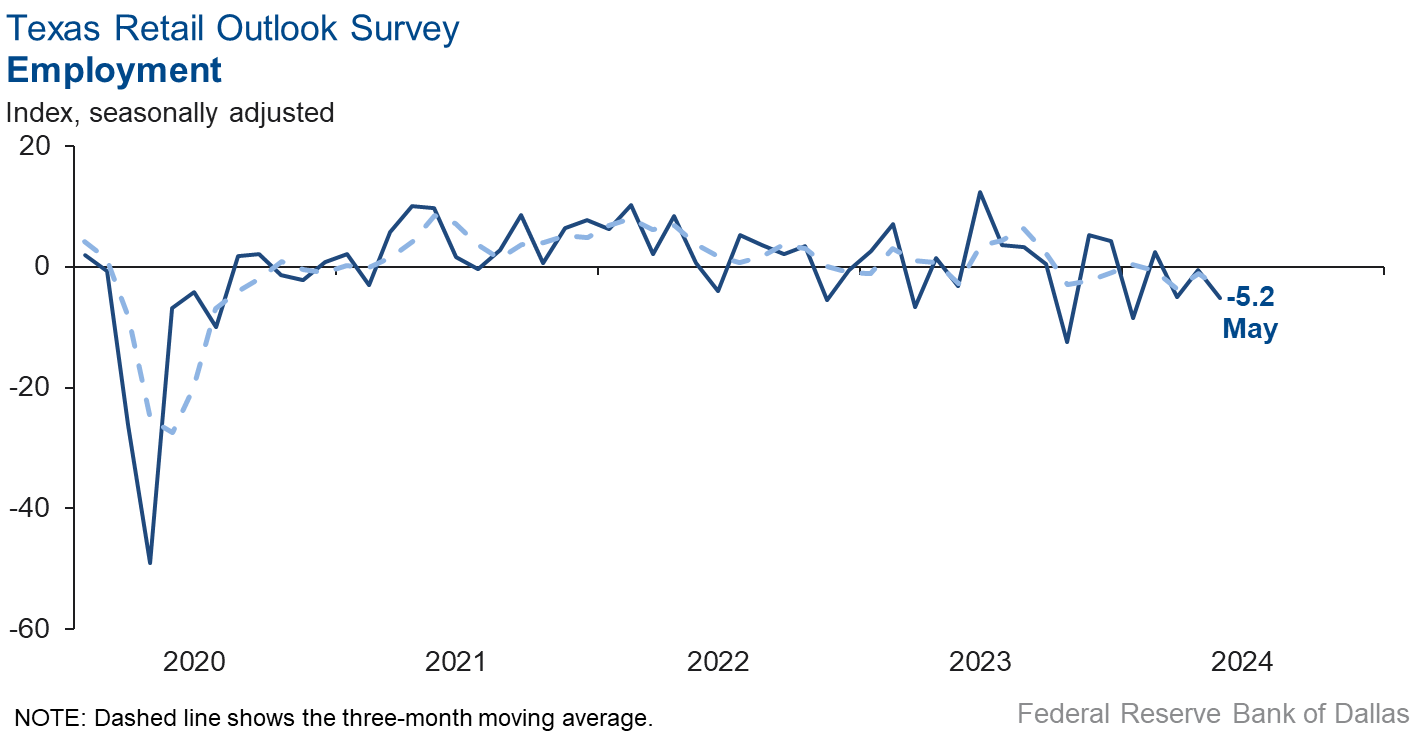
Retail labor market indicators suggested a contraction in employment and workweeks in May. The employment index fell from -0.5 to -5.2, while the part-time employment index fell 10 points to -7.0. The hours worked index continued in negative territory at -4.2.
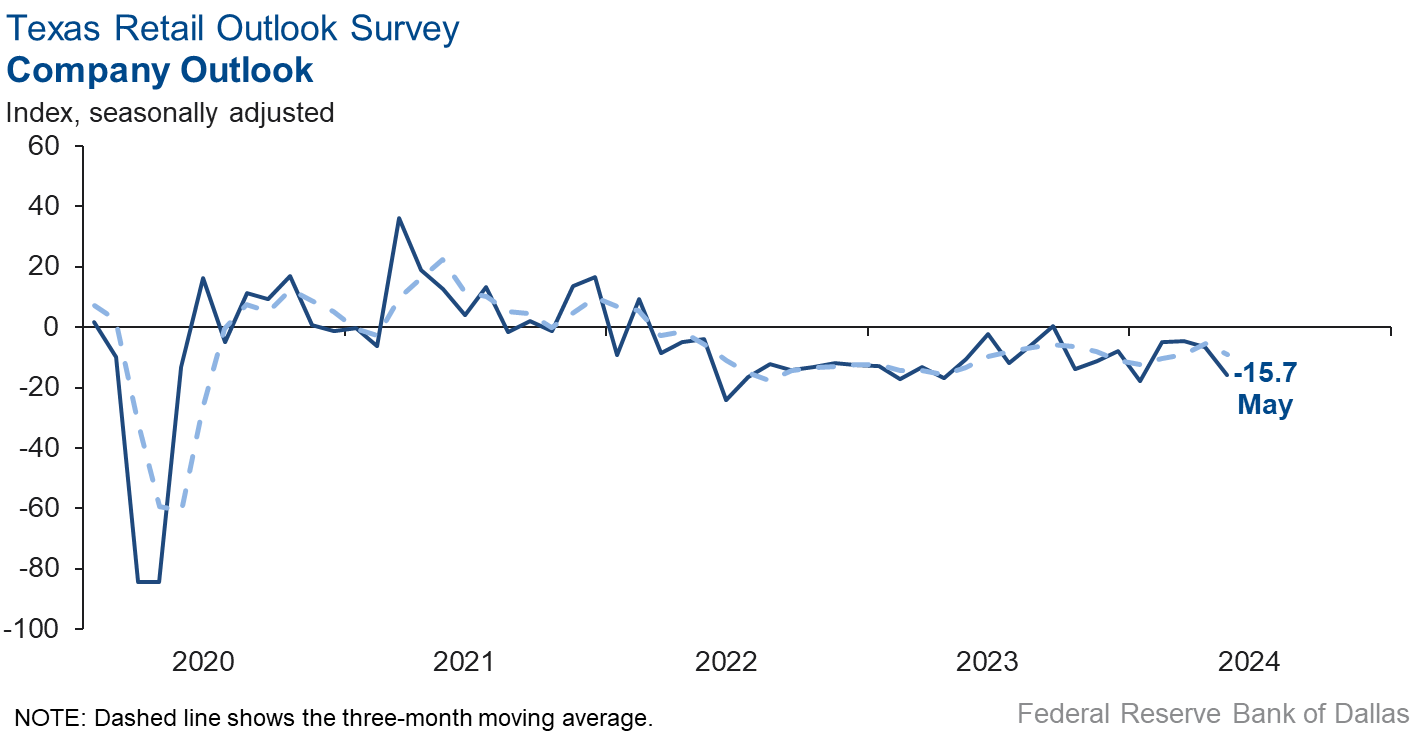
Retailers continued to perceive a worsening of broader business conditions in May. The general business activity index remained in negative territory and fell 11 points to -28.8, the lowest index level since December 2022. The company outlook index also fell from -6.4 to -15.7. The outlook uncertainty index increased six points to 15.1.
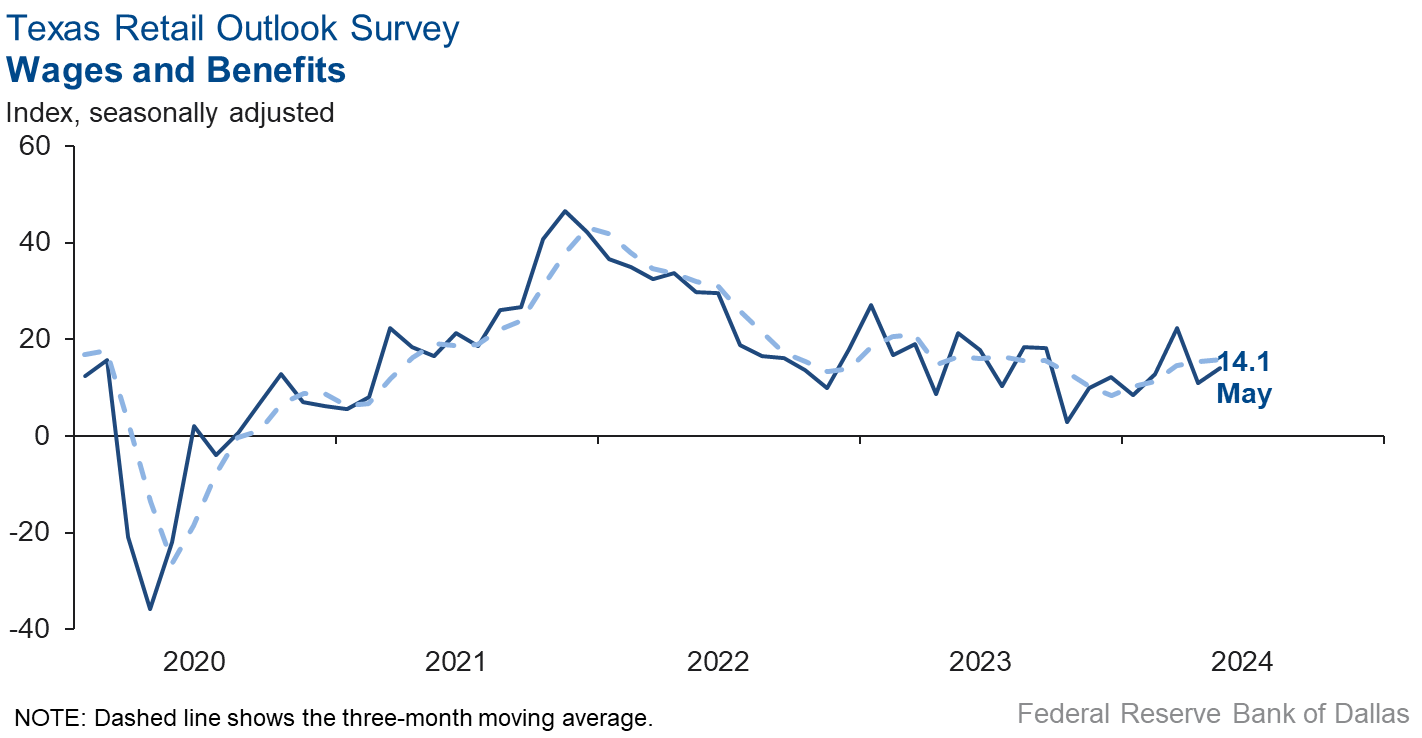
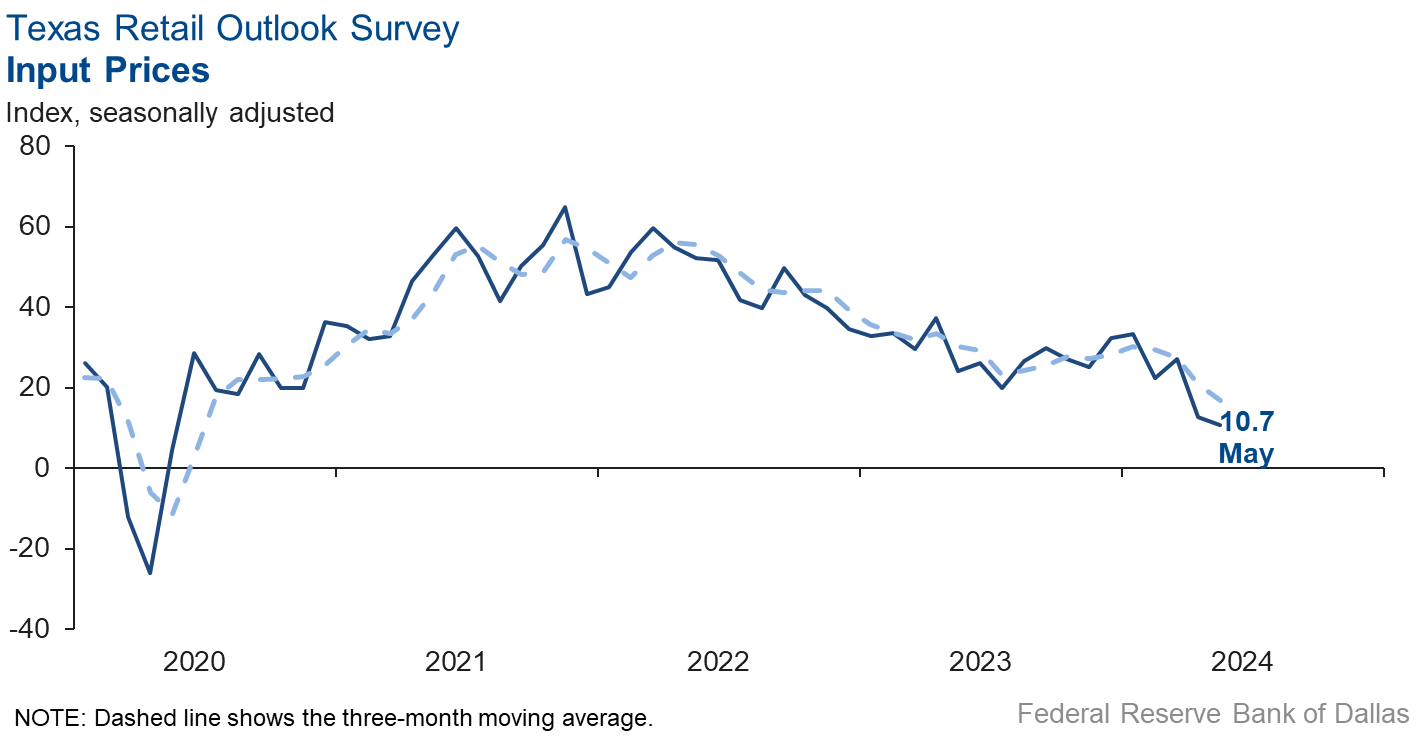
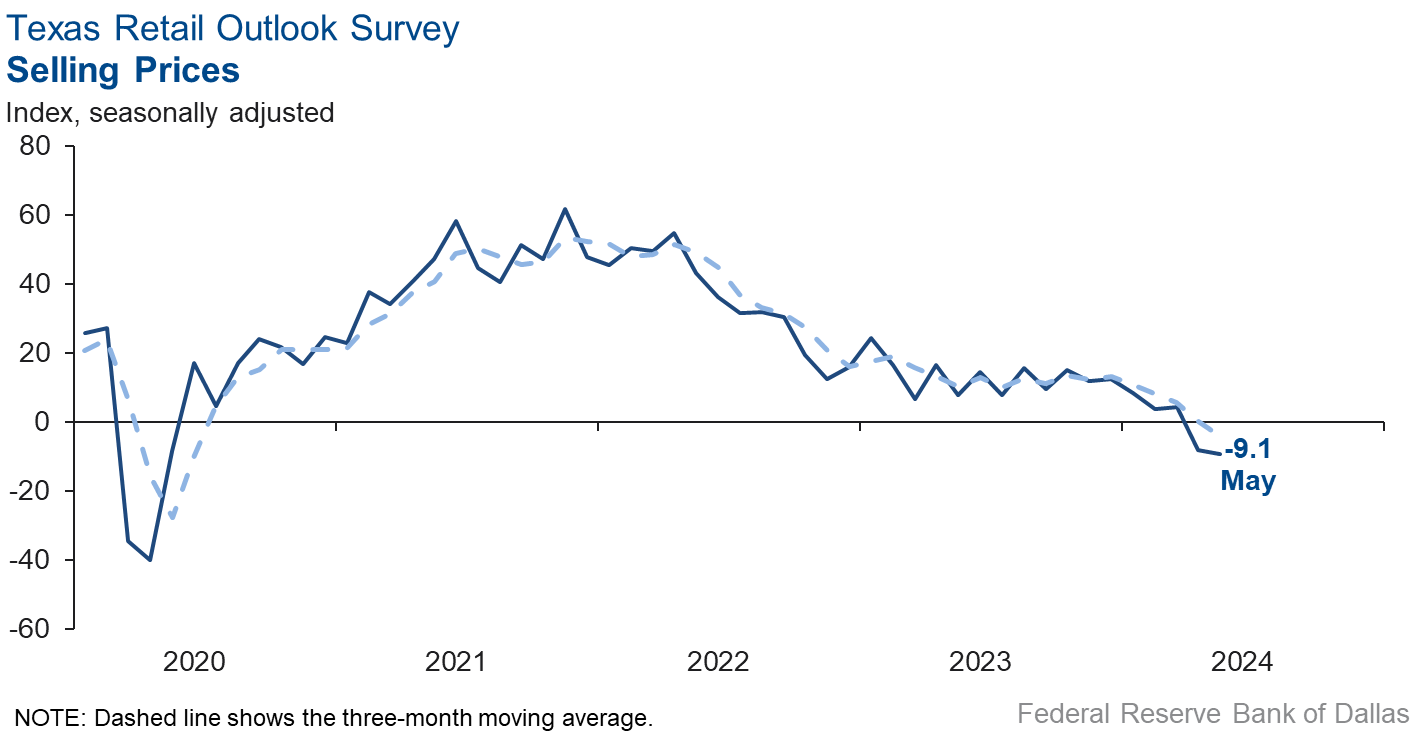
Input price pressure continued easing, while wage pressure increased slightly. Selling price growth fell in May at about the same rate as April. The input price index fell two points to 10.7, while the selling price index was mostly unchanged at -9.1. The wages and benefits index increased three points to 14.1.
Expectations for future business conditions in retail were mixed in May. The future general business activity index went back to negative territory, falling from 11.1 to -1.5. The future sales index fell 12 points but remained in positive territory at 19.6. Other indexes of future retail activity such as employment and capital expenditures fell but remained positive, reflecting expectations for continued retail sales growth in the next six months.
Next release: June 25, 2024
Data were collected May 14–22, and 280 of the 415 Texas service sector business executives surveyed submitted responses. The Dallas Fed conducts the Texas Service Sector Outlook Survey monthly to obtain a timely assessment of the state’s service sector activity. Firms are asked whether revenue, employment, prices, general business activity and other indicators increased, decreased or remained unchanged over the previous month.
This month’s data release also includes revisions to Texas Retail Outlook Survey data for March and April 2024 for the following variables: outlook uncertainty, future input costs, future selling costs, and future companywide internet sales. The revision corrects an internal data error and is not due to changes in survey responses or methodology.
Survey responses are used to calculate an index for each indicator. Each index is calculated by subtracting the percentage of respondents reporting a decrease from the percentage reporting an increase. When the share of firms reporting an increase exceeds the share reporting a decrease, the index will be greater than zero, suggesting the indicator has increased over the prior month. If the share of firms reporting a decrease exceeds the share reporting an increase, the index will be below zero, suggesting the indicator has decreased over the prior month. An index will be zero when the number of firms reporting an increase is equal to the number of firms reporting a decrease.
Data have been seasonally adjusted as necessary.
Texas Service Sector Outlook Survey
Historical data are available from January 2007 to the most current release month.
| Business Indicators Relating to Facilities and Products in Texas Current (versus previous month) | ||||||||
| Indicator | May Index | Apr Index | Change | Series Average | Trend* | % Reporting Increase | % Reporting No Change | % Reporting Decrease |
Revenue | 6.7 | 0.3 | +6.4 | 10.6 | 4(+) | 28.0 | 50.7 | 21.3 |
Employment | 3.9 | –2.6 | +6.5 | 6.3 | 1(+) | 12.6 | 78.7 | 8.7 |
Part–Time Employment | –2.5 | 0.1 | –2.6 | 1.4 | 1(–) | 3.5 | 90.5 | 6.0 |
Hours Worked | –0.4 | –2.1 | +1.7 | 2.6 | 2(–) | 6.4 | 86.8 | 6.8 |
Wages and Benefits | 16.1 | 14.2 | +1.9 | 15.8 | 48(+) | 19.5 | 77.1 | 3.4 |
Input Prices | 20.7 | 28.8 | –8.1 | 28.0 | 49(+) | 27.0 | 66.7 | 6.3 |
Selling Prices | 3.9 | 3.9 | 0.0 | 7.6 | 46(+) | 14.2 | 75.5 | 10.3 |
Capital Expenditures | 3.4 | 5.4 | –2.0 | 9.9 | 46(+) | 10.8 | 81.8 | 7.4 |
| General Business Conditions Current (versus previous month) | ||||||||
| Indicator | May Index | Apr Index | Change | Series Average | Trend** | % Reporting Improved | % Reporting No Change | % Reporting Worsened |
Company Outlook | –5.7 | –1.8 | –3.9 | 4.4 | 3(–) | 11.3 | 71.7 | 17.0 |
General Business Activity | –12.1 | –10.6 | –1.5 | 2.3 | 24(–) | 10.8 | 66.3 | 22.9 |
| Indicator | May Index | Apr Index | Change | Series Average | Trend* | % Reporting Increase | % Reporting No Change | % Reporting Decrease |
Outlook Uncertainty | 12.1 | 13.4 | –1.3 | 13.5 | 36(+) | 23.0 | 66.2 | 10.9 |
| Business Indicators Relating to Facilities and Products in Texas Future (six months ahead) | ||||||||
| Indicator | May Index | Apr Index | Change | Series Average | Trend* | % Reporting Increase | % Reporting No Change | % Reporting Decrease |
Revenue | 31.1 | 33.3 | –2.2 | 37.4 | 49(+) | 45.6 | 39.9 | 14.5 |
Employment | 13.2 | 13.1 | +0.1 | 23.1 | 49(+) | 25.7 | 61.8 | 12.5 |
Part–Time Employment | –0.5 | 3.1 | –3.6 | 6.7 | 1(–) | 8.8 | 81.9 | 9.3 |
Hours Worked | 6.7 | 5.7 | +1.0 | 5.9 | 49(+) | 12.2 | 82.3 | 5.5 |
Wages and Benefits | 33.0 | 35.6 | –2.6 | 37.4 | 49(+) | 36.9 | 59.3 | 3.9 |
Input Prices | 39.9 | 40.2 | –0.3 | 44.6 | 209(+) | 44.7 | 50.5 | 4.8 |
Selling Prices | 16.4 | 26.2 | –9.8 | 24.7 | 49(+) | 26.4 | 63.6 | 10.0 |
Capital Expenditures | 8.7 | 16.3 | –7.6 | 22.9 | 48(+) | 18.9 | 71.0 | 10.2 |
| General Business Conditions Future (six months ahead) | ||||||||
| Indicator | May Index | Apr Index | Change | Series Average | Trend** | % Reporting Improved | % Reporting No Change | % Reporting Worsened |
Company Outlook | 7.6 | 8.0 | –0.4 | 15.4 | 7(+) | 22.6 | 62.4 | 15.0 |
General Business Activity | 1.1 | –1.9 | +3.0 | 11.9 | 1(+) | 20.1 | 60.9 | 19.0 |
Historical data are available from January 2007 to the most current release month.
| Business Indicators Relating to Facilities and Products in Texas Retail (versus previous month) | ||||||||
| Indicator | May Index | Apr Index | Change | Series Average | Trend* | % Reporting Increase | % Reporting No Change | % Reporting Decrease |
| Retail Activity in Texas | ||||||||
Sales | –16.4 | –10.4 | –6.0 | 3.6 | 13(–) | 19.6 | 44.3 | 36.0 |
Employment | –5.2 | –0.5 | –4.7 | 1.8 | 3(–) | 6.6 | 81.6 | 11.8 |
Part–Time Employment | –7.0 | 2.6 | –9.6 | –1.5 | 1(–) | 2.3 | 88.4 | 9.3 |
Hours Worked | –4.2 | –12.8 | +8.6 | –2.1 | 5(–) | 5.1 | 85.6 | 9.3 |
Wages and Benefits | 14.1 | 11.0 | +3.1 | 11.3 | 46(+) | 18.6 | 76.9 | 4.5 |
Input Prices | 10.7 | 12.7 | –2.0 | 22.7 | 49(+) | 30.3 | 50.1 | 19.6 |
Selling Prices | –9.1 | –8.0 | –1.1 | 13.5 | 2(–) | 19.7 | 51.5 | 28.8 |
Capital Expenditures | –2.2 | 1.7 | –3.9 | 7.8 | 1(–) | 11.0 | 75.8 | 13.2 |
Inventories | 2.4 | –3.0 | +5.4 | 2.7 | 1(+) | 21.1 | 60.2 | 18.7 |
| Companywide Retail Activity | ||||||||
Companywide Sales | –17.8 | –11.7 | –6.1 | 4.8 | 2(–) | 16.3 | 49.6 | 34.1 |
Companywide Internet Sales | –0.7 | –3.4 | +2.7 | 4.1 | 2(–) | 14.0 | 71.4 | 14.7 |
| General Business Conditions, Retail Current (versus previous month) | ||||||||
| Indicator | May Index | Apr Index | Change | Series Average | Trend** | % Reporting Improved | % Reporting No Change | % Reporting Worsened |
Company Outlook | –15.7 | –6.4 | –9.3 | 1.8 | 8(–) | 5.9 | 72.5 | 21.6 |
General Business Activity | –28.8 | –18.0 | –10.8 | –2.3 | 11(–) | 5.0 | 61.2 | 33.8 |
| Outlook Uncertainty Current (versus previous month) | ||||||||
| Indicator | May Index | Apr Index | Change | Series Average | Trend* | % Reporting Increase | % Reporting No Change | % Reporting Decrease |
Outlook Uncertainty | 15.1 | 9.3 | +5.8 | 11.2 | 2(+) | 22.6 | 69.8 | 7.5 |
| Business Indicators Relating to Facilities and Products in Texas, Retail Future (six months ahead) | ||||||||
| Indicator | May Index | Apr Index | Change | Series Average | Trend* | % Reporting Increase | % Reporting No Change | % Reporting Decrease |
| Retail Activity in Texas | ||||||||
Sales | 19.6 | 31.4 | –11.8 | 30.6 | 12(+) | 35.1 | 49.3 | 15.5 |
Employment | 6.3 | 9.6 | –3.3 | 12.8 | 17(+) | 15.7 | 74.9 | 9.4 |
Part–Time Employment | 5.3 | 3.2 | +2.1 | 1.6 | 6(+) | 11.3 | 82.7 | 6.0 |
Hours Worked | 3.9 | –0.7 | +4.6 | 2.4 | 1(+) | 10.4 | 83.1 | 6.5 |
Wages and Benefits | 30.6 | 31.7 | –1.1 | 29.1 | 49(+) | 33.9 | 62.8 | 3.3 |
Input Prices | 32.0 | 25.5 | +6.5 | 34.0 | 49(+) | 40.0 | 52.0 | 8.0 |
Selling Prices | 10.0 | 19.6 | –9.6 | 29.0 | 49(+) | 28.0 | 54.0 | 18.0 |
Capital Expenditures | 8.3 | 13.4 | –5.1 | 16.8 | 6(+) | 20.0 | 68.3 | 11.7 |
Inventories | 7.0 | 4.2 | +2.8 | 10.7 | 7(+) | 27.0 | 53.0 | 20.0 |
| Companywide Retail Activity | ||||||||
Companywide Sales | 12.2 | 29.8 | –17.6 | 29.1 | 12(+) | 28.9 | 54.4 | 16.7 |
Companywide Internet Sales | 7.5 | 28.9 | –21.4 | 21.3 | 4(+) | 17.5 | 72.5 | 10.0 |
| General Business Conditions, Retail Future (six months ahead) | ||||||||
| Indicator | May Index | Apr Index | Change | Series Average | Trend** | % Reporting Improved | % Reporting No Change | % Reporting Worsened |
Company Outlook | 6.2 | 15.3 | –9.1 | 15.1 | 4(+) | 21.7 | 62.8 | 15.5 |
General Business Activity | –1.5 | 11.1 | –12.6 | 10.4 | 1(–) | 16.7 | 65.1 | 18.2 |
*Shown is the number of consecutive months of expansion or contraction in the underlying indicator. Expansion is indicated by a positive index reading and denoted by a (+) in the table. Contraction is indicated by a negative index reading and denoted by a (–) in the table.
**Shown is the number of consecutive months of improvement or worsening in the underlying indicator. Improvement is indicated by a positive index reading and denoted by a (+) in the table. Worsening is indicated by a negative index reading and denoted by a (–) in the table.
Data have been seasonally adjusted as necessary.
Texas Service Sector Outlook Survey
Texas Retail Outlook Survey
Texas Service Sector Outlook Survey
Comments from survey respondents
These comments are from respondents’ completed surveys and have been edited for publication.
- Trucking is definitely in recession. Truck freight in both volume and price per mile is way down. Our business won't recover until the industry recovers.
- We are seeing a little slowdown, and inflation doesn't seem to moderate as much as we expected, so we are still seeing increases in input costs and services.
- We see the impact of the high-interest-rate environment starting to impact our customers and customer prospects. Growth is declining, and new business inquiries have waned for key products and services.
- Interest rates and inflation continue to dominate company decisions—our company and our clients and prospects. Costs are high, and budgets are super tight. Therefore, confident decision-making is more challenging for all. Our hiring is on hold while most of our clients continue with layoffs. We believe purchasing decisions will resume after the elections, but a lot depends on the geopolitical climate and unexpected events.
- The rural economy and the regional economies are maintaining a steady pace. Sales tax rebates are down slightly for the month but up year to date. Prices for goods, supplies and services remain elevated, restraining consumer purchases and construction projects.
- There’s continued uncertainty in general economic conditions and with the Federal Reserve's position on interest rates in light of inflation and labor data.
- Investment sales are remaining sticky, with a gap between seller expectations—the combination of buyer requirements and lender underwriting for new loans. On the refinancing side, loans that were 10 years in term can be refinanced if there was appreciable amortization. There are no delinquencies in our servicing portfolio of life insurance company loans.
- Rain has helped, but job growth has slowed.
- As a commercial real estate development company, our ability to raise capital for new projects has been greatly impacted by the current interest rate environment, and the value of existing assets has been significantly impaired. Currently, all levers are in the wrong direction for our underwriting of existing and operating assets and future developments. Rents are softening. Overall capital and financing costs have substantially increased. Materials and labor costs have stabilized but remained high. Operating expenses are up (including insurance, property taxes, property management, etc.), and cap rates have increased (due to interest rate increases). Equity returns have not decreased, unfortunately. Therefore, we are currently very far off from economically being able to make developments work. We have tried very hard to hold on to employees throughout the last two years of challenging times, but we are on the brink of having to make major staffing cuts if we are unable to find some relief from some or all of the above metrics. We have several (eight in total) development pipeline assets, which include fully entitled, fully designed (shovel-ready) multifamily and mixed-use projects that are permitted and ready to go. However, the carry cost is substantial, and the reality is that we will likely have to sell some to all of our pipeline assets at a discount, reduce staff and wait to start over once the economic environment improves and can support new development. Our outlook is that the current economic environment will cause many developers to shut down, and only those who can manage to scale back their businesses will survive to this point. Even though (in Texas) there is a still a large supply-demand deficit for housing, there were many new starts in 2021–22 that are now completing and beginning to lease. Due to the unusual amount of supply coming online all at the same time, lease-up is slower than normal, and even though all the units will get absorbed (i.e., because the demand is still strong), it will be at a slower rate until all of the competing units are leased up. Once that happens, we believe there will be a two-to-three-year period of little to no new project starts, followed by a lack of supply in 2026–28 that will cause rents to spike and likely support the economics of new developments to resume. We hope that during the next two-to-three-year period, when the economics do not work for development, that materials and labor pricing will also fall, further helping the economics for development.
- Interest rates remain a concern for my clients.
- A sharp decrease in labor supply from immigrants would be a disaster for Texas businesses.
- It’s an election year, so we would assume no one is going to allow the economy to go down. However, signs are mounting. After four months, we are flat compared to last year.
- We have seen an increase in sales prospects, primarily through increased investment in marketing.
- It seems the job market is under less pressure. We're seeing a slight increase in the quantity and quality of candidates applying for jobs. We're expecting a short downturn in business as we get close to the election. But hopefully that won't last long. We're excited about having some new people. They are much needed and will take some stress off the system.
- This is the worst we've seen in the real estate market since the Great Recession.
- Most investors are sitting on the sidelines until after the election or interest rates decrease.
- Availability of financing for growth remains a concern. We expect there will be no change in rates until the fall. We are reworking several loans as well to help free up cash for the upcoming end of the federal contract award season.
- We are getting the business, actually more of it than we can handle, but finding the right consultant with the appropriate experience and expertise has been the issue.
- Our sales have been on the rise, and we’re thrilled that more organizations, both nonprofit and for-profit, are turning to us for their hiring needs. We recently introduced a new offering to work as an outsourced recruiting partner for teams needing extra support. This model has been popular because it saves companies money compared to the traditional per-position payment method. As long as unemployment remains fairly low and companies have a hard time finding really good talent, we will do well.
- We have been in a rolling 15-month recession that is starting to brighten up slightly. Our real estate orders have continued to decrease this year, and that is an indicator that the market is pulling back due to the unknown of where interest rates are headed. There is still a lot of money on the sidelines waiting to be deployed, but until the market can determine where the economy is headed, it will stay there.
- The pipeline for sales and upcoming transactions is low.
- We are fairly certain that we will be closing our doors and releasing as many as 60 employees in the next few months.
- Election-year unknowns are creating instability and disruption in our primary markets.
- Interest rates and higher input costs seem to be the key drivers currently.
- We shifted our real estate appraisal and consulting business strategy from lender-based clients due to a 50 percent decline in revenue in 2023 due to the adverse impact of higher interest rates on lending. Now we are focused on public sector valuation projects such as airport lands, roadway extensions, etc. Also, we shifted our marketing focus to private sector expert witness consulting. Both strategies are increasing revenue and the bottom line.
- The business environment feels quite unstable currently. Service prices for support vendors and supplies continue to increase, while our ability to negotiate higher reimbursement rates from insurance companies continues to stall. Our urgent-care volume also continues to be softer than expected going back to March, which includes an earlier departure of seasonal flu and a reduction of overall COVID-19 testing.
- It is difficult to determine where our business is headed. The month of May is softer, but it may be an isolated issue to us. We have significant construction in our area, which may be impacting our business levels. However, our information indicates that downtown in general is performing below last year.
- We are steadily getting busier as business travel is increasing, though not as fast as we would like. The cost of doing business is still on the rise, and we have increased our pricing to match the cost, and we see that this will happen again within the next six months as well. We have had to increase wages moving forward to keep good personnel on staff.
- Our cost of goods is stable; however, wages continue to have upward pressures because employees are struggling to keep up with rising rents, rising groceries and rising interest rates.
- Higher prices are frustrating our guests. Customer counts are down for that reason and because of the shift of office workers to their home offices. This has caused our lunches to soften and our happy hours to almost disappear. The discussion of eliminating tipping is worrying us. With prices already impacting guests' wallets and psyche, it will really hurt if we eliminate tipping and raise prices even more.
- Our struggle with back-to-office and business travel continues. The cost of goods sold continues to increase, albeit at a slightly slower pace. Labor cost might be improving, but it’s too soon to know.
- The availability of long-term contracts and projects seems to be reducing as we move through 2024. Six months ago, we had many requests for quotes for large projects, which offered security for our growth. Currently, we are only seeing bids for small projects or single-service events.
- We have added some new business, so our company outlook has improved. However, the food-service market continues to be ambiguous. Industry discussions center on consumer spending. People like to eat out, and they are willing to eat out, but at a lower pace (fewer visits per month). Our customer sales volumes are unchanged, but I believe it's because of higher sales prices (adjusted for inflated protein costs), not more meals served. That said, the industry believes frequency will increase as people make budget decisions to sacrifice in other areas.
- Business just continues to remain very volatile, and it's not just related to issues with the weather. We'll have one day when it's dead, and then the next day we can barely keep up. There are storms on the horizon. Margins are under attack. Used-vehicle departments are experiencing major challenges and significant declines in selling gross. New-vehicle inventories are too high, and the cost to carry is excessive, resulting in a negative impact to overall profitability.
- We continue to be concerned about interest rates.
- The major concern is the low margin on sales of new vehicles. We are becoming concerned about the ability to arrange financing for our customers on purchases of both new and used vehicles.
- Vehicle demand continues to be strong at retail.
- Inflation is getting pretty scary. We can't make enough interest on our deposits to cover inflation. We are worried about how to keep increasing pay to our employees to offset inflation.
Historical Data
Historical data can be downloaded dating back to January 2007.
Indexes
Download indexes for all indicators. For the definitions of all variables, see data definitions.
Texas Service Sector Outlook Survey |
Texas Retail Outlook Survey |
| Unadjusted | Unadjusted |
| Seasonally adjusted | Seasonally adjusted |
All Data
Download indexes and components of the indexes (percentage of respondents reporting increase, decrease, or no change). For the definitions of all variables, see data definitions.
Texas Service Sector Outlook Survey |
Texas Retail Outlook Survey |
| Unadjusted | Unadjusted |
| Seasonally adjusted | Seasonally adjusted |
Questions regarding the Texas Service Sector Outlook Survey can be addressed to Jesus Cañas at jesus.canas@dal.frb.org.
Sign up for our email alert to be automatically notified as soon as the latest Texas Service Sector Outlook Survey is released on the web.