
Texas Service Sector Outlook Survey
Growth in Texas service sector activity continues
For this month’s survey, Texas business executives were asked supplemental questions on wages, prices, outlook concerns, employment and potentially higher tariffs in 2025. Results for these questions from the Texas Manufacturing Outlook Survey, Texas Service Sector Outlook Survey and Texas Retail Outlook Survey have been released together. Read the special questions results.
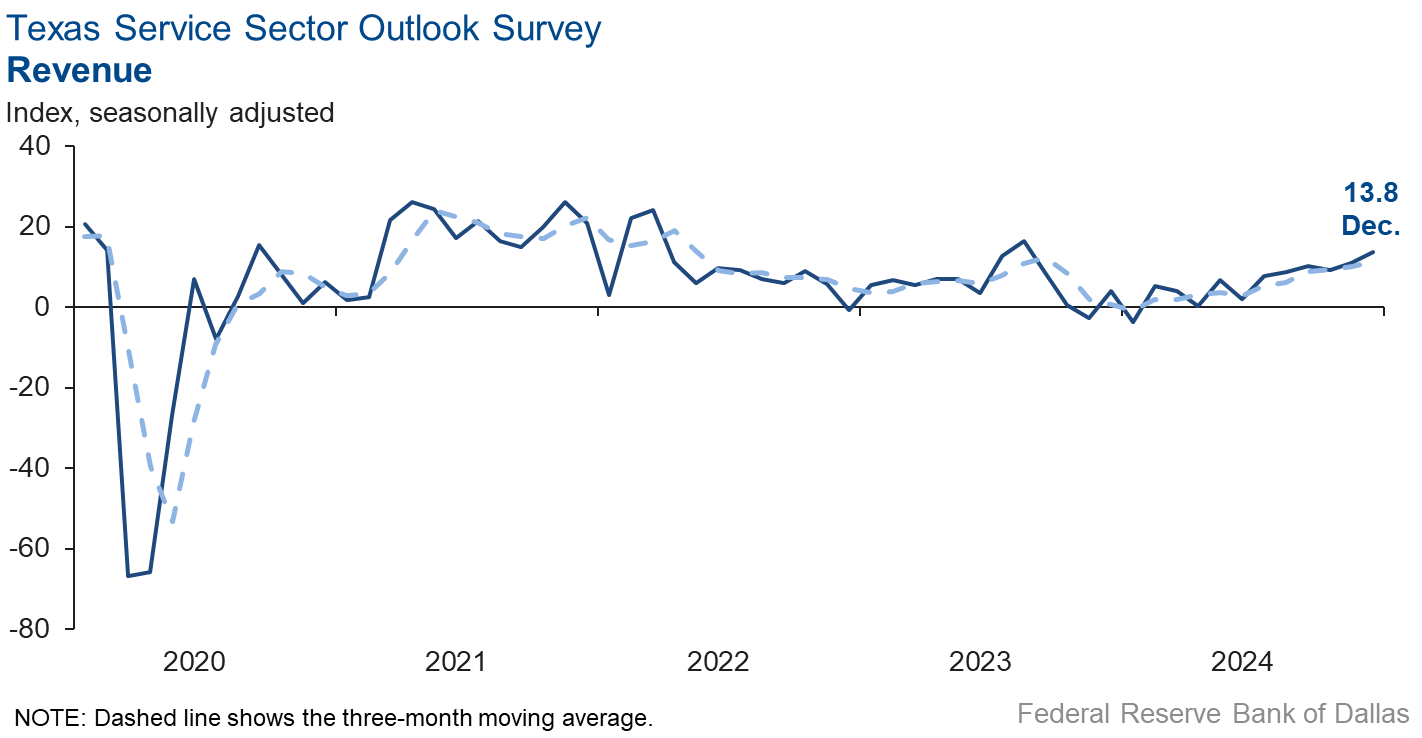
Texas service sector activity expanded at a faster pace in December than the prior month, according to business executives responding to the Texas Service Sector Outlook Survey. The revenue index, a key measure of state service sector conditions, increased to 13.8.
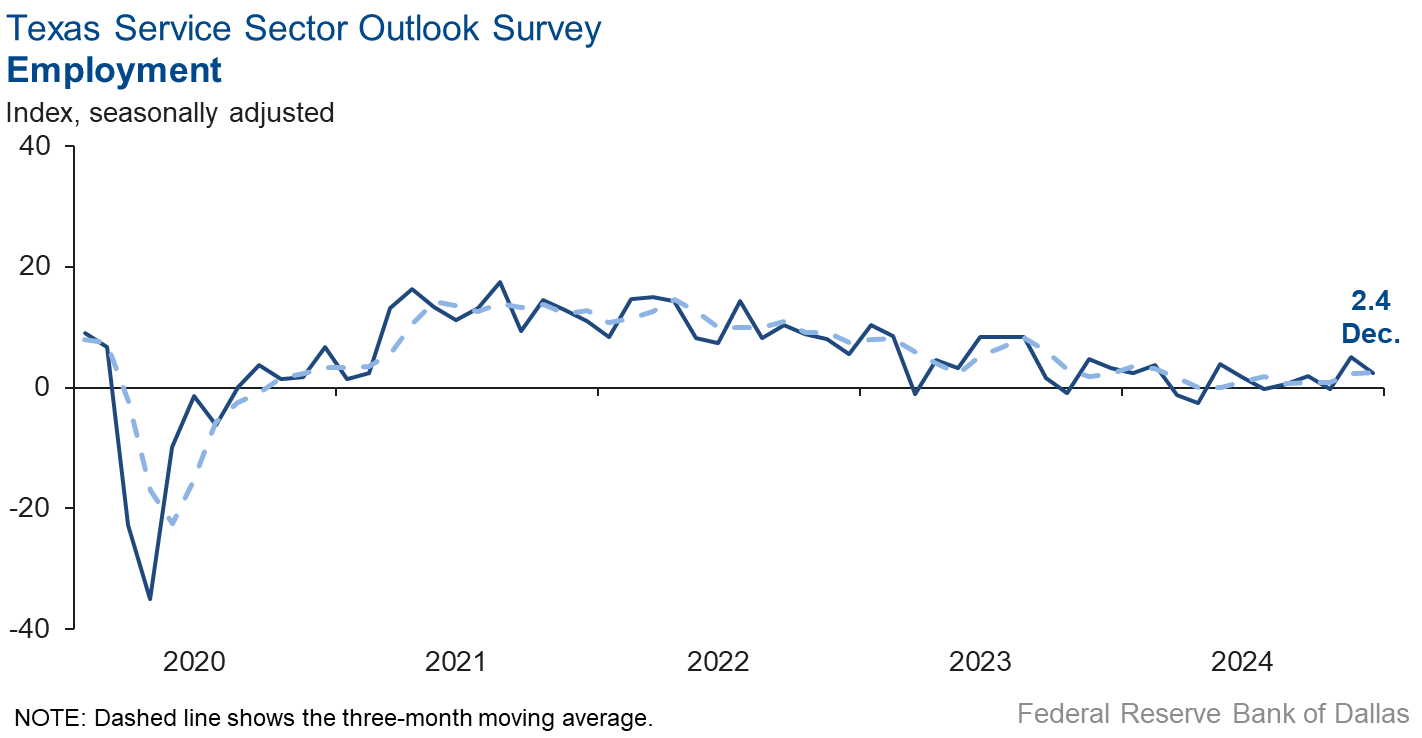
Labor market measures suggested a slight slowing in employment growth and little change in workweeks in December. The employment index fell to 2.4 and the part-time employment index decreased three points to -0.3. The hours-worked index dropped to -1.2.
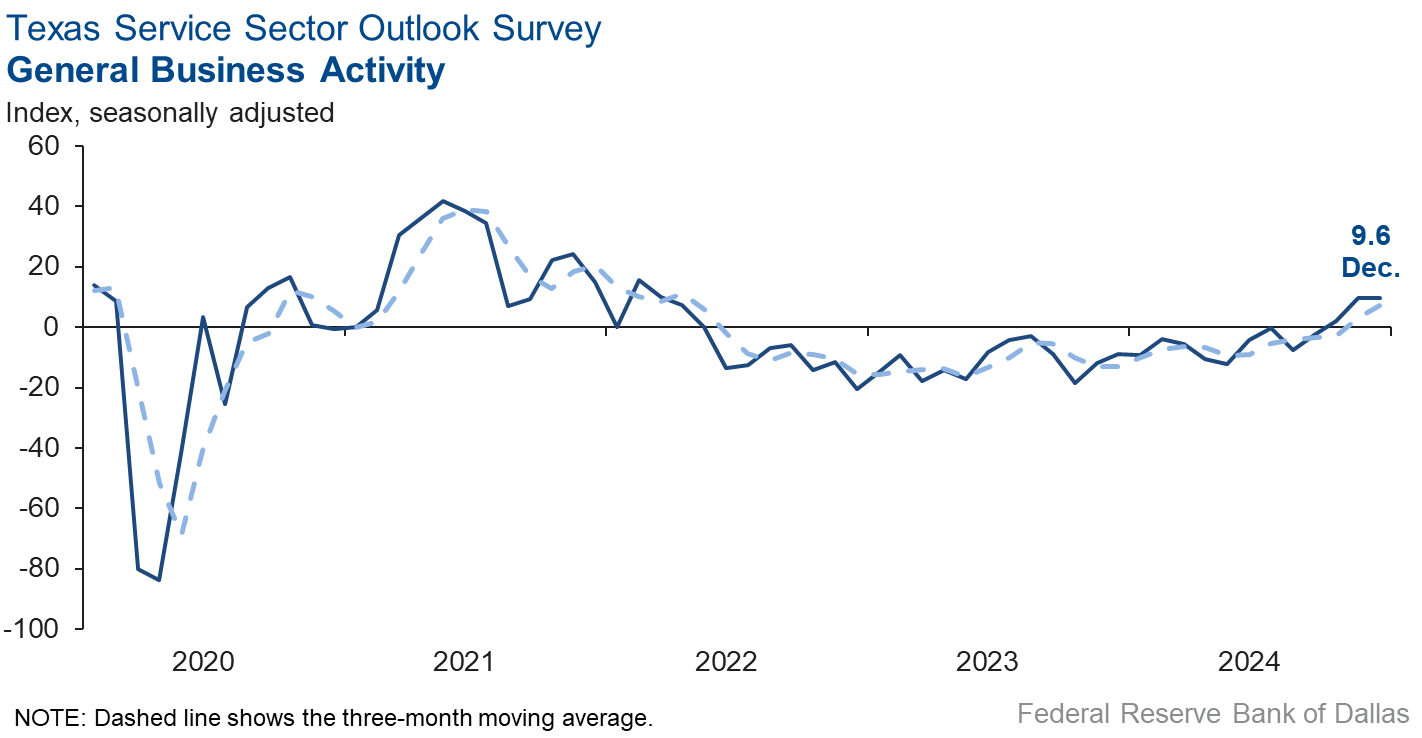
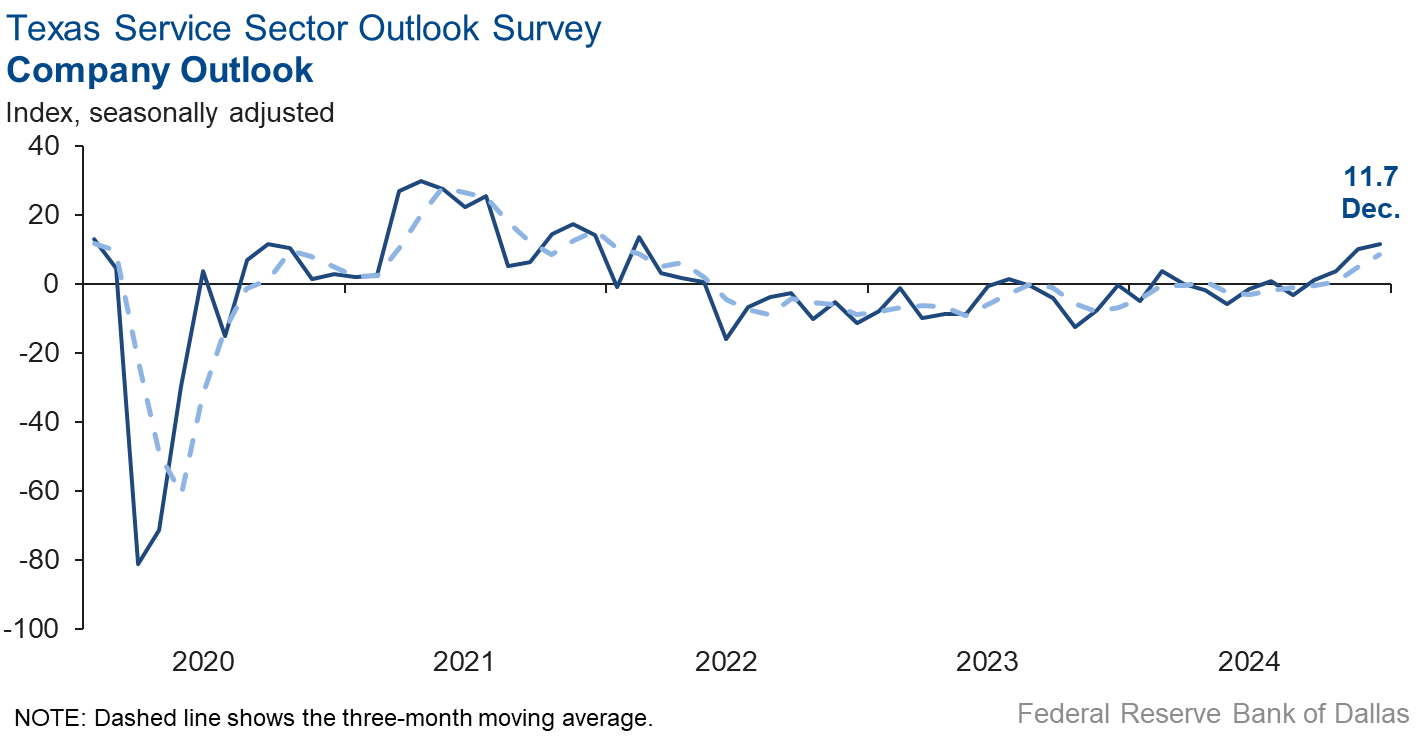
Perceptions of broader business conditions improved in December. The general business activity index was practically unchanged at 9.6, while the company outlook index edged up to 11.7. The outlook uncertainty index fell to zero.
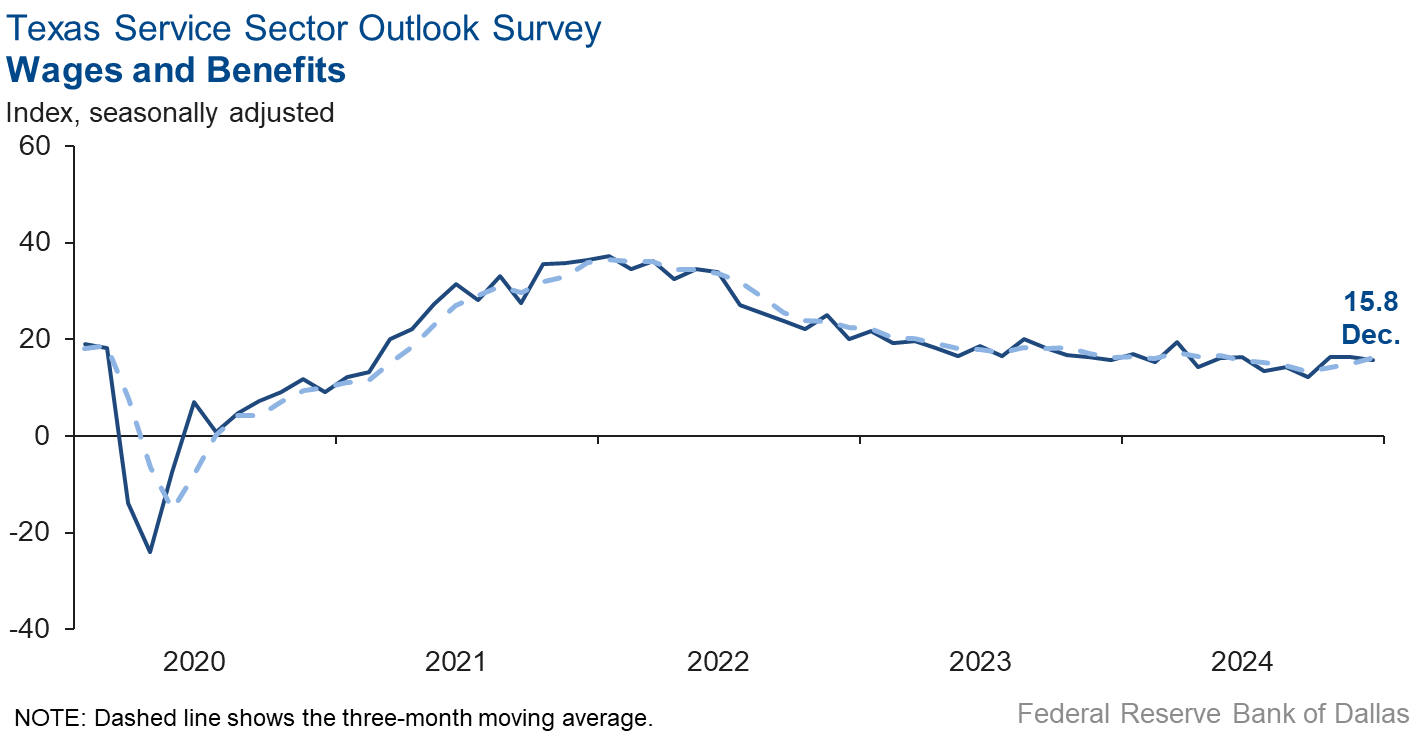
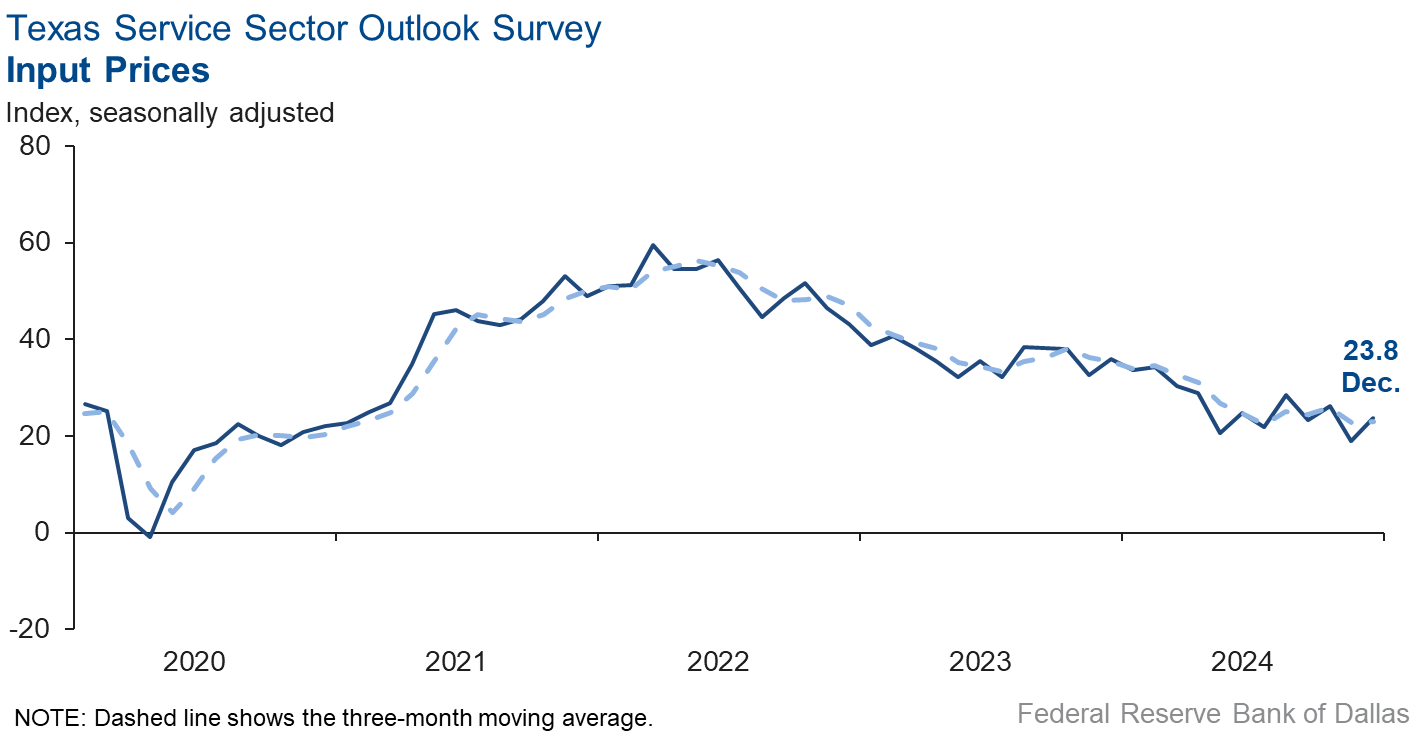
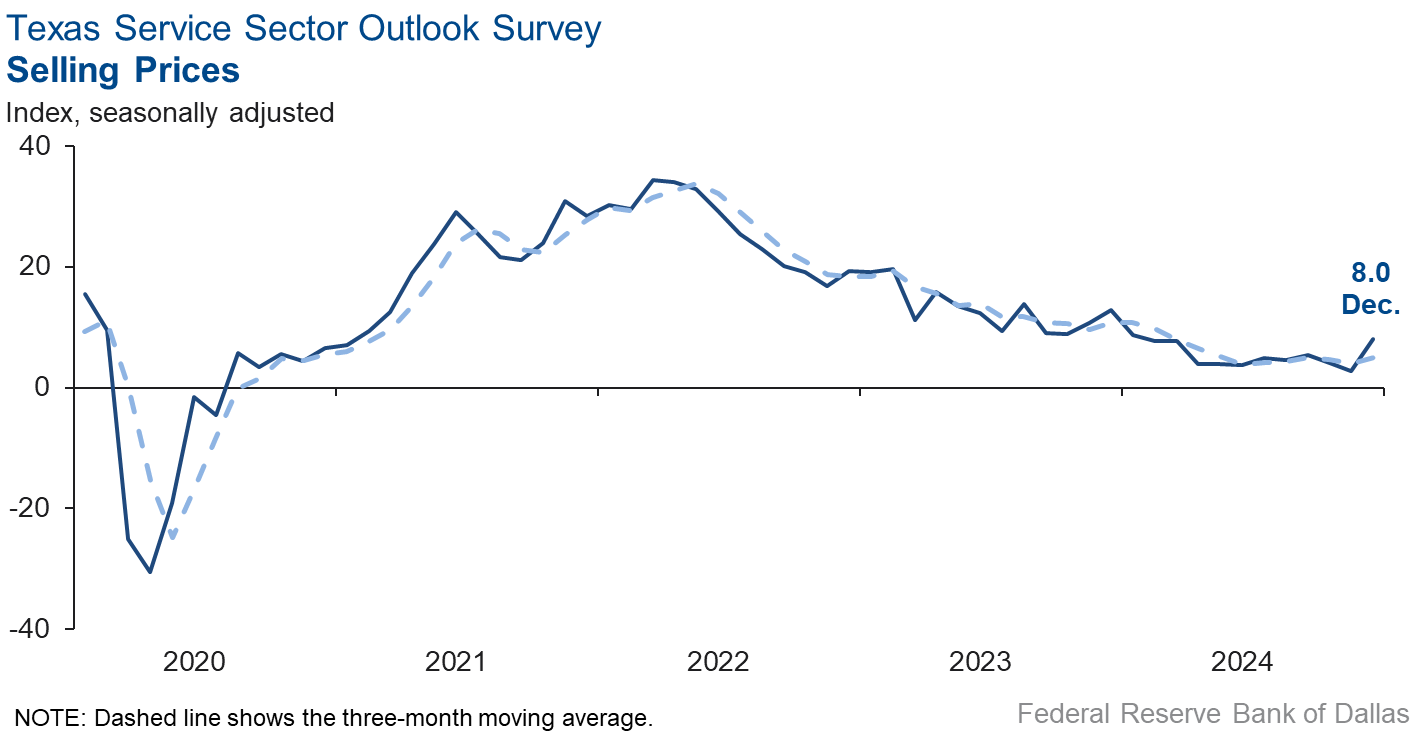
Price pressures increased while wage pressures held steady in December. Both the selling prices index and the input prices index increased five points to 8.0 and 23.8, respectively. The wages and benefits index was little changed at 15.8.
Respondents’ expectations regarding future business activity continued to reflect optimism in December. The future general business activity index held steady at 29.5, while the future revenue index increased five points to 48.5. Other future service sector activity indexes such as employment and capital expenditures remained in positive territory, reflecting expectations for sustained growth in the next six months.

Texas Retail Outlook Survey
Texas retail sales growth strengthens in December
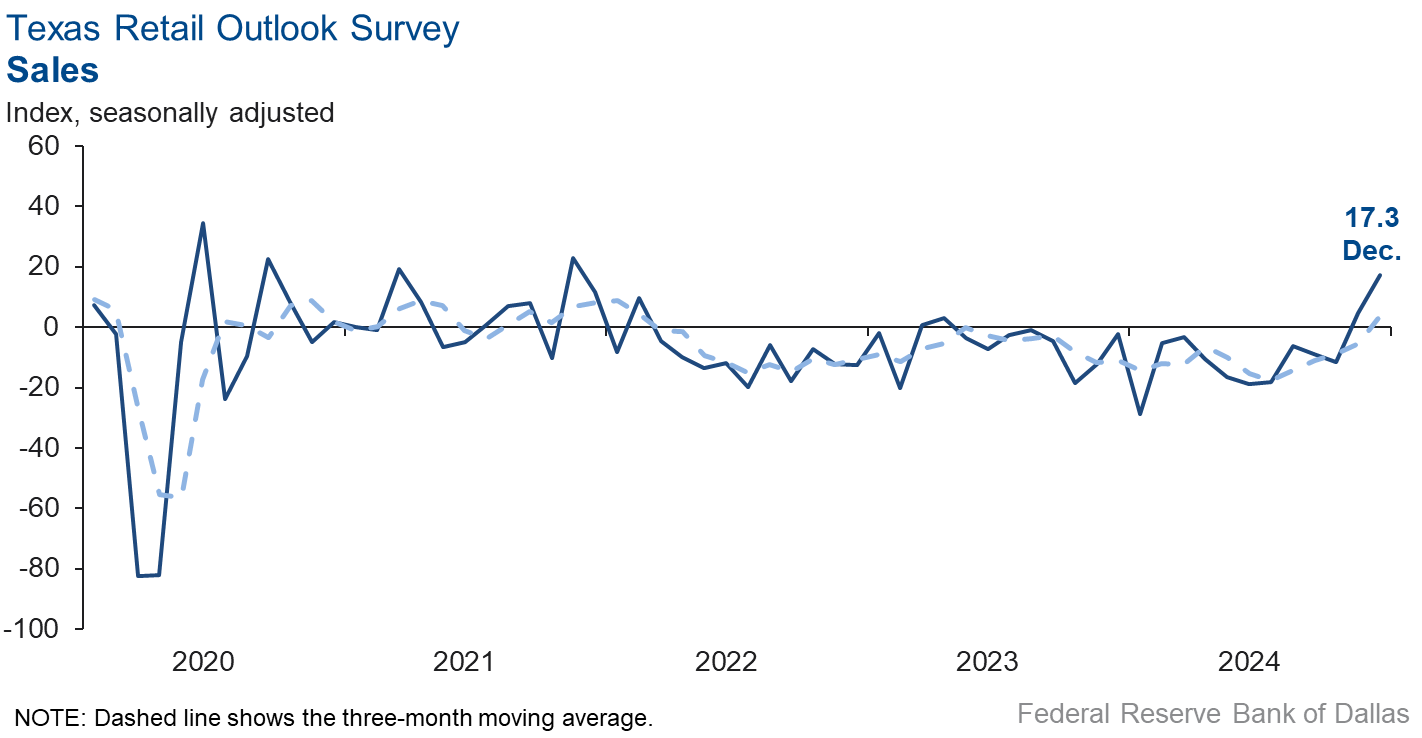
Retail sales activity accelerated in December, according to business executives responding to the Texas Retail Outlook Survey. The sales index, a key measure of state retail activity, increased 13 points to 17.3, its highest level since late 2021. Retailers’ inventories were unchanged over the month, with the December index at 1.0.
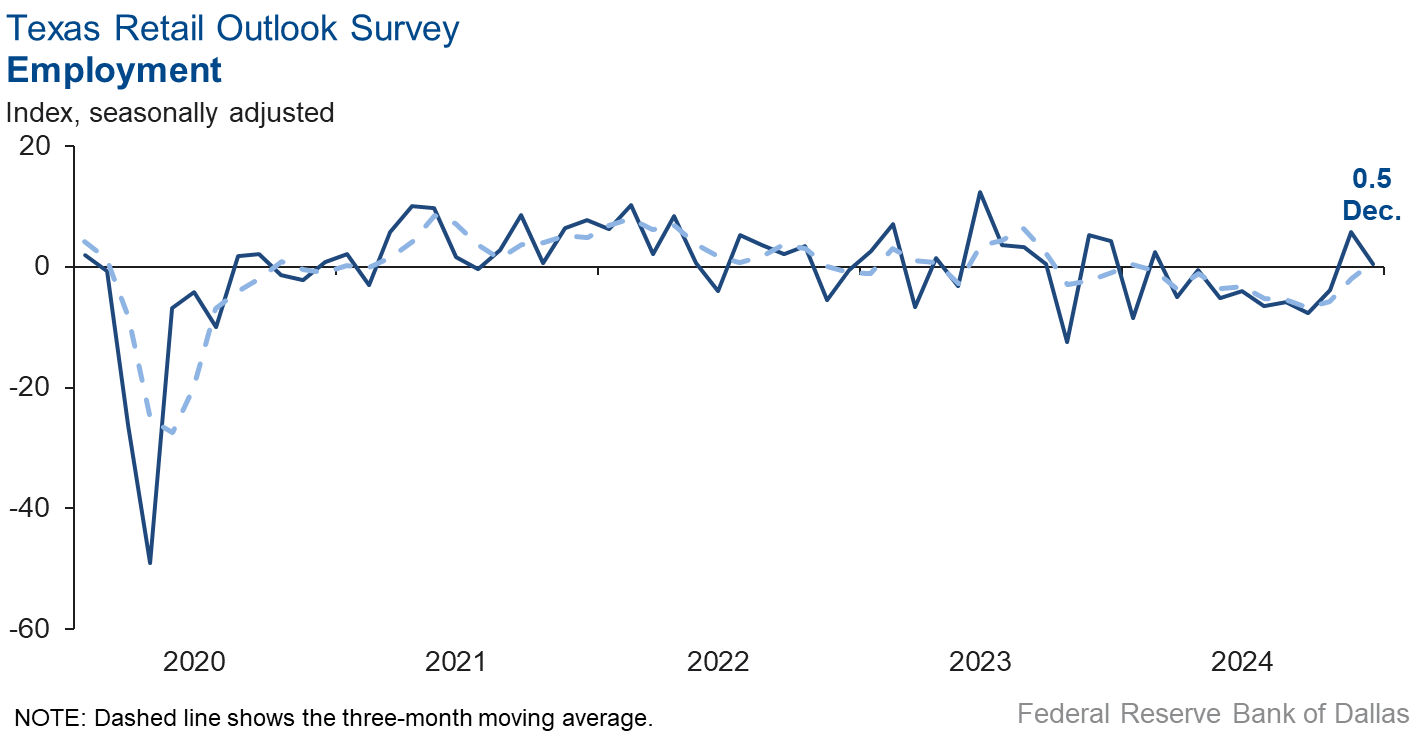
Retail labor market indicators suggested flat employment and slightly shorter workweeks this month. The employment index fell five points to 0.5, with the near-zero reading signaling no change in employment levels. The part-time employment index rose to 4.2, and the hours worked index fell 12 points to -1.7.
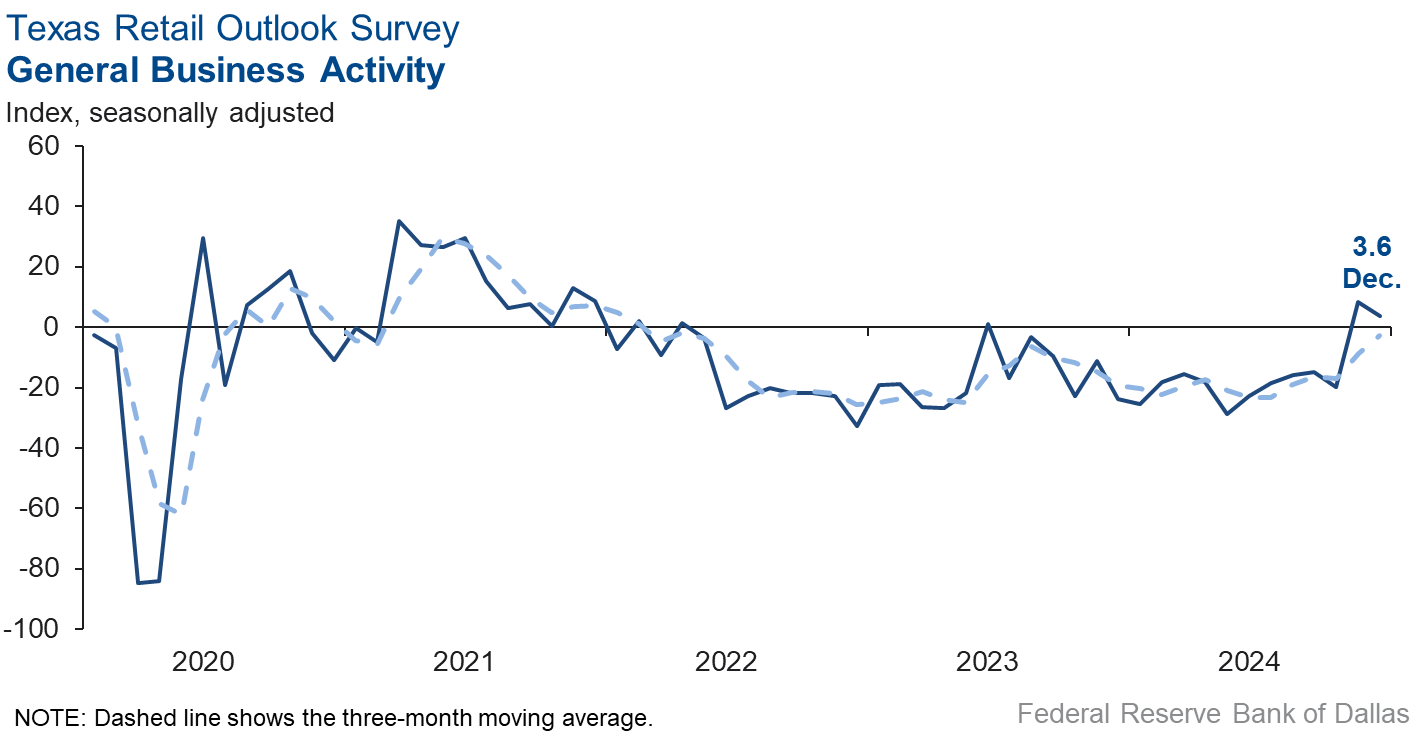
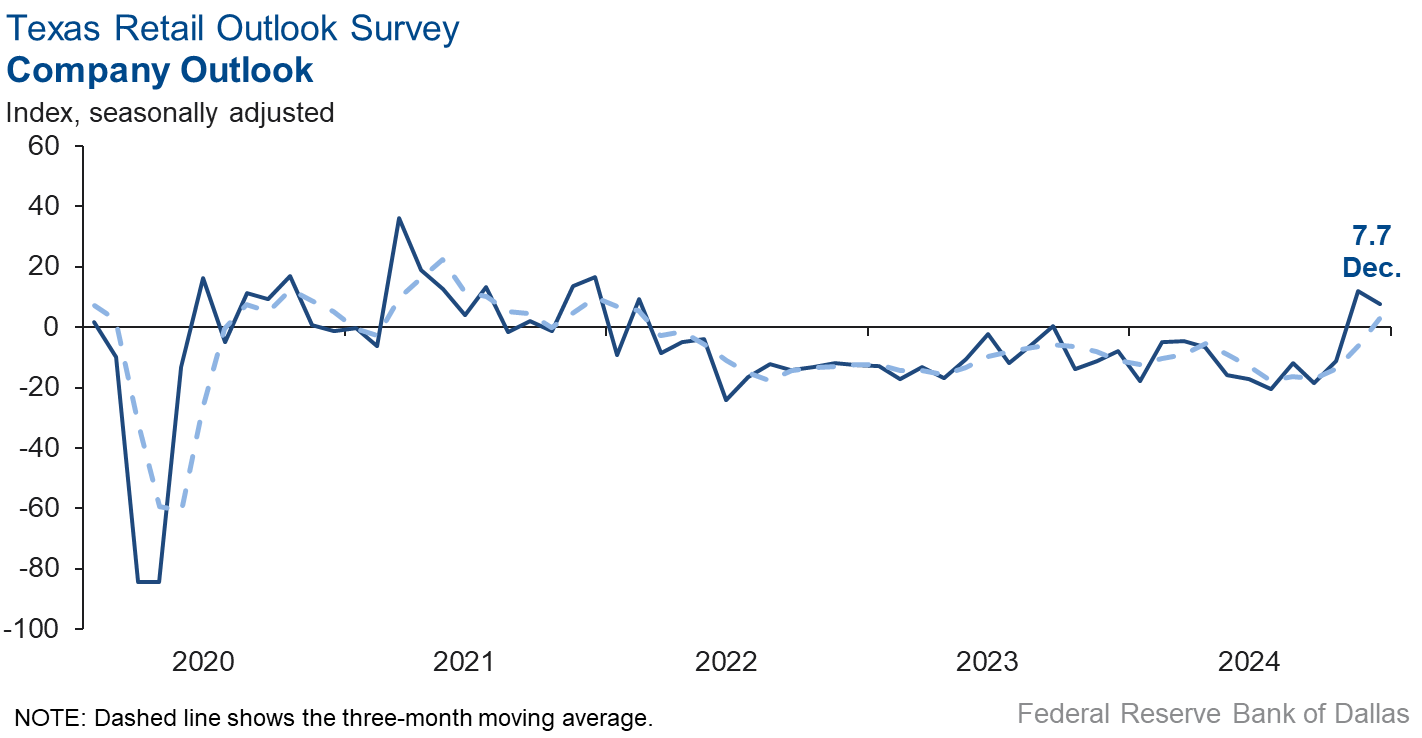
Perceptions of broader business conditions improved, but optimism waned slightly in December. The general business activity index fell five points to 3.6. The company outlook index dipped four points to 7.7. Uncertainty in outlooks fell.
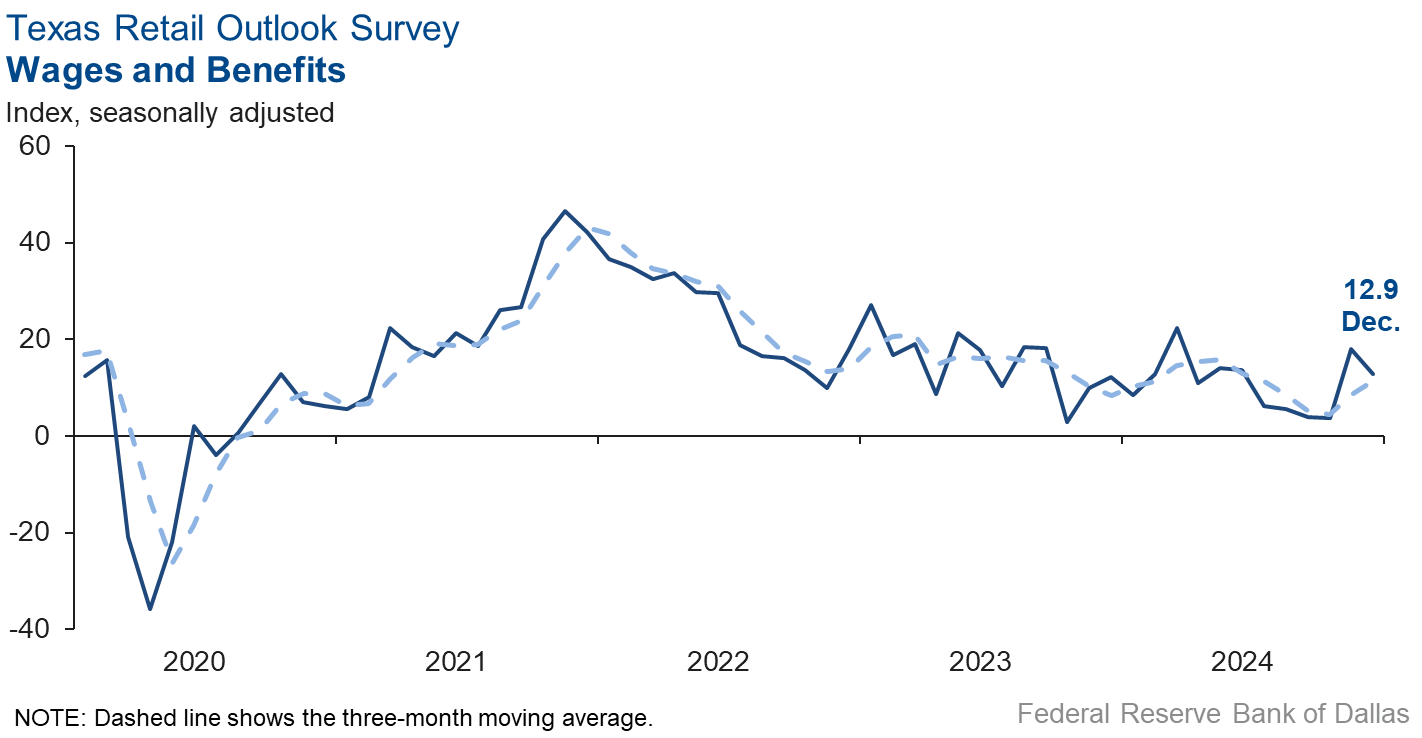
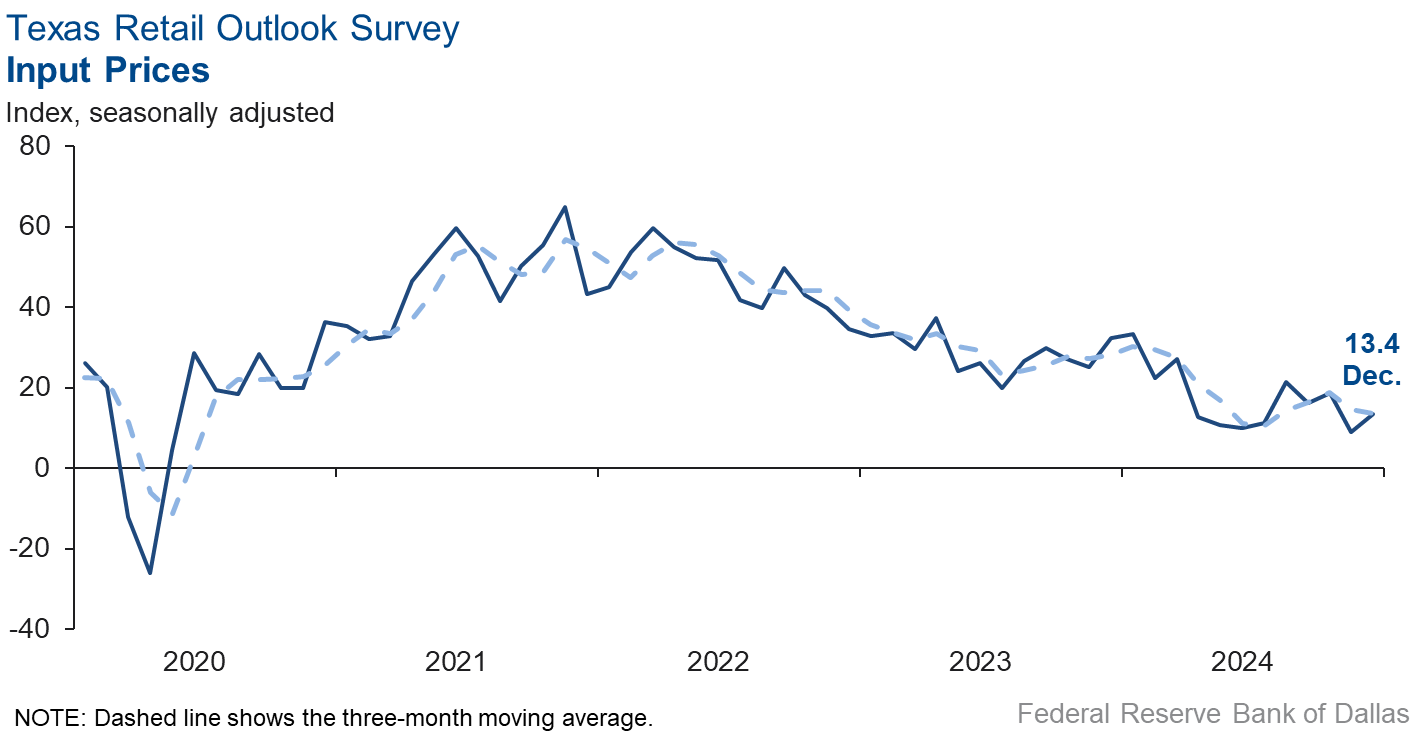
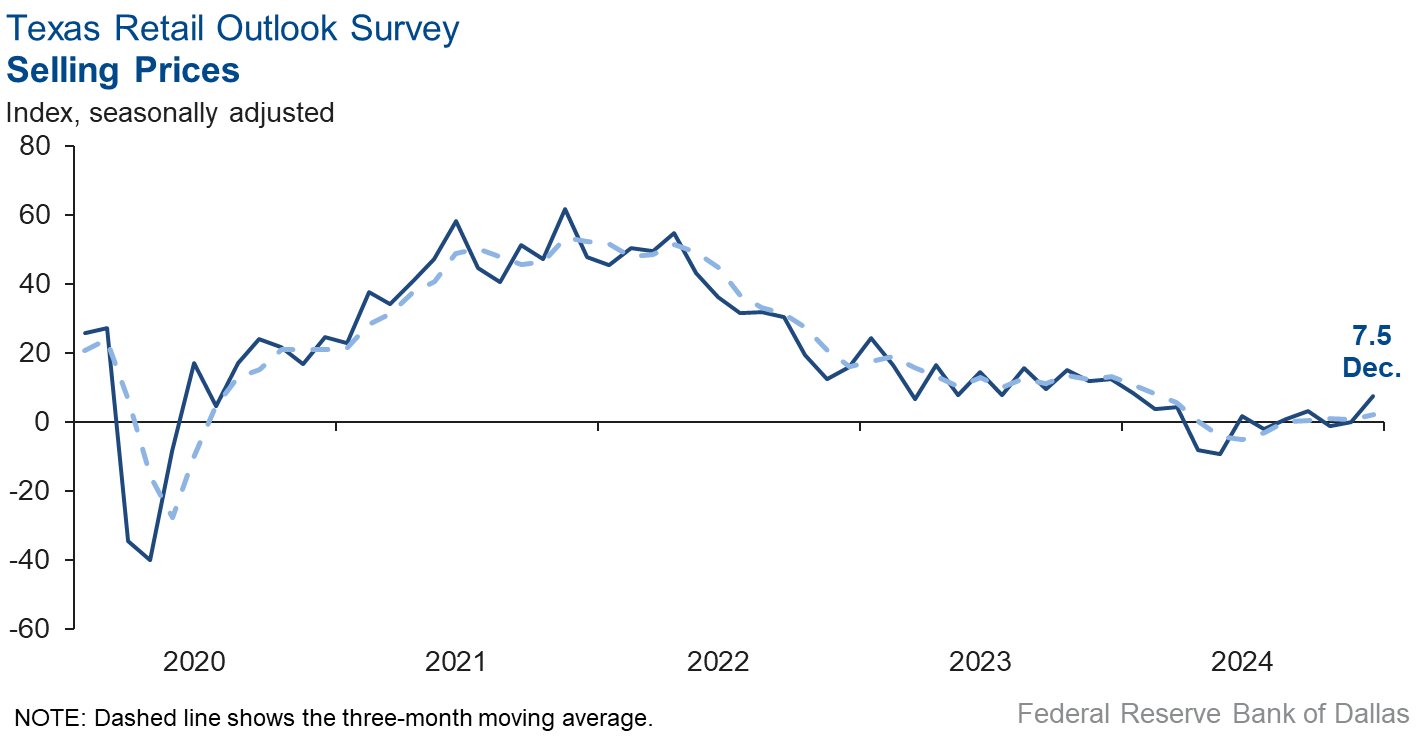
Upward pressure on selling prices and input prices increased while wage growth eased slightly in December. The selling price index rose seven points to 7.5. The input price index increased four points to 13.4. The wages and benefits index fell to 12.9 from 18.0.
Expectations for future business conditions in retail improved in December. The future general business activity index remained positive but fell five points to 23.7, while the future sales index increased seven points to 32.0. Both the future employment index and the future capital expenditures index remained in positive territory, suggesting further improvement in retail activity in the next six months.
Next release: January 28, 2025
Data were collected December 17–25, and 271 of the 379 Texas service sector business executives surveyed submitted responses. The Dallas Fed conducts the Texas Service Sector Outlook Survey monthly to obtain a timely assessment of the state’s service sector activity. Firms are asked whether revenue, employment, prices, general business activity and other indicators increased, decreased or remained unchanged over the previous month.
Survey responses are used to calculate an index for each indicator. Each index is calculated by subtracting the percentage of respondents reporting a decrease from the percentage reporting an increase. When the share of firms reporting an increase exceeds the share reporting a decrease, the index will be greater than zero, suggesting the indicator has increased over the prior month. If the share of firms reporting a decrease exceeds the share reporting an increase, the index will be below zero, suggesting the indicator has decreased over the prior month. An index will be zero when the number of firms reporting an increase is equal to the number of firms reporting a decrease.
Data have been seasonally adjusted as necessary.
Texas Service Sector Outlook Survey
Historical data are available from January 2007 to the most current release month.
| Business Indicators Relating to Facilities and Products in Texas Current (versus previous month) | ||||||||
| Indicator | Dec Index | Nov Index | Change | Series Average | Trend* | % Reporting Increase | % Reporting No Change | % Reporting Decrease |
Revenue | 13.8 | 10.9 | +2.9 | 10.6 | 11(+) | 31.7 | 50.4 | 17.9 |
Employment | 2.4 | 5.1 | –2.7 | 6.2 | 2(+) | 13.3 | 75.8 | 10.9 |
Part–Time Employment | –0.3 | 2.5 | –2.8 | 1.3 | 1(–) | 4.6 | 90.5 | 4.9 |
Hours Worked | –1.2 | 4.8 | –6.0 | 2.6 | 1(–) | 5.1 | 88.6 | 6.3 |
Wages and Benefits | 15.8 | 16.4 | –0.6 | 15.8 | 55(+) | 18.3 | 79.2 | 2.5 |
Input Prices | 23.8 | 19.0 | +4.8 | 27.9 | 56(+) | 28.0 | 67.8 | 4.2 |
Selling Prices | 8.0 | 2.8 | +5.2 | 7.5 | 53(+) | 15.5 | 77.0 | 7.5 |
Capital Expenditures | 8.6 | 10.3 | –1.7 | 9.9 | 53(+) | 14.7 | 79.2 | 6.1 |
| General Business Conditions Current (versus previous month) | ||||||||
| Indicator | Dec Index | Nov Index | Change | Series Average | Trend** | % Reporting Improved | % Reporting No Change | % Reporting Worsened |
Company Outlook | 11.7 | 10.1 | +1.6 | 4.3 | 4(+) | 21.7 | 68.3 | 10.0 |
General Business Activity | 9.6 | 9.8 | –0.2 | 2.3 | 3(+) | 19.7 | 70.2 | 10.1 |
| Indicator | Dec Index | Nov Index | Change | Series Average | Trend* | % Reporting Increase | % Reporting No Change | % Reporting Decrease |
Outlook Uncertainty | 0.1 | 1.8 | –1.7 | 13.1 | 43(+) | 17.5 | 65.1 | 17.4 |
| Business Indicators Relating to Facilities and Products in Texas Future (six months ahead) | ||||||||
| Indicator | Dec Index | Nov Index | Change | Series Average | Trend* | % Reporting Increase | % Reporting No Change | % Reporting Decrease |
Revenue | 48.5 | 44.0 | +4.5 | 37.4 | 56(+) | 57.3 | 33.9 | 8.8 |
Employment | 29.5 | 28.1 | +1.4 | 23.0 | 56(+) | 35.3 | 58.9 | 5.8 |
Part–Time Employment | 11.7 | 6.5 | +5.2 | 6.6 | 7(+) | 14.5 | 82.7 | 2.8 |
Hours Worked | 7.2 | 10.0 | –2.8 | 5.9 | 56(+) | 10.8 | 85.6 | 3.6 |
Wages and Benefits | 42.3 | 39.8 | +2.5 | 37.4 | 56(+) | 43.1 | 56.1 | 0.8 |
Input Prices | 41.8 | 36.9 | +4.9 | 44.3 | 216(+) | 47.3 | 47.1 | 5.5 |
Selling Prices | 29.0 | 25.4 | +3.6 | 24.5 | 56(+) | 36.6 | 55.8 | 7.6 |
Capital Expenditures | 23.8 | 24.1 | –0.3 | 22.8 | 55(+) | 30.1 | 63.6 | 6.3 |
| General Business Conditions Future (six months ahead) | ||||||||
| Indicator | Dec Index | Nov Index | Change | Series Average | Trend** | % Reporting Improved | % Reporting No Change | % Reporting Worsened |
Company Outlook | 31.2 | 30.1 | +1.1 | 15.6 | 14(+) | 39.2 | 52.8 | 8.0 |
General Business Activity | 29.5 | 29.8 | –0.3 | 12.1 | 8(+) | 39.4 | 50.7 | 9.9 |
Historical data are available from January 2007 to the most current release month.
| Business Indicators Relating to Facilities and Products in Texas Retail (versus previous month) | ||||||||
| Indicator | Dec Index | Nov Index | Change | Series Average | Trend* | % Reporting Increase | % Reporting No Change | % Reporting Decrease |
| Retail Activity in Texas | ||||||||
Sales | 17.3 | 4.6 | +12.7 | 3.3 | 2(+) | 36.2 | 44.9 | 18.9 |
Employment | 0.5 | 5.7 | –5.2 | 1.6 | 2(+) | 8.9 | 82.7 | 8.4 |
Part–Time Employment | 4.2 | 1.0 | +3.2 | –1.6 | 2(+) | 8.2 | 87.8 | 4.0 |
Hours Worked | –1.7 | 9.9 | –11.6 | –2.2 | 1(–) | 5.2 | 87.9 | 6.9 |
Wages and Benefits | 12.9 | 18.0 | –5.1 | 11.2 | 53(+) | 14.8 | 83.3 | 1.9 |
Input Prices | 13.4 | 9.0 | +4.4 | 22.4 | 56(+) | 25.2 | 63.0 | 11.8 |
Selling Prices | 7.5 | 0.1 | +7.4 | 13.1 | 2(+) | 18.9 | 69.7 | 11.4 |
Capital Expenditures | 2.9 | 14.2 | –11.3 | 7.6 | 2(+) | 11.0 | 80.9 | 8.1 |
Inventories | 1.0 | 16.6 | –15.6 | 2.8 | 5(+) | 19.0 | 63.1 | 18.0 |
| Companywide Retail Activity | ||||||||
Companywide Sales | 19.4 | 8.4 | +11.0 | 4.5 | 2(+) | 34.3 | 50.8 | 14.9 |
Companywide Internet Sales | 11.8 | 9.4 | +2.4 | 3.9 | 2(+) | 24.1 | 63.6 | 12.3 |
| General Business Conditions, Retail Current (versus previous month) | ||||||||
| Indicator | Dec Index | Nov Index | Change | Series Average | Trend** | % Reporting Improved | % Reporting No Change | % Reporting Worsened |
Company Outlook | 7.7 | 11.9 | –4.2 | 1.4 | 2(+) | 20.9 | 65.9 | 13.2 |
General Business Activity | 3.6 | 8.2 | –4.6 | –2.6 | 2(+) | 16.5 | 70.6 | 12.9 |
| Outlook Uncertainty Current (versus previous month) | ||||||||
| Indicator | Dec Index | Nov Index | Change | Series Average | Trend* | % Reporting Increase | % Reporting No Change | % Reporting Decrease |
Outlook Uncertainty | –6.1 | 8.4 | –14.5 | 11.0 | 1(–) | 14.3 | 65.3 | 20.4 |
| Business Indicators Relating to Facilities and Products in Texas, Retail Future (six months ahead) | ||||||||
| Indicator | Dec Index | Nov Index | Change | Series Average | Trend* | % Reporting Increase | % Reporting No Change | % Reporting Decrease |
| Retail Activity in Texas | ||||||||
Sales | 32.0 | 25.3 | +6.7 | 30.3 | 19(+) | 44.0 | 44.0 | 12.0 |
Employment | 12.8 | 18.1 | –5.3 | 12.6 | 3(+) | 16.9 | 79.0 | 4.1 |
Part–Time Employment | 6.2 | 2.1 | +4.1 | 1.6 | 3(+) | 10.8 | 84.6 | 4.6 |
Hours Worked | 4.1 | 5.0 | –0.9 | 2.4 | 3(+) | 6.2 | 91.7 | 2.1 |
Wages and Benefits | 30.2 | 26.3 | +3.9 | 29.0 | 56(+) | 32.6 | 65.0 | 2.4 |
Input Prices | 41.3 | 22.3 | +19.0 | 33.8 | 56(+) | 47.8 | 45.7 | 6.5 |
Selling Prices | 36.9 | 20.0 | +16.9 | 28.6 | 56(+) | 47.8 | 41.3 | 10.9 |
Capital Expenditures | 11.9 | 17.2 | –5.3 | 16.6 | 3(+) | 18.5 | 74.9 | 6.6 |
Inventories | 22.4 | 2.8 | +19.6 | 10.8 | 14(+) | 33.4 | 55.6 | 11.0 |
| Companywide Retail Activity | ||||||||
Companywide Sales | 17.6 | 29.1 | –11.5 | 28.7 | 19(+) | 35.5 | 46.5 | 17.9 |
Companywide Internet Sales | 17.2 | 20.5 | –3.3 | 21.0 | 11(+) | 28.6 | 60.0 | 11.4 |
| General Business Conditions, Retail Future (six months ahead) | ||||||||
| Indicator | Dec Index | Nov Index | Change | Series Average | Trend** | % Reporting Improved | % Reporting No Change | % Reporting Worsened |
Company Outlook | 30.1 | 29.1 | +1.0 | 15.0 | 3(+) | 40.7 | 48.6 | 10.6 |
General Business Activity | 23.7 | 28.7 | –5.0 | 10.5 | 3(+) | 37.2 | 49.4 | 13.5 |
*Shown is the number of consecutive months of expansion or contraction in the underlying indicator. Expansion is indicated by a positive index reading and denoted by a (+) in the table. Contraction is indicated by a negative index reading and denoted by a (–) in the table.
**Shown is the number of consecutive months of improvement or worsening in the underlying indicator. Improvement is indicated by a positive index reading and denoted by a (+) in the table. Worsening is indicated by a negative index reading and denoted by a (–) in the table.
Data have been seasonally adjusted as necessary.
Texas Service Sector Outlook Survey
Texas Retail Outlook Survey
Texas Service Sector Outlook Survey
Comments from survey respondents
These comments are from respondents’ completed surveys and have been edited for publication.
- We expected an improvement after the election in November and December, but it turned out to be one of the worst Novembers ever, and so far, December is no better. The economy is slowing, and it is going to be tough to restart, and even that will come with large inflation increases.
- The Texas economy runs on skilled immigrant labor. Oil and gas, automotive, manufacturing and construction are some top examples. We hope our state leadership has a pragmatic, steady hand in not derailing our state economy.
- The Austin market seems more active than the north Texas region.
- Consulting work has restarted and is expected to go through February-March.
- Although we have the uncertainties of policy changes under a new administration, we remain cautiously optimistic for revenue growth. This is primarily due to the 2025 government contract opportunities in the pipeline and the maturing government procurement workforce.
- Concerns about inflation and wage pressure continue. Construction costs are increasing. The shortage of experienced professionals continues to affect capacity to accept more projects.
- A new administration always adds uncertainty in conducting business.
- After the election we are seeing more sales activity.
- The election of President Trump has been beneficial in creating certainty and likelihood that taxes will not be dramatically raised, or a slate of vast new regulations will be imposed, that harm small businesses. This has generated optimism among our customers.
- We are very worried about the economic impact of Trump's policies, which while business focused, do not seem to include small business.
- With the election behind us, we see greater certainty for a better regulatory environment for business in 2025.
- The proposed tariffs, immigration policy and other economic and social proposals from the incoming administration will have an immediate and significant negative impact on the overall economy. If enacted, we expect dramatic negative impacts on the construction and commercial real estate industries, some of which may last far beyond the next administration's legal term.
- We are expecting a small (2 percent to 5 percent) increase in revenue for 2025.
- Tariffs, particularly on Asia, could have adverse effects on the pricing of computer equipment and generate supply-chain issues.
- We signed our largest contract in the company's history with a national nonprofit, which of course changes the outlook for 2025. We continue to struggle to find top-notch talent, which is really the thing that is holding back transformational growth.
- Over regulation irritates customers and costs us a lot of money.
- Interest rates are still the major issue in the markets we serve.
- Now that the election is over, people and companies can move forward with less uncertainty.
- We are concerned about the possibility of tariffs that will drastically affect one side of our business. The possibility of an increase in tariffs, even though they have not been implemented, has already increased prices. New orders already have an escalation or option of increase pricing in the near term.
- It remains an uncertain hiring market. Client companies are still slow to backfill open positions, and when they decide to hire, they are slow to make decisions. Passive candidates are reluctant to make job changes and many not be open to hearing about new opportunities. There’s still a general feeling of uncertainty about the economy and the unknown with the new administration.
- With a large international student population, we anticipate decreases due to changes in state policy and visa uncertainty with the new presidential administration.
- With the incoming administration, there are many unknowns (immigration, tariffs, etc.) and new variables which have a direct impact on our business.
- We have seen an unexpected slowdown in general business and have been forced to cut staff to reduce labor expense. This is the first time in 17 years the company has had to cut staff.
- A new normal is setting in; weaker players are being weeded out and those of us who have remained focused on business fundamentals are prepared to thrive in 2025. We're even thinking about buying our own office building.
- The election created a positive outlook for business. There is more energy about the next four years.
- Everyone in commercial real estate is disappointed in both the Federal Reserve wait-and-see policy and the market reaction, with yields climbing, not dropping, after the latest discount rate cut.
- There’s uncertainty around duties and tariffs.
- We are viewing our business as stable at the moment. The new year will bring higher wages (cost-of-living adjustment increase) and selling prices (Producer Price Index adjustment to our tariff), but overall we expect a generally positive business environment with the new administration in Washington, as they will hopefully hold China in particular to purchase commitments previously made.
- This year's peak holiday season was softer than anticipated, producing general concerns over consumer spending and the macroeconomic environment at large. At the same time, potential spending and regulatory changes associated with the new administration have created uncertainty. Such changes may have a negative or positive impact on our business; it's too early to say.
- There’s lots of uncertainty surrounding the election results and potential policy changes.
- There is a very high level of uncertainty in our industry. This includes the impending tariffs, China's struggling economy and export status, and the looming U.S. East and Gulf Coast port strikes. Also, it appears the cross-border trucking industry from Mexico is encroaching on U.S. businesses: The motor carriers in Mexico crossing into the U.S. are then keeping their trucks here and moving freight with workers who are paid $400 per week versus U.S. workers at $1,500-$2,000 per week. This will continue to push U.S. motor carriers into bankruptcy and closure. Current reports are that there are still several thousand motor carriers closing or filing bankruptcy each month. We know this attrition has not stopped.
- We are still waiting for the new administration to start, and we will see what it is going to happen with the tariffs.
- The outcome of the election has stimulated the anticipation of expected positive changes. The primary hope is that the pace of regulation will slow down and possibly eliminate some over-burden for financial institutions. There has been a nominal increase in loan demand, and the deposit environment has started to change, eliminating some of the non-financial institutions beginning to lower money market rates. Certificates of deposit have increased by 15 to 20 percent. We are seeing an increasing number of inquiries from owners of commercial real estate who are facing a maturity default problem.
- Here is an old joke in the mortgage lending industry, the punch line of which is, "What do you think interest rates are going to do?"
- Proposed tariffs on Mexico and China will raise prices of our industry’s components and negatively impact sales and profit margins.
- We're expanding our services, acquiring another firm, and therefore anticipating further ramp-up operations, etc.
- We are worried about the negative impact of President-elect Trump’s policies. The biggest concerns are: 1) mass deportations of immigrants creating a critical labor shortage, anxiety among family members and local communities, and spiking inflation as the worker shortage is exacerbated; 2) extending or increasing the Trump tax cuts that may further widen income inequality and cuts to safety net programs; and 3) across-the-board tariff increases that will increase inflation and could trigger an international trade war.
- We have seen very short-term improvements in sentiment among our various businesses (professional staffing). It’s hard to say it’s a trend until the first quarter of 2025 numbers come in. Overall, we expect 2025 to show an increase in revenue. 2024 was recessionary for our industry. We saw declining to flat revenue across most of our business lines from mid-2023 until now. It does appear that the economic health of our clients and demand for our services are starting to recover. At the risk of bringing politics into it, the inflection point seems to be around the November election.
- We are not sure how additional inflation, or tariffs will affect property and casualty insurance premiums. The insurance industry may be more affected by weather-related claims and driving activity, so we are waiting to see if our insurance companies are more aggressive about keeping and writing new risks in 2025.
- We are concerned about our local business climate, which, according to anecdotes, is down. However, we are optimistic about the change in government that will happen in January.
- We will be closing the doors at our original brick-and-mortar location because of exponential rent increases. No alternative arrangement has been made at this point.
- We need to drop the lending rate again.
- The election results have improved our uncertainty going forward. The potential reduction in electric vehicle mandates has added to our confidence in the future of our business.
- We anticipate a slight increase in volume, but margins remain under pressure. We are optimistic the president-elect will create a more favorable business climate, and conditions will improve throughout 2025 and beyond.
- We feel like the general attitude toward business activity has stabilized (particularly the food service and restaurant industry). However, the new administration’s tariff policy could create some retaliatory tariffs in agricultural products (chicken, beef, sugar, etc.) that we export. My customers aren't particularly worried at this time, but with the implementation of tariffs, it could become expensive enough that they import products from elsewhere.
- We are really unable to have a firm prediction for 2025 forecasts. In the oil and gas markets, there is a lot of uncertainty around the markets in West Texas right now. We see headwinds of possible recessions and uncertain global growth vs. tail winds of a change in presidents and a locally strong economy.
- A long-time Mexican company and business partner has decided to cease all import and export of steel goods between the U.S. and Mexico until the tariff situation is clarified. Tariffs in general are absolutely stirring uncertainty in international trade. The upcoming port labor dispute negotiation and container availability bring extra concern to international trade.
- The outcome of the election leaves us optimistic that business conditions, economic conditions, will improve over the coming year, and this will be good for business, generally. We are also optimistic that fiscal policy, tax policy and the government's stance toward small business will also improve.
- We continue to have increased cost for labor, cost of goods sold, insurance, fuel charges; just about everything but our sales are up.
- December sales are slower than last year as Fort Bend Independent School District schools close later this year.
- We finally have a business-friendly administration, and we see more confidence.
Historical Data
Historical data can be downloaded dating back to January 2007.
Indexes
Download indexes for all indicators. For the definitions of all variables, see data definitions.
Texas Service Sector Outlook Survey |
Texas Retail Outlook Survey |
| Unadjusted | Unadjusted |
| Seasonally adjusted | Seasonally adjusted |
All Data
Download indexes and components of the indexes (percentage of respondents reporting increase, decrease, or no change). For the definitions of all variables, see data definitions.
Texas Service Sector Outlook Survey |
Texas Retail Outlook Survey |
| Unadjusted | Unadjusted |
| Seasonally adjusted | Seasonally adjusted |
Questions regarding the Texas Service Sector Outlook Survey can be addressed to Jesus Cañas at jesus.canas@dal.frb.org.
Sign up for our email alert to be automatically notified as soon as the latest Texas Service Sector Outlook Survey is released on the web.