
Texas Service Sector Outlook Survey
Growth in Texas service sector activity moderates
For this month’s survey, Texas business executives were asked supplemental questions on labor market, policy changes, and broad financial conditions. Results for these questions from the Texas Manufacturing Outlook Survey, Texas Service Sector Outlook Survey and Texas Retail Outlook Survey have been released together. Read the special questions results.
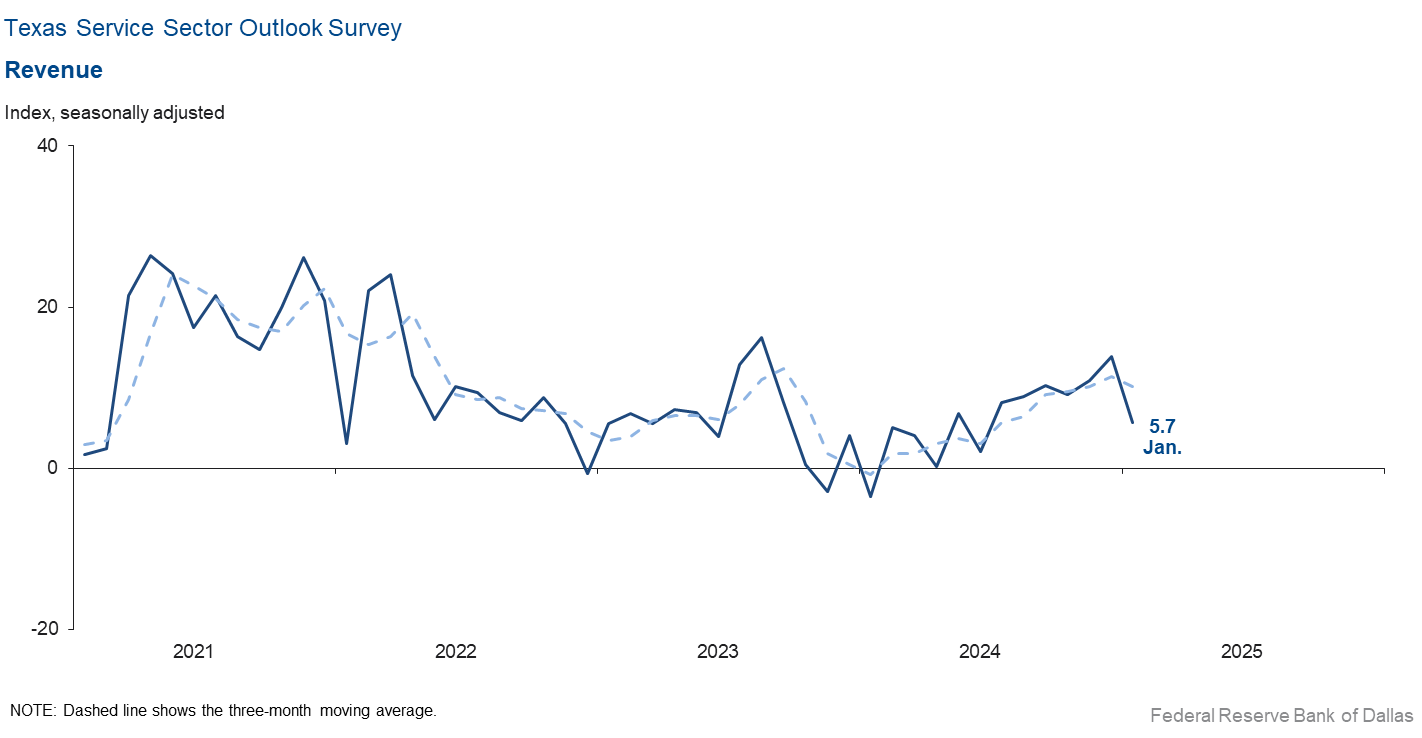
Texas service sector activity continued to increase but at a slower pace in January, according to business executives responding to the Texas Service Sector Outlook Survey. The revenue index, a key measure of state service sector conditions, fell eight points to 5.7, a seven-month low and indicative of a below-average pace of growth.
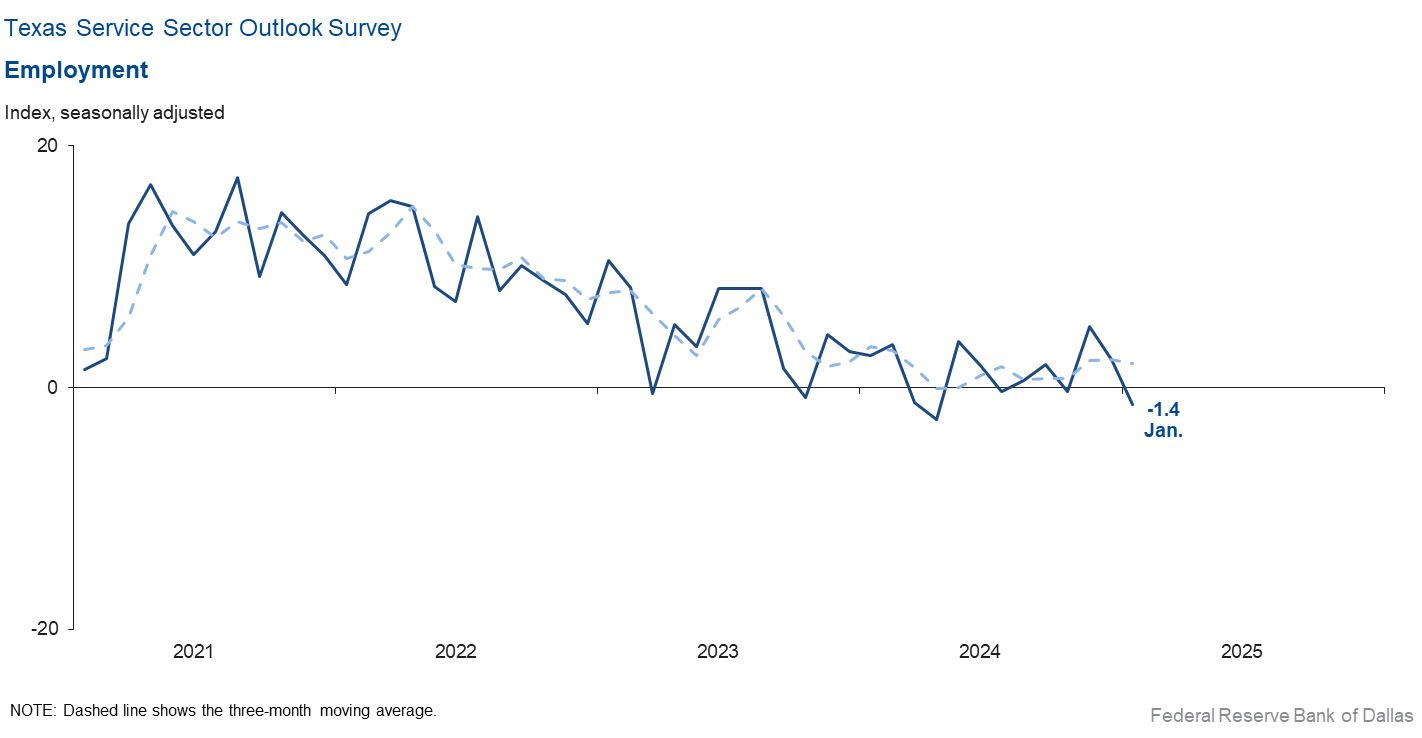
Labor market measures suggested no growth in employment but slightly longer workweeks in January. The employment index fell to -1.4 from 2.3, with the near-zero reading suggestive of no change in employment from last month. The part-time employment index rose five points to 4.5 while the hours-worked index increased to 3.6 from -1.0.
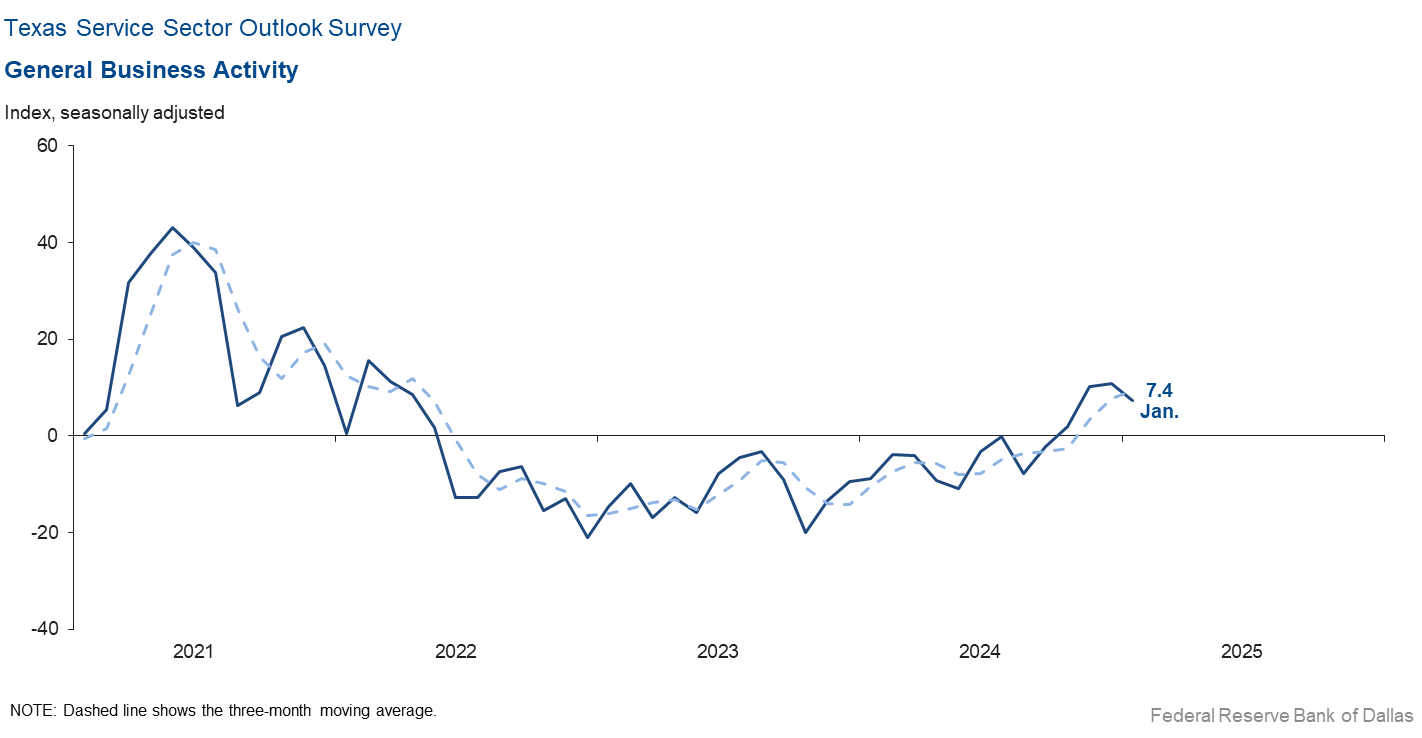
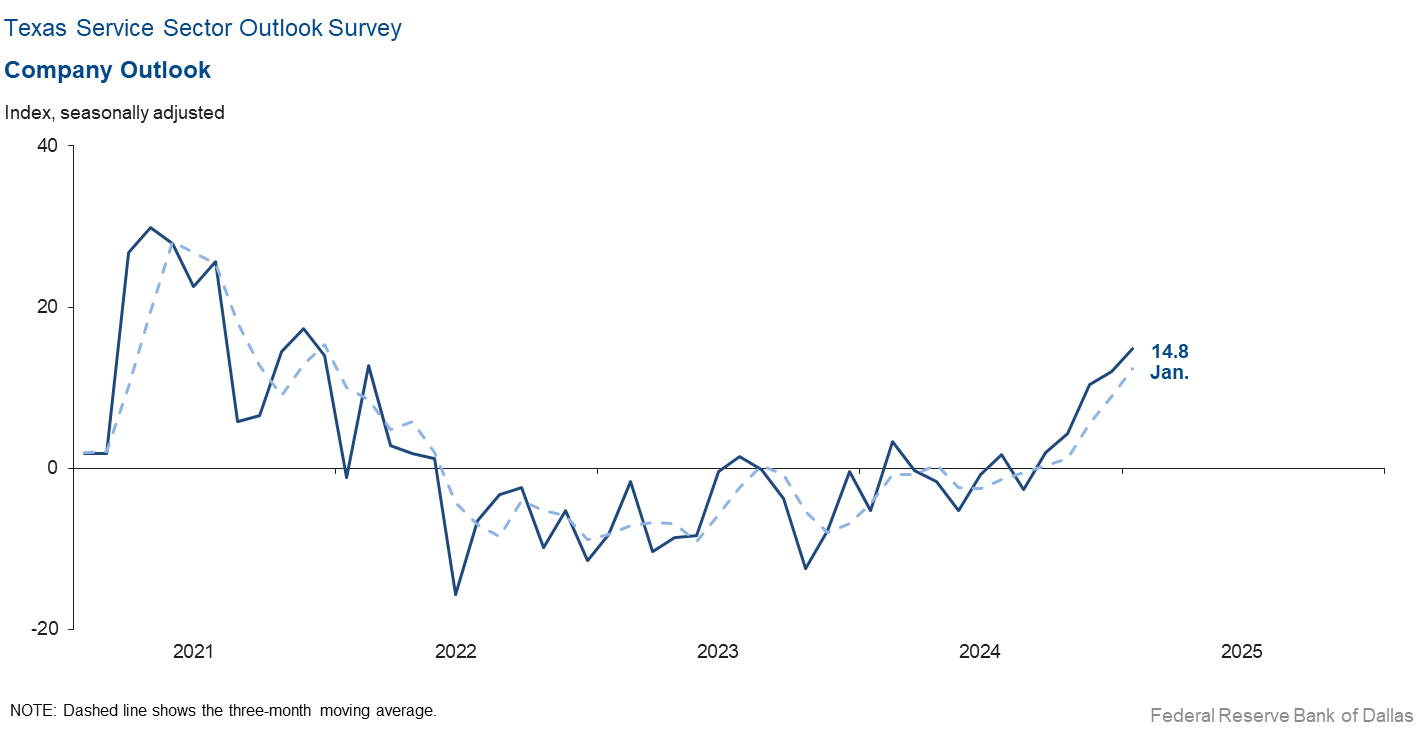
Perceptions of broader business conditions improved in January. The general business activity index remained in positive territory but fell to 7.4 from 10.8, while the company outlook index edged up to 14.8 from 12.0. The outlook uncertainty index increased to 3.0 from 1.6.
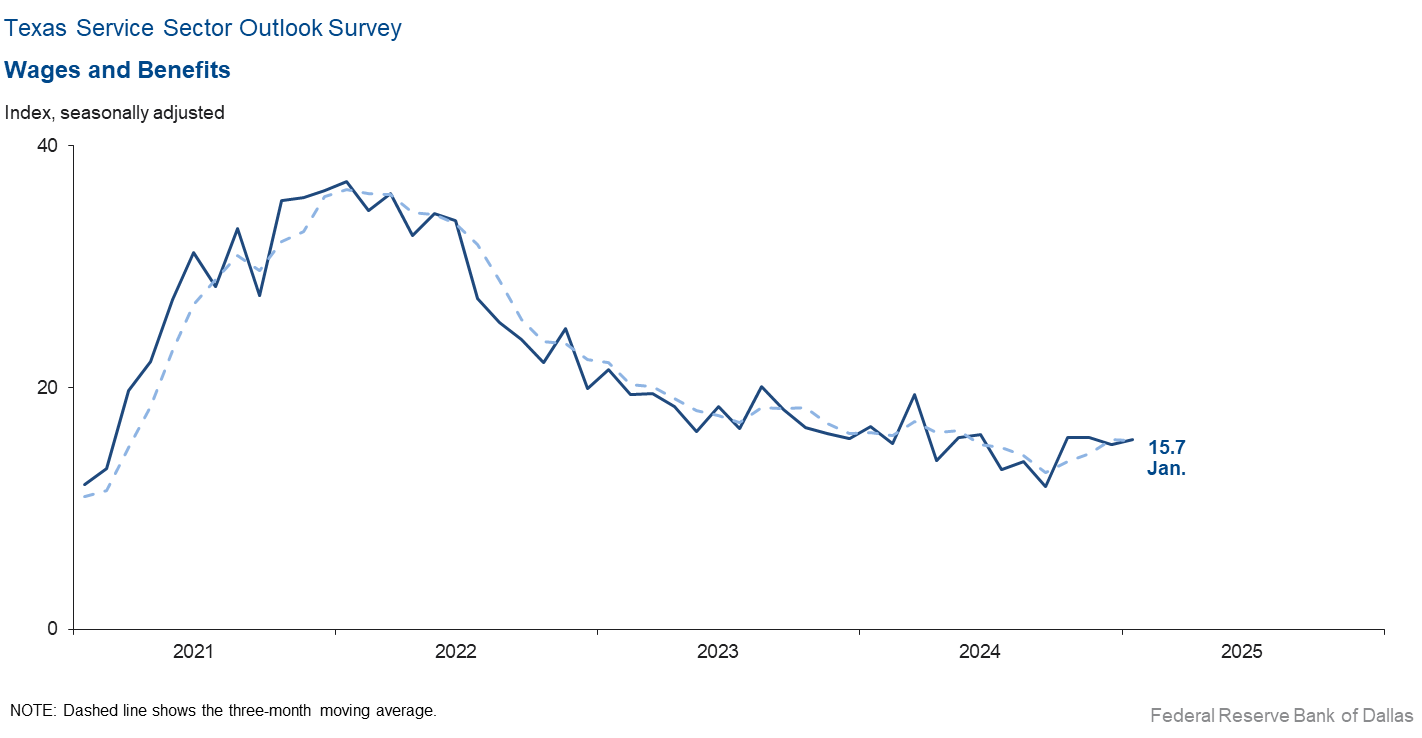
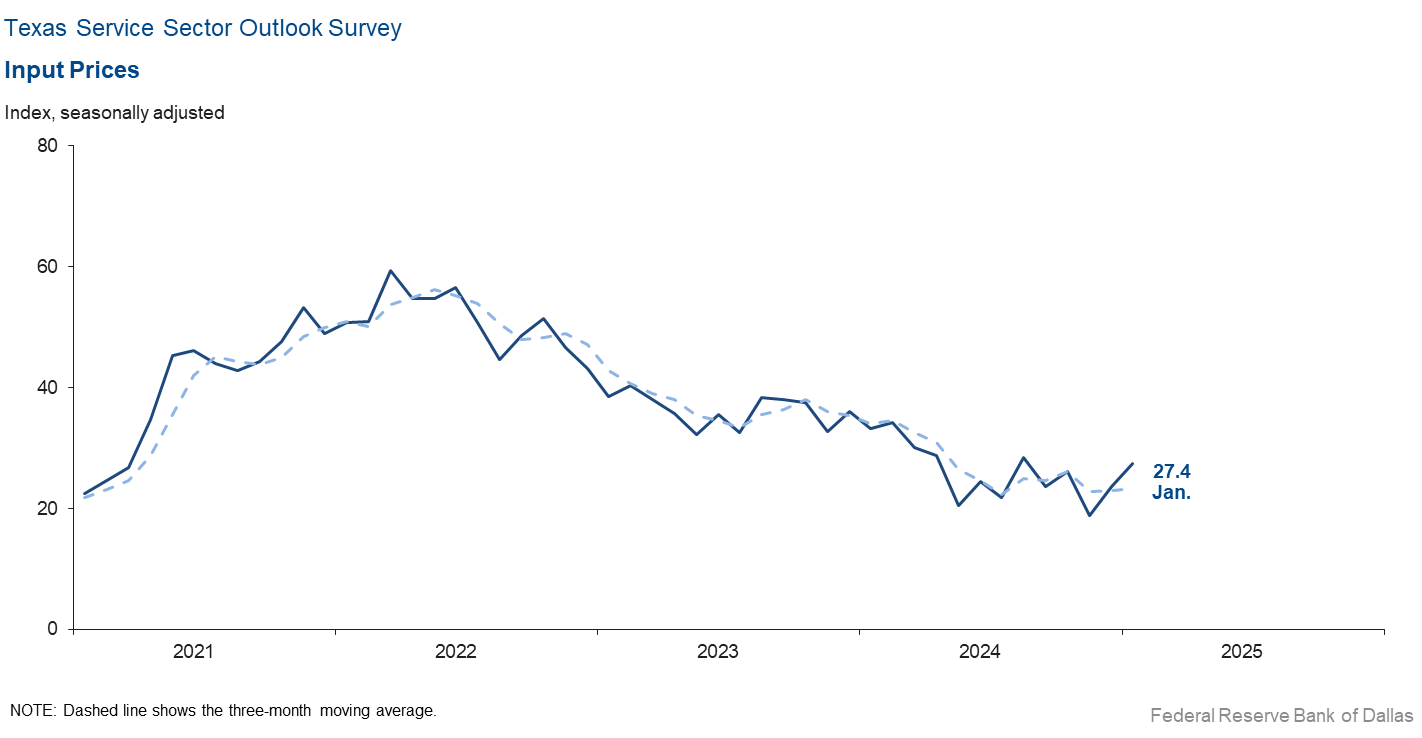
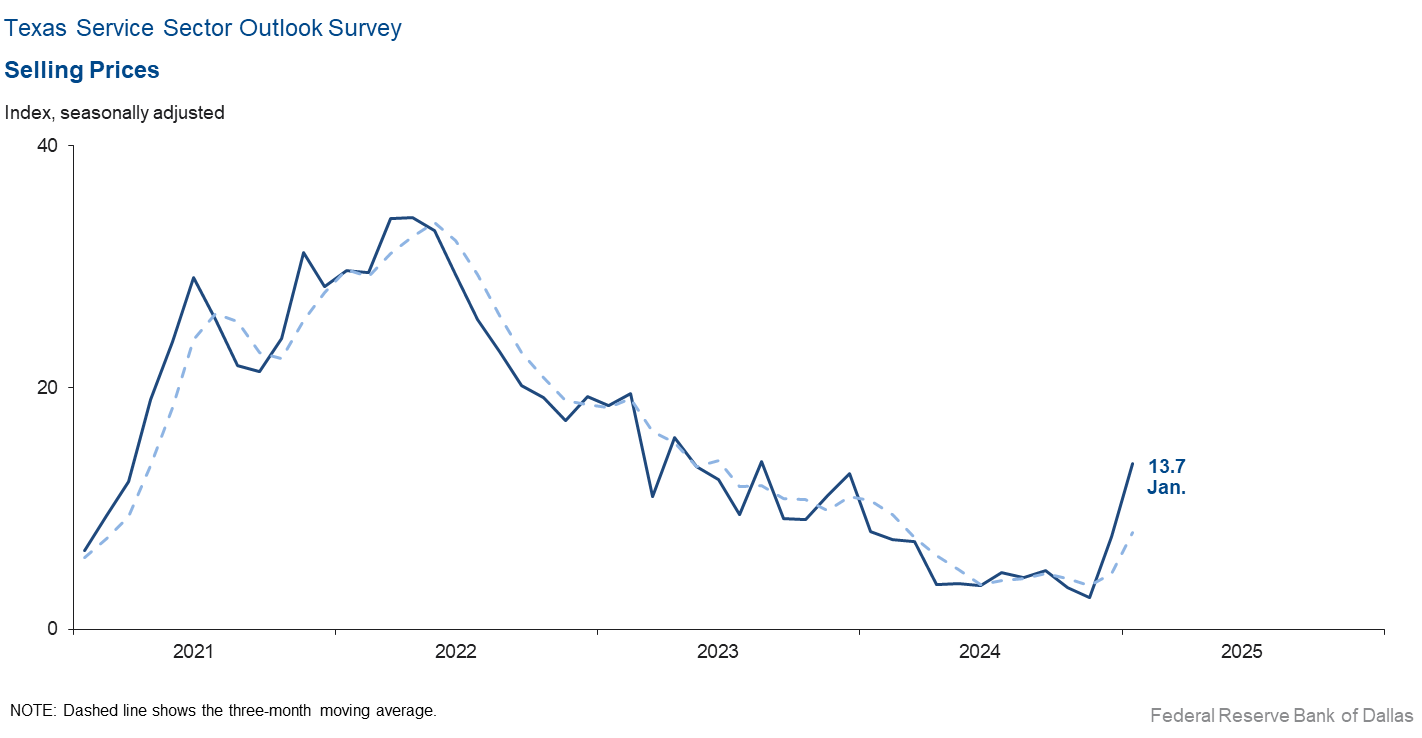
Price pressures increased for the second month in a row while wage pressures held steady in January. The selling prices index increased six points to 13.7, while the input prices index increased four points to 27.4. The wages and benefits index was little changed at 15.7.
Respondents’ expectations regarding future business activity continued to reflect optimism in January. The future general business activity index held steady at 31.2, while the future revenue index increased six points to 55.0. Other future service-sector activity indexes such as employment and capital expenditures remained in positive territory, reflecting expectations for sustained growth in the next six months.
Texas Retail Outlook Survey
Texas retail sales growth reverses in January
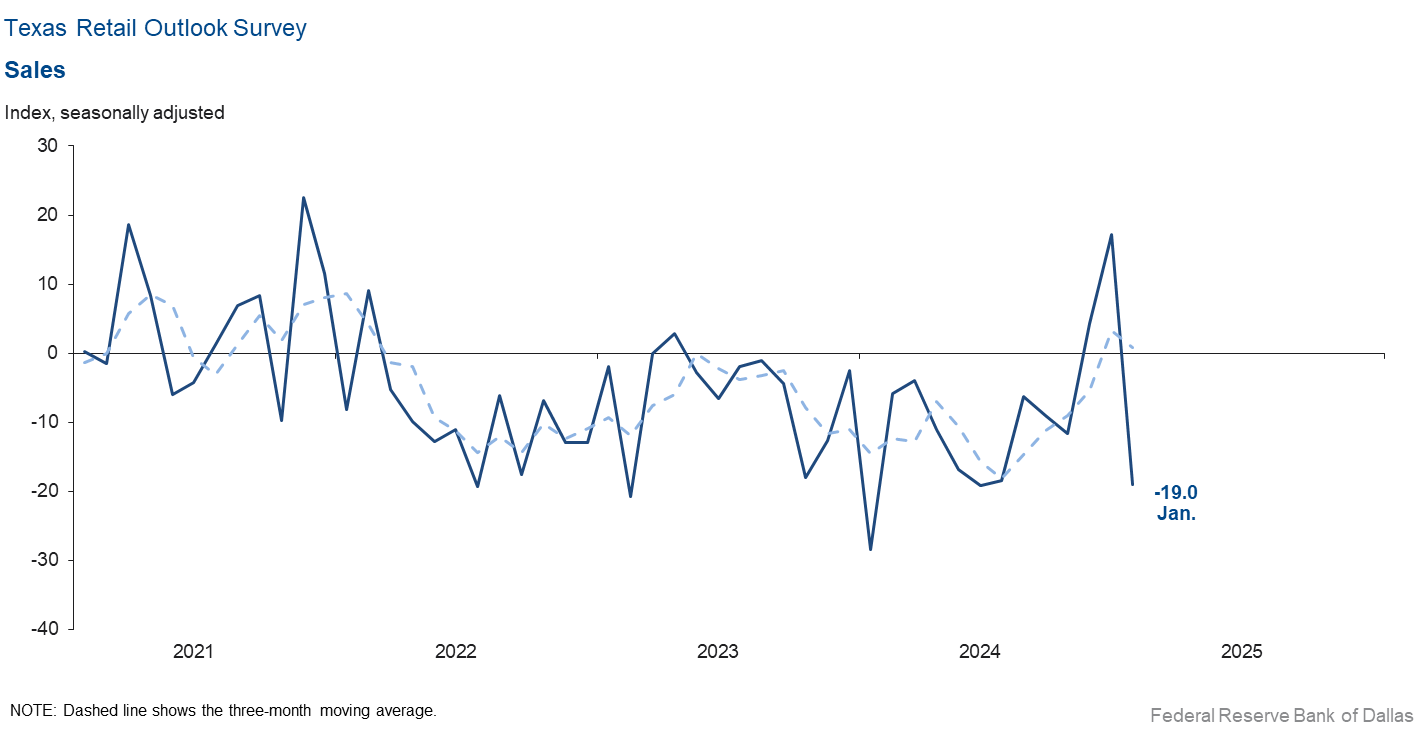
Retail sales activity contracted in January, according to business executives responding to the Texas Retail Outlook Survey. The sales index, a key measure of state retail activity, fell to -19.0 from 17.2, its lowest since June 2024. Retailers’ inventories grew over the month, with the January index at 11.5, up from 2.2 in December.
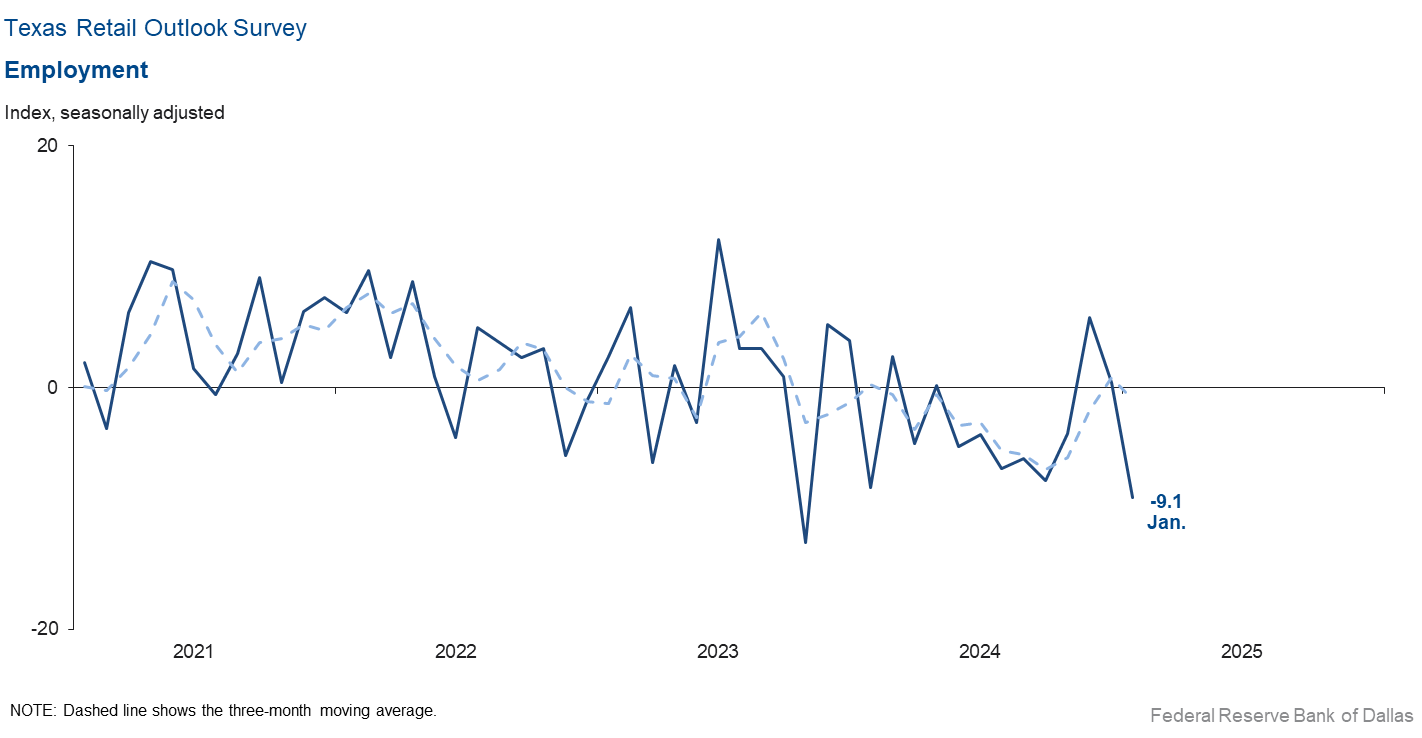
Retail labor market indicators suggested contracting employment and shorter workweeks this month. The employment index fell ten points to -9.1. The part-time employment index rose to 6.4 from 4.2, and the hours-worked index fell three points to -4.8.
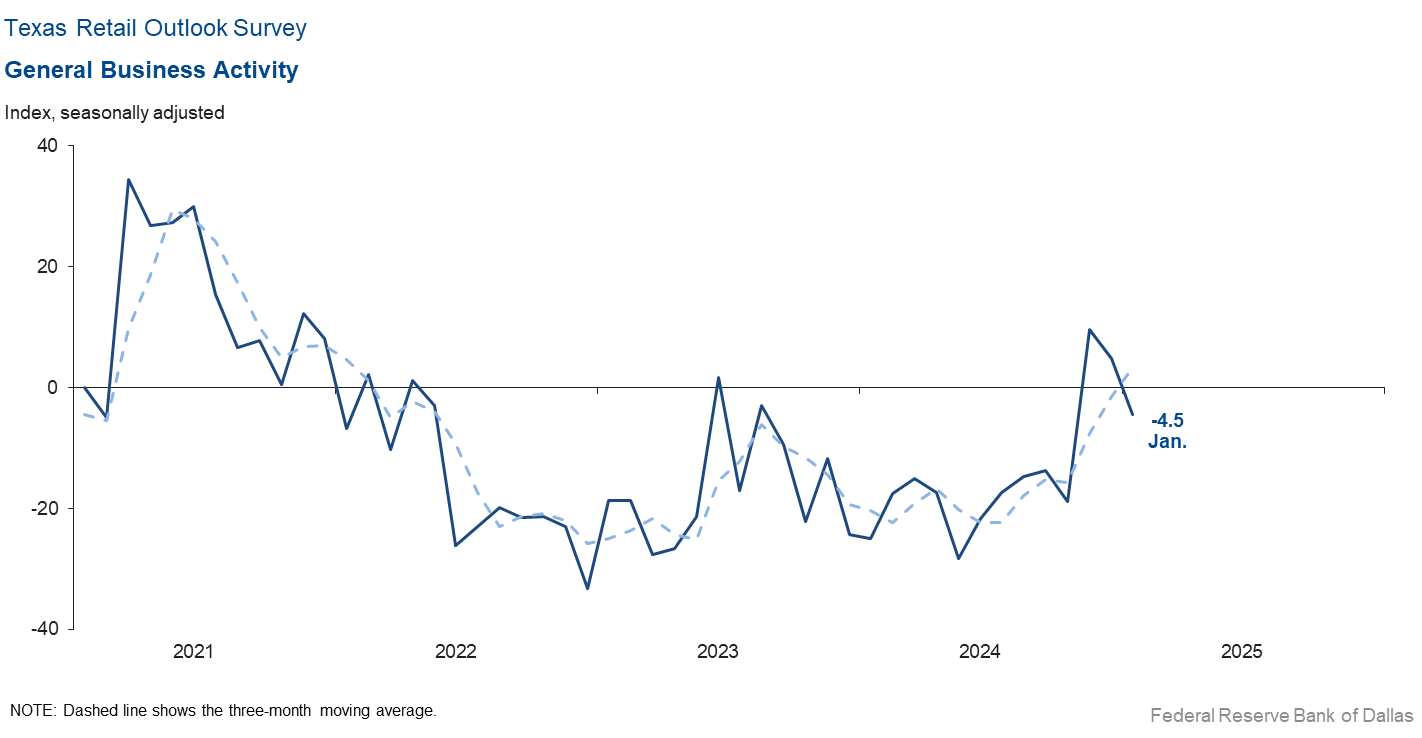
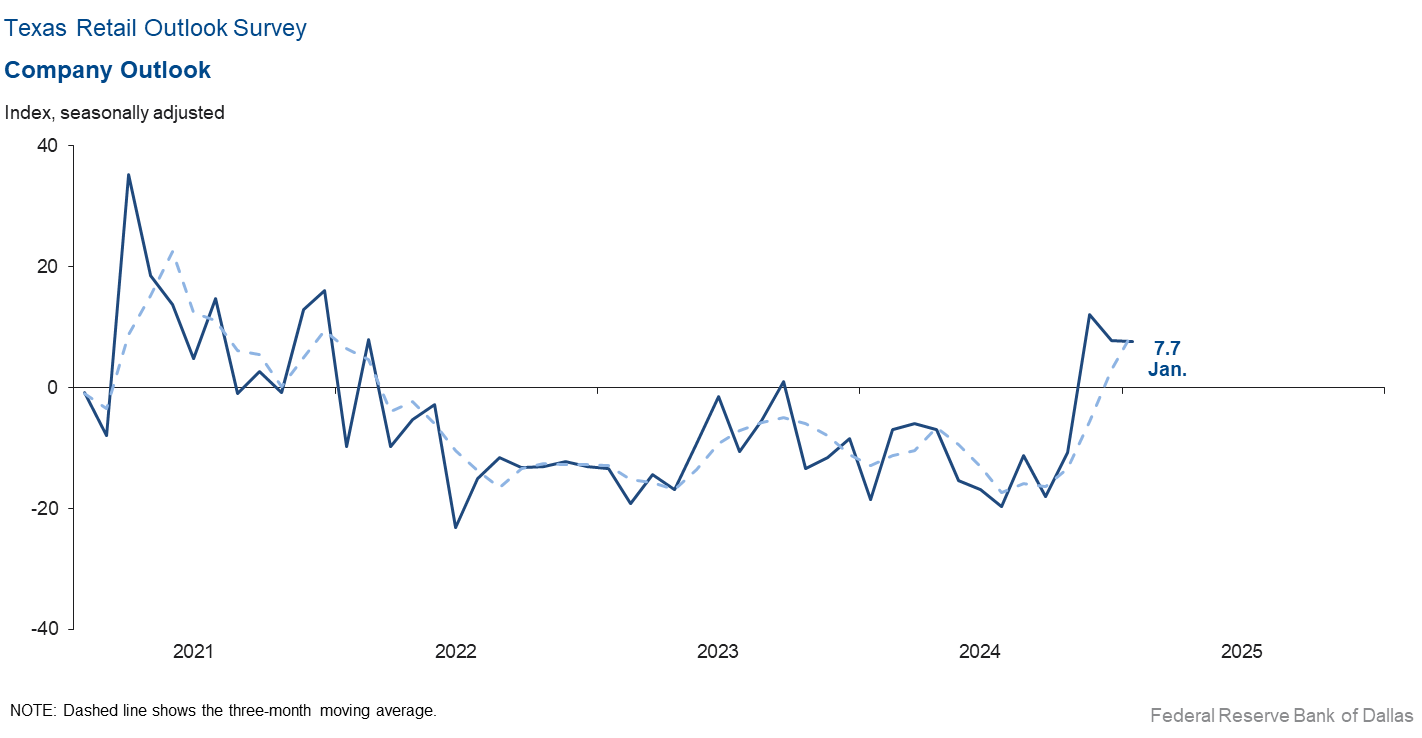
Perceptions of broader business conditions were mixed in January. The general business activity index fell back into negative territory coming in at -4.5, down from 4.8, while the company outlook index held steady at 7.7. Uncertainty about the outlooks increased, with the index rising five points to 5.7.
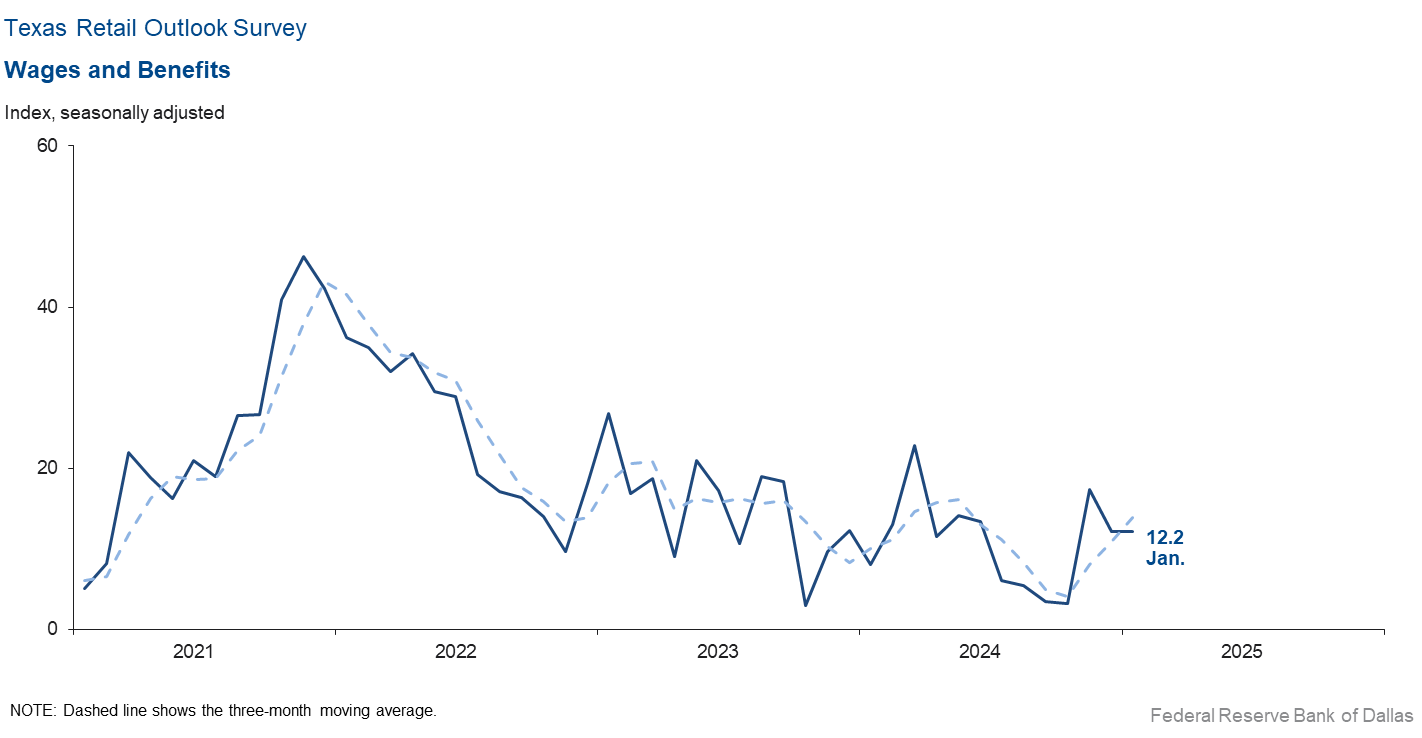
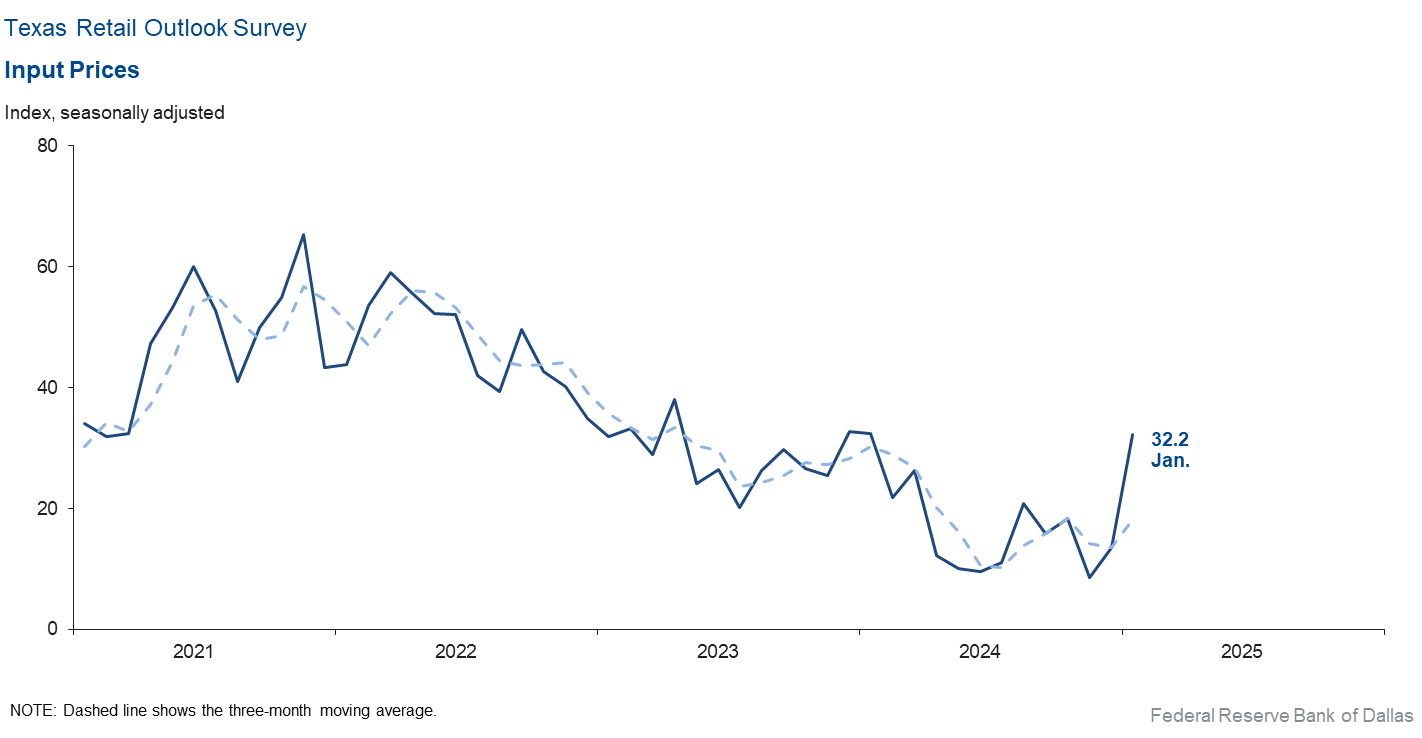
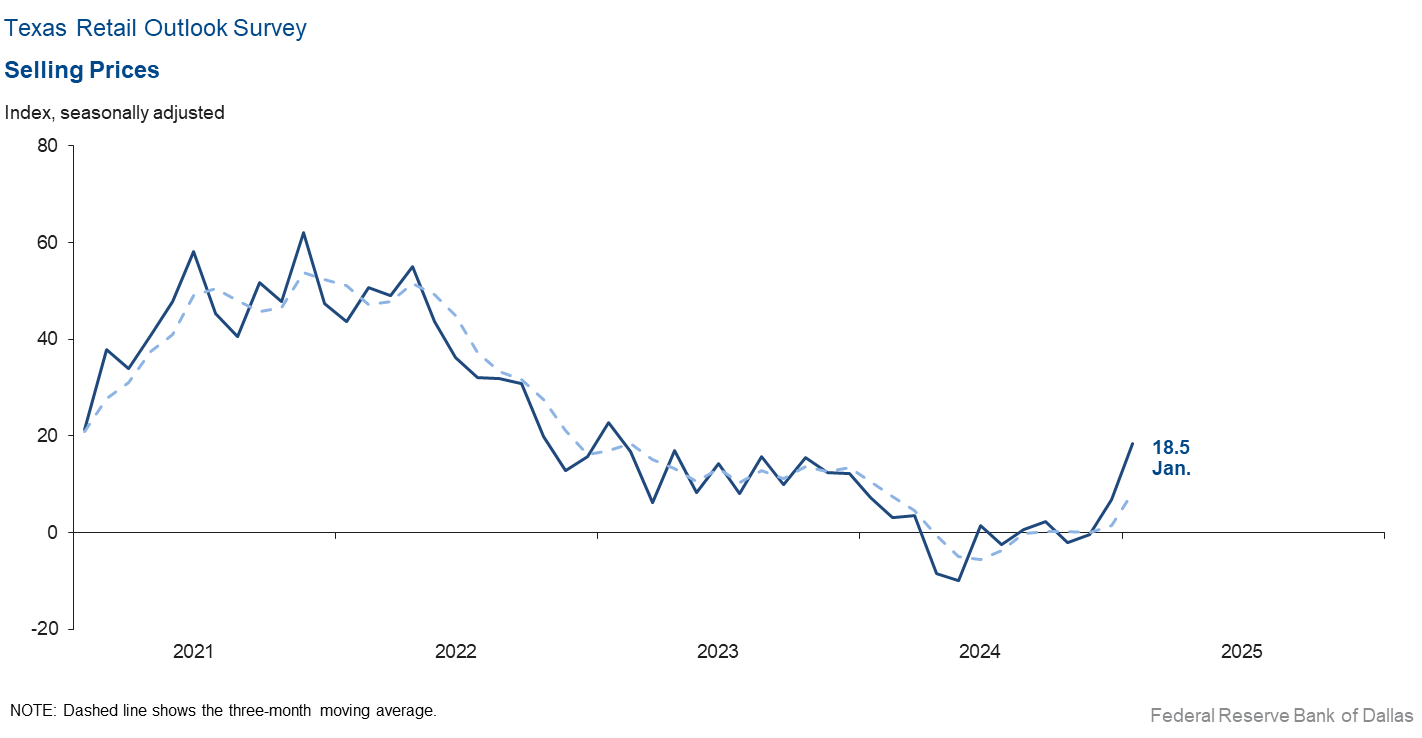
Upward pressure on selling and input prices increased notably, while wage growth held steady in January. The selling price index rose 12 points to 18.5, its highest reading in two years. The input price index shot up 19 points to 32.2. The wages and benefits index was unchanged at 12.2.
Expectations for future business conditions in retail improved in January. The future general business activity index remained positive but fell three points to 19.4, while the future sales index jumped 19.0 points to 51.6. Both the future employment index and the future capital expenditures index remained in positive territory and increased, suggesting improvement in retail activity in the next six months.
Next release: February 25, 2025
Data were collected January 14–22, and 255 of the 379 Texas service sector business executives surveyed submitted responses. The Dallas Fed conducts the Texas Service Sector Outlook Survey monthly to obtain a timely assessment of the state’s service sector activity. Firms are asked whether revenue, employment, prices, general business activity and other indicators increased, decreased or remained unchanged over the previous month.
Survey responses are used to calculate an index for each indicator. Each index is calculated by subtracting the percentage of respondents reporting a decrease from the percentage reporting an increase. When the share of firms reporting an increase exceeds the share reporting a decrease, the index will be greater than zero, suggesting the indicator has increased over the prior month. If the share of firms reporting a decrease exceeds the share reporting an increase, the index will be below zero, suggesting the indicator has decreased over the prior month. An index will be zero when the number of firms reporting an increase is equal to the number of firms reporting a decrease. Data have been seasonally adjusted as necessary.
Data have been seasonally adjusted as necessary.
Texas Service Sector Outlook Survey
Historical data are available from January 2007 to the most current release month.
| Business Indicators Relating to Facilities and Products in Texas Current (versus previous month) | ||||||||
| Indicator | Jan Index | Dec Index | Change | Series Average | Trend* | % Reporting Increase | % Reporting No Change | % Reporting Decrease |
Revenue | 5.7 | 13.9 | –8.2 | 10.6 | 12(+) | 26.5 | 52.8 | 20.8 |
Employment | –1.4 | 2.3 | –3.7 | 6.2 | 1(–) | 9.8 | 79.1 | 11.2 |
Part–Time Employment | 4.5 | –0.4 | +4.9 | 1.4 | 1(+) | 7.5 | 89.6 | 3.0 |
Hours Worked | 3.6 | –1.0 | +4.6 | 2.6 | 1(+) | 9.3 | 85.1 | 5.7 |
Wages and Benefits | 15.7 | 15.3 | +0.4 | 15.7 | 56(+) | 16.9 | 81.8 | 1.2 |
Input Prices | 27.4 | 23.7 | +3.7 | 27.8 | 57(+) | 30.3 | 66.7 | 2.9 |
Selling Prices | 13.7 | 7.7 | +6.0 | 7.6 | 54(+) | 20.5 | 72.6 | 6.8 |
Capital Expenditures | 12.5 | 8.5 | +4.0 | 9.9 | 54(+) | 15.3 | 81.9 | 2.8 |
| General Business Conditions Current (versus previous month) | ||||||||
| Indicator | Jan Index | Dec Index | Change | Series Average | Trend** | % Reporting Improved | % Reporting No Change | % Reporting Worsened |
Company Outlook | 14.8 | 12.0 | +2.8 | 4.4 | 5(+) | 20.5 | 73.8 | 5.7 |
General Business Activity | 7.4 | 10.8 | –3.4 | 2.4 | 4(+) | 17.1 | 73.1 | 9.7 |
| Indicator | Jan Index | Dec Index | Change | Series Average | Trend* | % Reporting Increase | % Reporting No Change | % Reporting Decrease |
Outlook Uncertainty | 3.0 | 1.6 | +1.4 | 13.0 | 44(+) | 19.3 | 64.4 | 16.3 |
| Business Indicators Relating to Facilities and Products in Texas Future (six months ahead) | ||||||||
| Indicator | Jan Index | Dec Index | Change | Series Average | Trend* | % Reporting Increase | % Reporting No Change | % Reporting Decrease |
Revenue | 55.0 | 49.0 | +6.0 | 37.5 | 57(+) | 61.4 | 32.2 | 6.4 |
Employment | 35.7 | 29.4 | +6.3 | 23.1 | 57(+) | 41.4 | 52.9 | 5.7 |
Part–Time Employment | 7.1 | 11.7 | –4.6 | 6.6 | 8(+) | 11.5 | 84.1 | 4.4 |
Hours Worked | 11.8 | 7.5 | +4.3 | 5.9 | 57(+) | 15.0 | 81.9 | 3.2 |
Wages and Benefits | 45.6 | 44.1 | +1.5 | 37.5 | 57(+) | 47.9 | 49.8 | 2.3 |
Input Prices | 43.4 | 41.9 | +1.5 | 44.3 | 217(+) | 47.5 | 48.4 | 4.1 |
Selling Prices | 24.1 | 29.1 | –5.0 | 24.5 | 57(+) | 31.5 | 61.0 | 7.4 |
Capital Expenditures | 24.2 | 23.9 | +0.3 | 22.8 | 56(+) | 27.7 | 68.7 | 3.5 |
| General Business Conditions Future (six months ahead) | ||||||||
| Indicator | Jan Index | Dec Index | Change | Series Average | Trend** | % Reporting Improved | % Reporting No Change | % Reporting Worsened |
Company Outlook | 35.4 | 31.5 | +3.9 | 15.7 | 14(+) | 42.9 | 49.7 | 7.5 |
General Business Activity | 31.2 | 29.9 | +1.3 | 12.2 | 9(+) | 41.2 | 49.0 | 10.0 |
Historical data are available from January 2007 to the most current release month.
| Business Indicators Relating to Facilities and Products in Texas Retail (versus previous month) | ||||||||
| Indicator | Jan Index | Dec Index | Change | Series Average | Trend* | % Reporting Increase | % Reporting No Change | % Reporting Decrease |
| Retail Activity in Texas | ||||||||
Sales | –19.0 | 17.2 | –36.2 | 3.2 | 1(–) | 22.9 | 35.2 | 41.9 |
Employment | –9.1 | 0.4 | –9.5 | 1.6 | 1(–) | 6.0 | 78.9 | 15.1 |
Part–Time Employment | 6.4 | 4.2 | +2.2 | –1.5 | 3(+) | 11.9 | 82.5 | 5.5 |
Hours Worked | –4.8 | –1.8 | –3.0 | –2.2 | 2(–) | 6.1 | 83.1 | 10.9 |
Wages and Benefits | 12.2 | 12.2 | 0.0 | 11.2 | 54(+) | 13.5 | 85.1 | 1.3 |
Input Prices | 32.2 | 13.5 | +18.7 | 22.4 | 57(+) | 35.7 | 60.8 | 3.5 |
Selling Prices | 18.5 | 6.9 | +11.6 | 13.1 | 2(+) | 32.4 | 53.6 | 13.9 |
Capital Expenditures | 6.4 | 2.5 | +3.9 | 7.6 | 3(+) | 13.5 | 79.4 | 7.1 |
Inventories | 11.5 | 2.2 | +9.3 | 2.8 | 6(+) | 20.7 | 70.1 | 9.2 |
| Companywide Retail Activity | ||||||||
Companywide Sales | –7.0 | 19.2 | –26.2 | 4.4 | 1(–) | 21.6 | 49.8 | 28.6 |
Companywide Internet Sales | –7.1 | 11.6 | –18.7 | 3.9 | 1(–) | 6.6 | 79.7 | 13.7 |
| General Business Conditions, Retail Current (versus previous month) | ||||||||
| Indicator | Jan Index | Dec Index | Change | Series Average | Trend** | % Reporting Improved | % Reporting No Change | % Reporting Worsened |
Company Outlook | 7.7 | 7.8 | –0.1 | 1.5 | 3(+) | 13.4 | 80.9 | 5.7 |
General Business Activity | –4.5 | 4.8 | –9.3 | –2.6 | 1(–) | 11.7 | 72.1 | 16.2 |
| Outlook Uncertainty Current (versus previous month) | ||||||||
| Indicator | Jan Index | Dec Index | Change | Series Average | Trend* | % Reporting Increase | % Reporting No Change | % Reporting Decrease |
Outlook Uncertainty | 5.7 | 0.9 | +4.8 | 11.0 | 6(+) | 17.6 | 70.5 | 11.9 |
| Business Indicators Relating to Facilities and Products in Texas, Retail Future (six months ahead) | ||||||||
| Indicator | Jan Index | Dec Index | Change | Series Average | Trend* | % Reporting Increase | % Reporting No Change | % Reporting Decrease |
| Retail Activity in Texas | ||||||||
Sales | 51.6 | 32.6 | +19.0 | 30.4 | 20(+) | 61.1 | 29.3 | 9.5 |
Employment | 28.9 | 10.3 | +18.6 | 12.6 | 4(+) | 34.6 | 59.8 | 5.7 |
Part–Time Employment | 0.9 | 5.8 | –4.9 | 1.5 | 4(+) | 9.0 | 82.9 | 8.1 |
Hours Worked | –1.0 | 4.6 | –5.6 | 2.4 | 1(–) | 7.9 | 83.2 | 8.9 |
Wages and Benefits | 31.9 | 34.6 | –2.7 | 29.1 | 57(+) | 33.1 | 65.7 | 1.2 |
Input Prices | 35.1 | 41.3 | –6.2 | 33.8 | 57(+) | 43.2 | 48.6 | 8.1 |
Selling Prices | 15.7 | 36.9 | –21.2 | 28.5 | 57(+) | 28.9 | 57.9 | 13.2 |
Capital Expenditures | 17.3 | 13.7 | +3.6 | 16.6 | 14(+) | 26.4 | 64.5 | 9.1 |
Inventories | 12.2 | 21.4 | –9.2 | 10.8 | 15(+) | 29.1 | 54.0 | 16.9 |
| Companywide Retail Activity | ||||||||
Companywide Sales | 38.3 | 17.8 | +20.5 | 28.8 | 20(+) | 47.4 | 43.6 | 9.1 |
Companywide Internet Sales | 33.4 | 17.2 | +16.2 | 21.1 | 12(+) | 36.7 | 60.0 | 3.3 |
| General Business Conditions, Retail Future (six months ahead) | ||||||||
| Indicator | Jan Index | Dec Index | Change | Series Average | Trend** | % Reporting Improved | % Reporting No Change | % Reporting Worsened |
Company Outlook | 22.0 | 29.4 | –7.4 | 15.1 | 4(+) | 33.9 | 54.2 | 11.9 |
General Business Activity | 19.4 | 22.3 | –2.9 | 10.5 | 4(+) | 35.3 | 48.9 | 15.9 |
*Shown is the number of consecutive months of expansion or contraction in the underlying indicator. Expansion is indicated by a positive index reading and denoted by a (+) in the table. Contraction is indicated by a negative index reading and denoted by a (–) in the table.
**Shown is the number of consecutive months of improvement or worsening in the underlying indicator. Improvement is indicated by a positive index reading and denoted by a (+) in the table. Worsening is indicated by a negative index reading and denoted by a (–) in the table.
Data have been seasonally adjusted as necessary.
Texas Service Sector Outlook Survey
Texas Retail Outlook Survey
Texas Service Sector Outlook Survey
Comments from survey respondents
These comments are from respondents’ completed surveys and have been edited for publication.
- Politics clouds the ability to see into the economic future.
- The business climate in the U.S. for 2025 is getting better than 2024.
- 2025 may prove to be a pivotal year for aerospace and defense companies, considering the role digital technologies like artificial intelligence and generative AI could play in enhancing traditional talent strategies. In November 2024, the Department of Defense issued a request for proposal for Advancing Artificial Intelligence Multiple Award Contract (AAMAC). AAMAC is aiming to establish a sustainable framework for AI advancements across the Department of Defense.
- Unknowns as to new administration proposals are impacting our client base.
- Our clients are manufacturers, and there is a sense of cautious optimism concerning the new administration among this group. No one expects the economy to magically improve, but there is a general feeling in the business community that this administration will do a better job with the economy.
- The real estate market is looking for a sign of where interest rates are headed. Until that is determined, transaction volume will remain sluggish.
- We are more optimistic with the change in administration. We have a better outlook for oil and gas business in Texas and the rest of the U.S.
- Our current increase in capital expenditures is directly related to our office move, the first time in over 30 years. Once this is complete, we expect our capital expenditures to return to normal. There continue to be concerns with the possible policies of the incoming presidential administration and their likely negative adverse impacts on various businesses and the economy as a whole.
- It seems like our labor issues are getting better. We are more optimistic about finding new candidates than we were a few months ago.
- A customer contract was terminated as of end of January. We have no foreseeable replacement revenue.
- Profit is low, and debt service a challenge. Our employees need raises, but no money is available. They're still underwater from recent inflation.
- Land developers—commercial, residential and industrial—are positive about 2025. They are enthusiastic about the business activity within North Texas and around Austin. We are hopeful that they are correct.
- Change in administration has definitely increased the uncertainty. We have no idea where the country is headed.
- The new president’s plans to boost the economy, reduce illegal border crossings, boost our armed forces and related U.S. safety and further curb inflation are areas of encouragement.
- We will most likely be shutting down our operation in March. Insurance costs will make operating prohibitive.
- It looks like real estate is beginning to move again, so several of our clients that have been sitting on illiquid assets may improve their cash flow and liquidity in the next couple of months. The possible sales of real estate and restart of development projects are improving our company outlook. We will not see the proceeds of the potential sales in January, but they will trickle in over the next several months.
- We are waiting to see how the new administration deals with tariffs, immigration and the government deficit. These three factors will be critical to the health of the economy in the next two years.
- Recent pressure on interest rates is concerning; however, the long-term impact is uncertain. Otherwise we see generally positive indicators with clients.
- Our outlook is closely tied to legislative decisions and actions, so uncertainty is high while the legislature is in session.
- We enter the year softer than in 2024. We hope to see demand increase as the new administration takes over and questions start to get answered.
- We think most of us entrepreneurs are optimistic about the Trump pro-business government mainly due to lower taxes and a higher depreciation bonus.
- Inflation is persistent, especially in the cost of insurance. Government regulations are a huge burden, requiring extra unbilled staff to try to stay in compliance. Higher interest rates reduce the willingness to invest in new assets.
- Consumers appear to be more confident, and that likely will translate into more sales for our company.
- Long-term bond yields are depressing commercial real estate dealmaking.
- Tariffs and regulatory changes are increasing uncertainty. The Houthis announcing they will pull out of the Red Sea could have a huge impact on our work, since international cargo will shift back to the usual trade route and potentially to the East Coast rather than the West Coast.
- We remain generally optimistic about the overall outlook for energy under the new administration. We budgeted for slightly reduced headcount in 2025, but we included a 3 percent cost-of-living adjustment in wages and a 3 percent general tariff increase in our customer rates.
- A significant number of our manufacturing clients could be negatively impacted by the upcoming tariff policy if implemented as proposed by the incoming administration.
- It's the start of a new year, and we're optimistic for economic improvements and a reduction in business regulations.
- We may see some improvement in business expectations this month, but inflation is still terrible. Regulatory relief is in the wind, but it may be further down the list. The Fed lowered the benchmark rate and Treasuries rates go up, which is out of the ordinary. There are a lot of people waiting to see what happens. The sad event in California will have an impact on insurance rates.
- The announced policy positions of the incoming Trump administration (tariffs, mass deportations, possible forcible takeover of Greenland and the Panama Canal) create heightened uncertainty and substantial risk of higher inflation. This uncertainty is detrimental to general business conditions and our commercial real estate investment business.
- The potential for tariffs and other trade restrictions creates uncertainty for us, our partners and our customers. This uncertainty is likely to persist until the new administration creates clarity on the regulatory regime it is likely to put into place. This uncertainty, combined with the tight rate environment, has heightened uncertainty and risk from our perspective.
- Generally speaking, we are seeing a seasonal decrease in sales volumes, but surprisingly are nonetheless up over January 2024 revenue. Challenges include a slight increase in the cost of products. Applicant numbers for open positions remain higher than a year ago and steady, so the labor market seems to have cooled.
- The cost of business is higher as we have to pay property taxes in January. Selling prices are lower as we run promotions due to competition.
- We had a challenging in 2024 toward the end, and our 2025 outlook is negative. The thoughts of tariffs and deportations hurt a small business such as ours. We have a large agriculture and minority customer base, and posturing by the new administration makes them all nervous.
- We are talking with a salesman/contractor who should help us drive new business. We anticipate bringing on new business in the late first quarter.
- January is off to a slow start, but that isn't unusual. We are optimistic that President Trump will create a pro-business climate. How quickly his administration can make a difference is the question.
- New vehicle unit sales have declined a little more than the normal seasonal change. Used vehicle unit sales have increased a little more than the normal seasonal change.
- Stagnant business environment.
- There is a renewed spirit of optimism in the business world.
- After over 10 years, we have closed our flagship brick-and-mortar store location due to exponential lease increases. We do have one remaining physical location and various business expansions happening in 2025. So, with the uncertainty caused by losing our top revenue-producing location, we are optimistic that the changes and expansions in 2025 will be profitable.
- We feel much better about the business environment since Trump has been elected.
Historical Data
Historical data can be downloaded dating back to January 2007.
Indexes
Download indexes for all indicators. For the definitions of all variables, see data definitions.
Texas Service Sector Outlook Survey |
Texas Retail Outlook Survey |
| Unadjusted | Unadjusted |
| Seasonally adjusted | Seasonally adjusted |
All Data
Download indexes and components of the indexes (percentage of respondents reporting increase, decrease, or no change). For the definitions of all variables, see data definitions.
Texas Service Sector Outlook Survey |
Texas Retail Outlook Survey |
| Unadjusted | Unadjusted |
| Seasonally adjusted | Seasonally adjusted |
Questions regarding the Texas Service Sector Outlook Survey can be addressed to Jesus Cañas at jesus.canas@dal.frb.org.
Sign up for our email alert to be automatically notified as soon as the latest Texas Service Sector Outlook Survey is released on the web.