Texas Service Sector Outlook Survey


Growth in Texas service sector activity continues
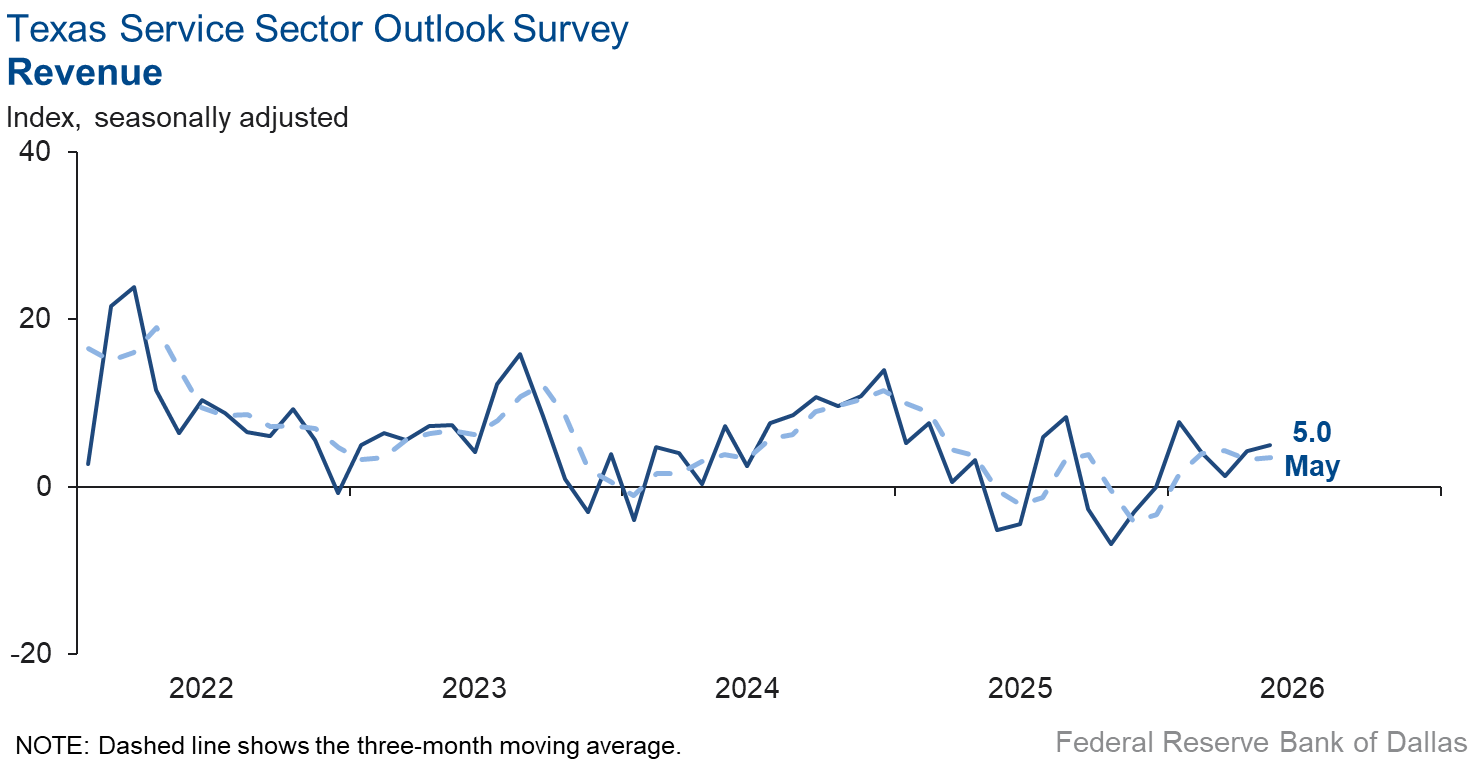
Texas service sector activity expanded at about the same pace in May as the prior month, according to business executives responding to the Texas Service Sector Outlook Survey. The revenue index, a key measure of state service sector conditions, was little changed at 5.0.
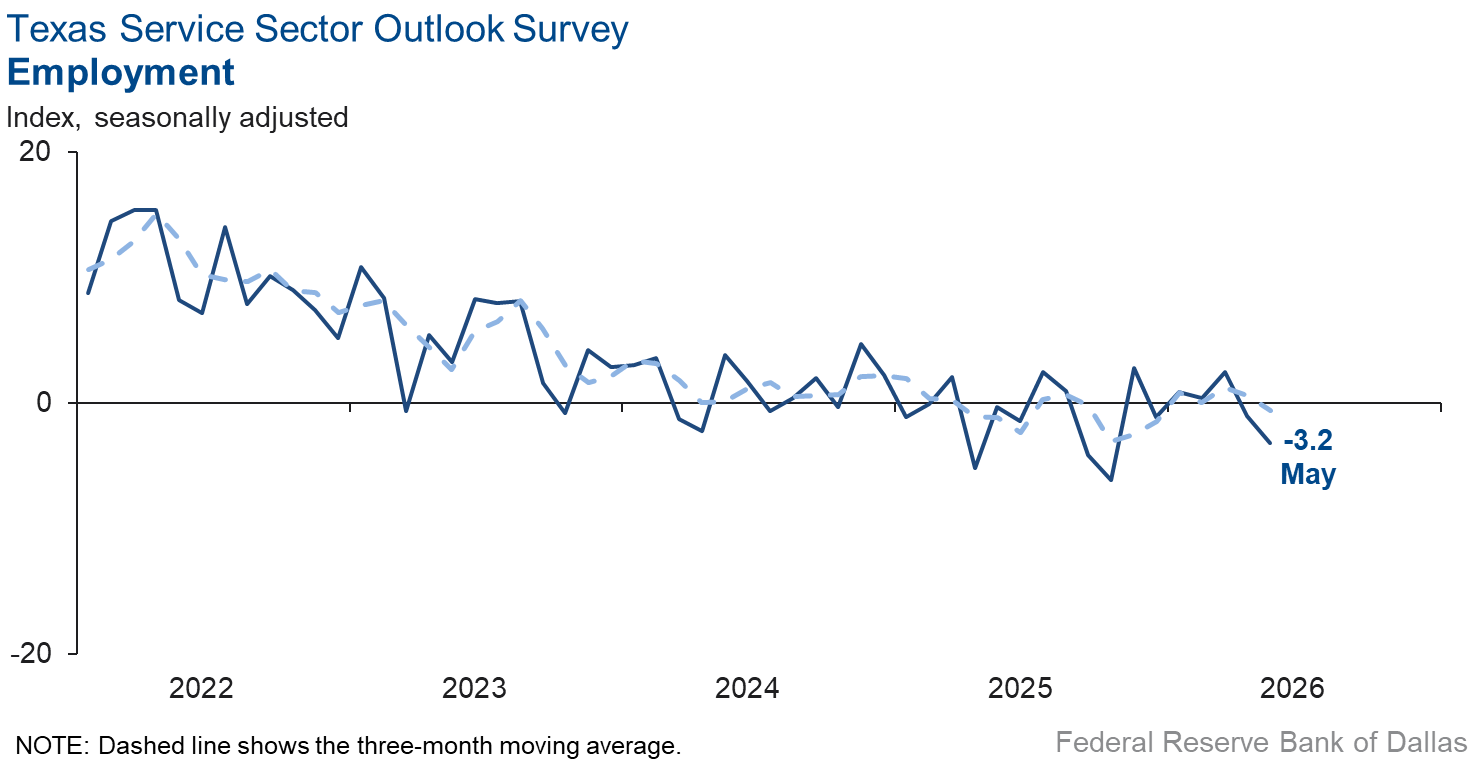
Labor market measures suggested a slight decline in employment in May and no change in workweeks. The employment index dipped two points to -3.2. Meanwhile, the hours worked index was near zero for the third consecutive month.
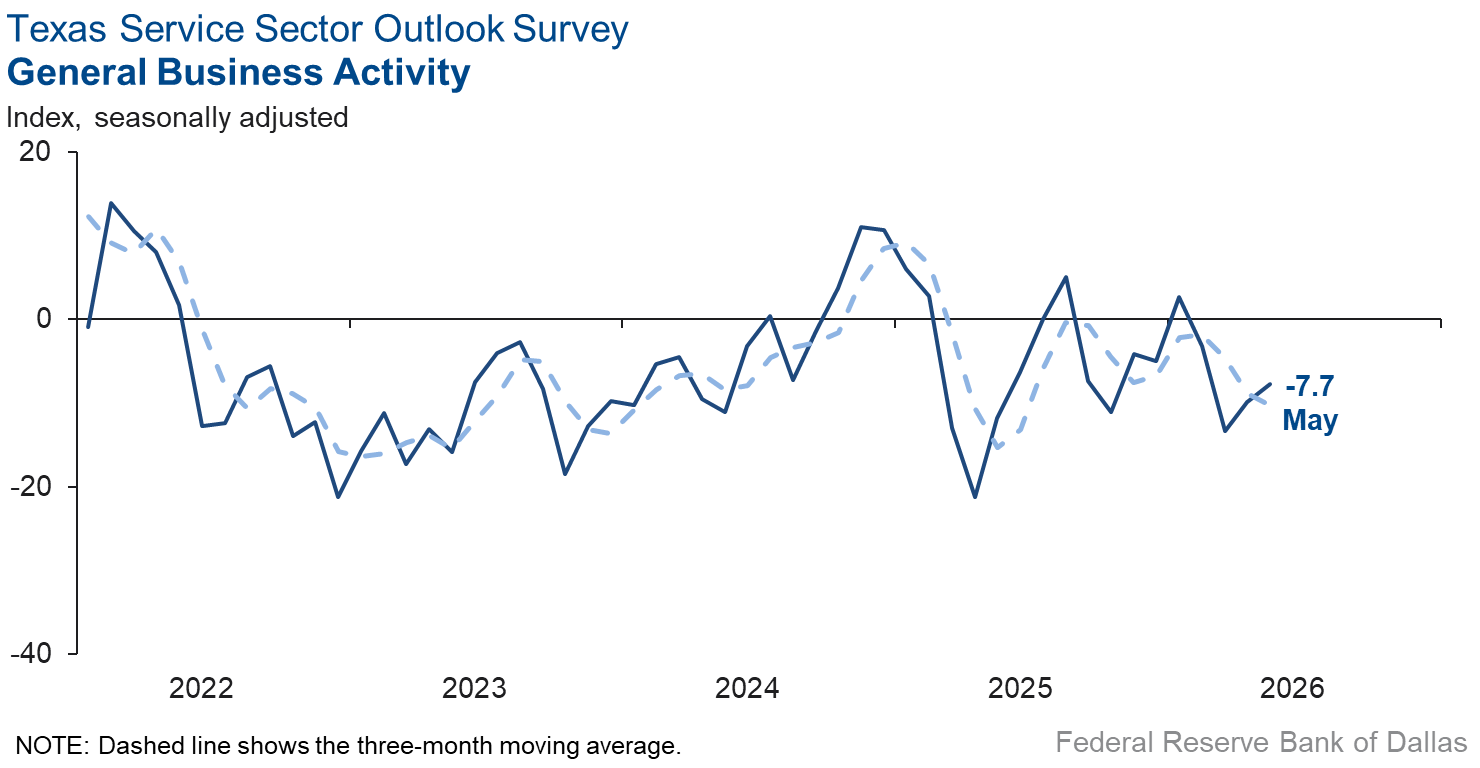
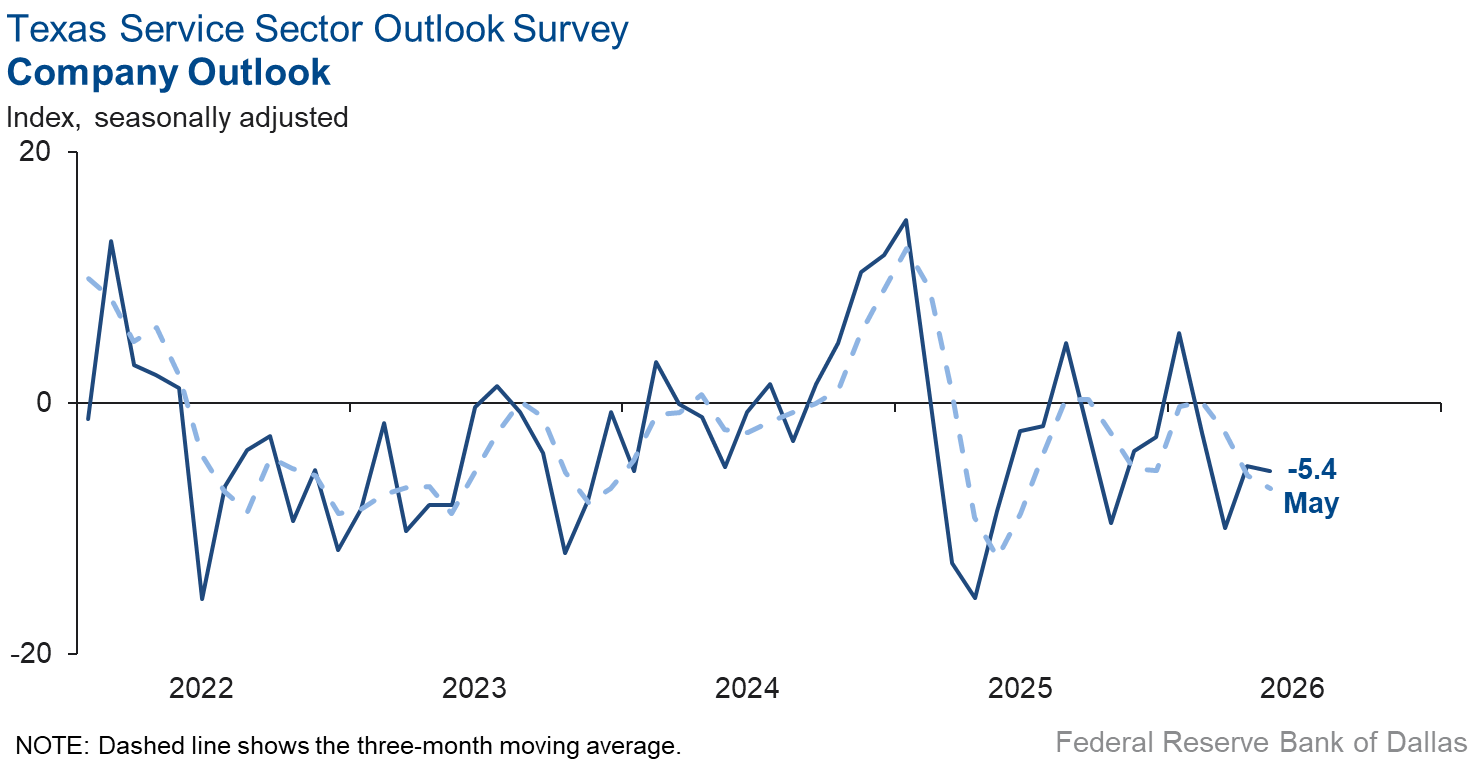
Perceptions of broader business conditions continued to worsen in May. The general business activity index ticked up two points but remained in negative territory at -7.7. The company outlook index was little changed at -5.4. Meanwhile, the outlook uncertainty index fell eleven points to 14.0.
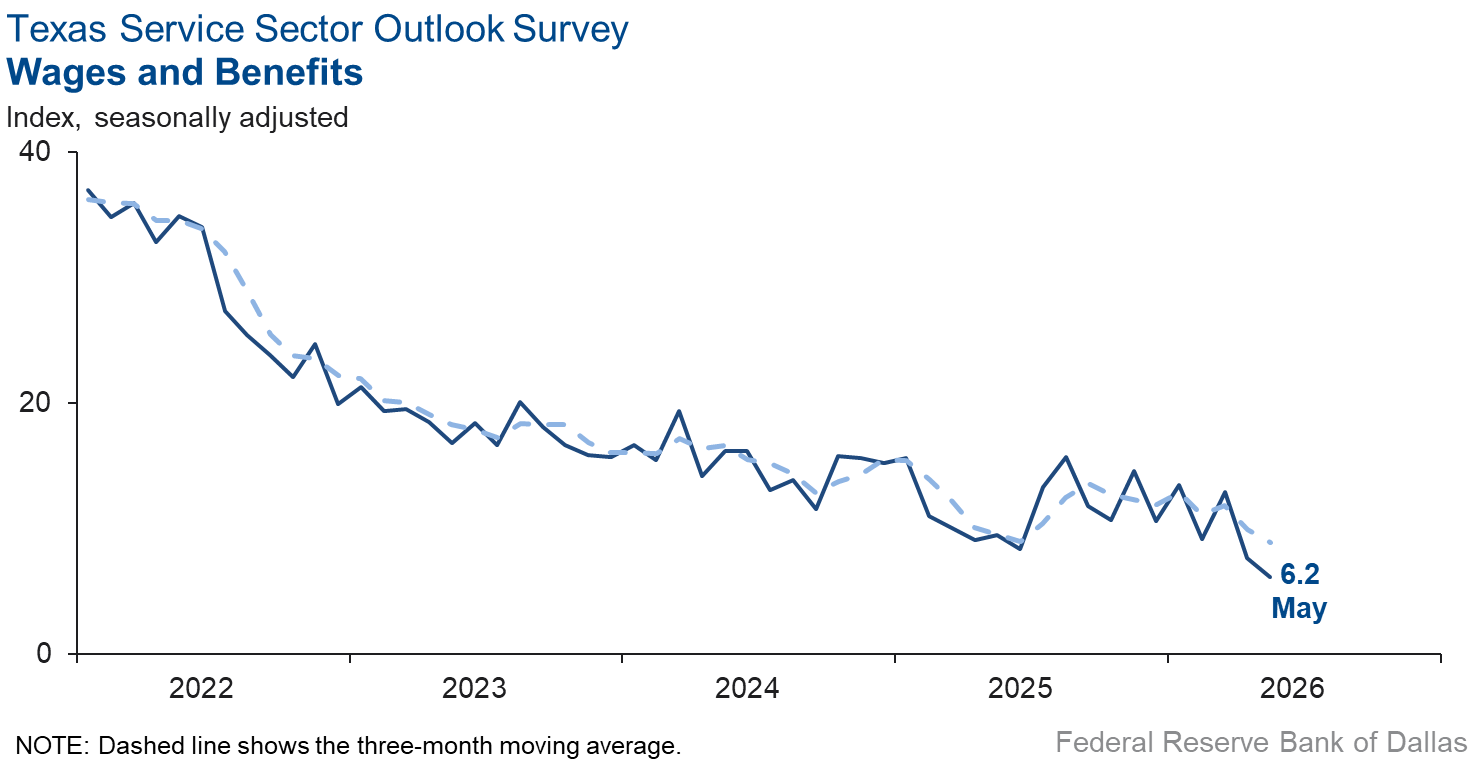
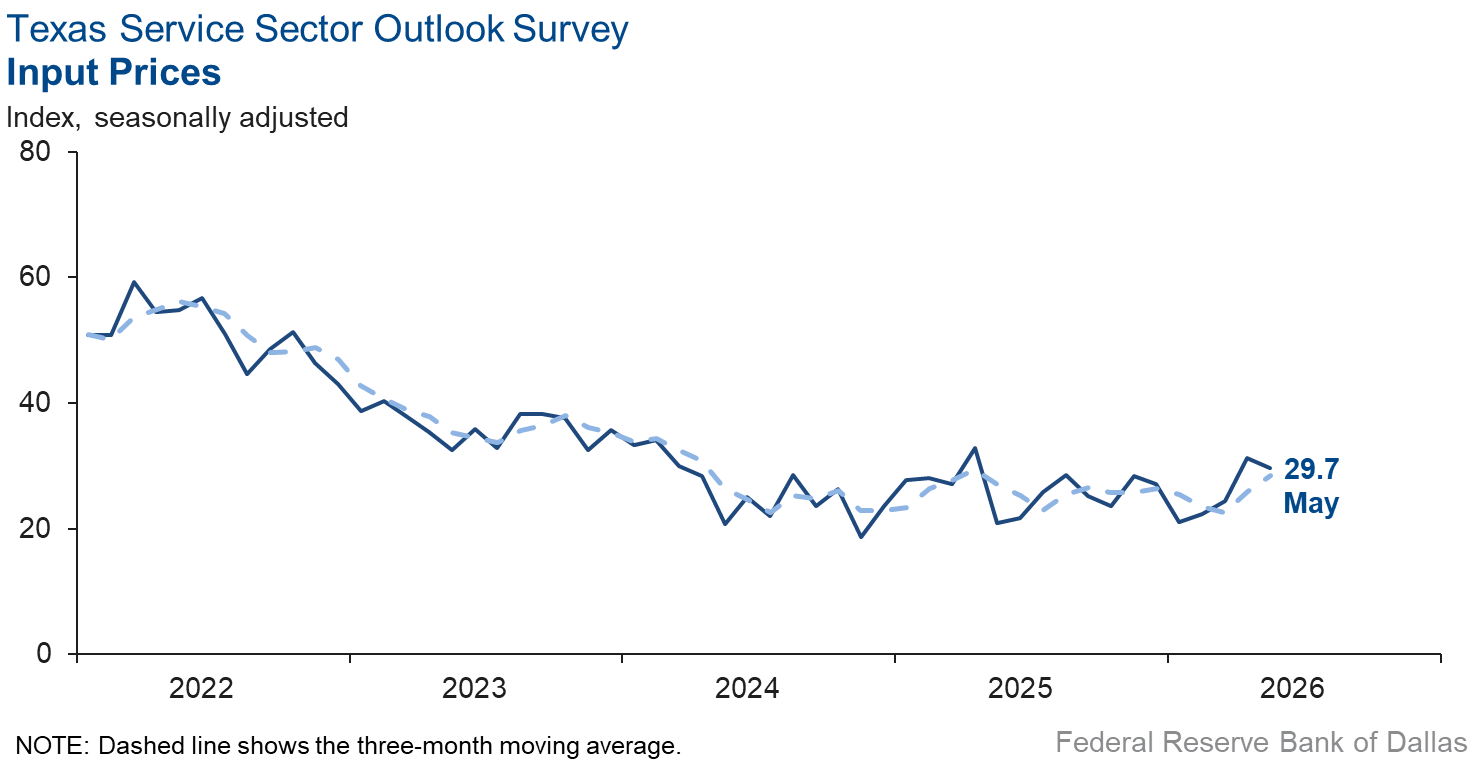
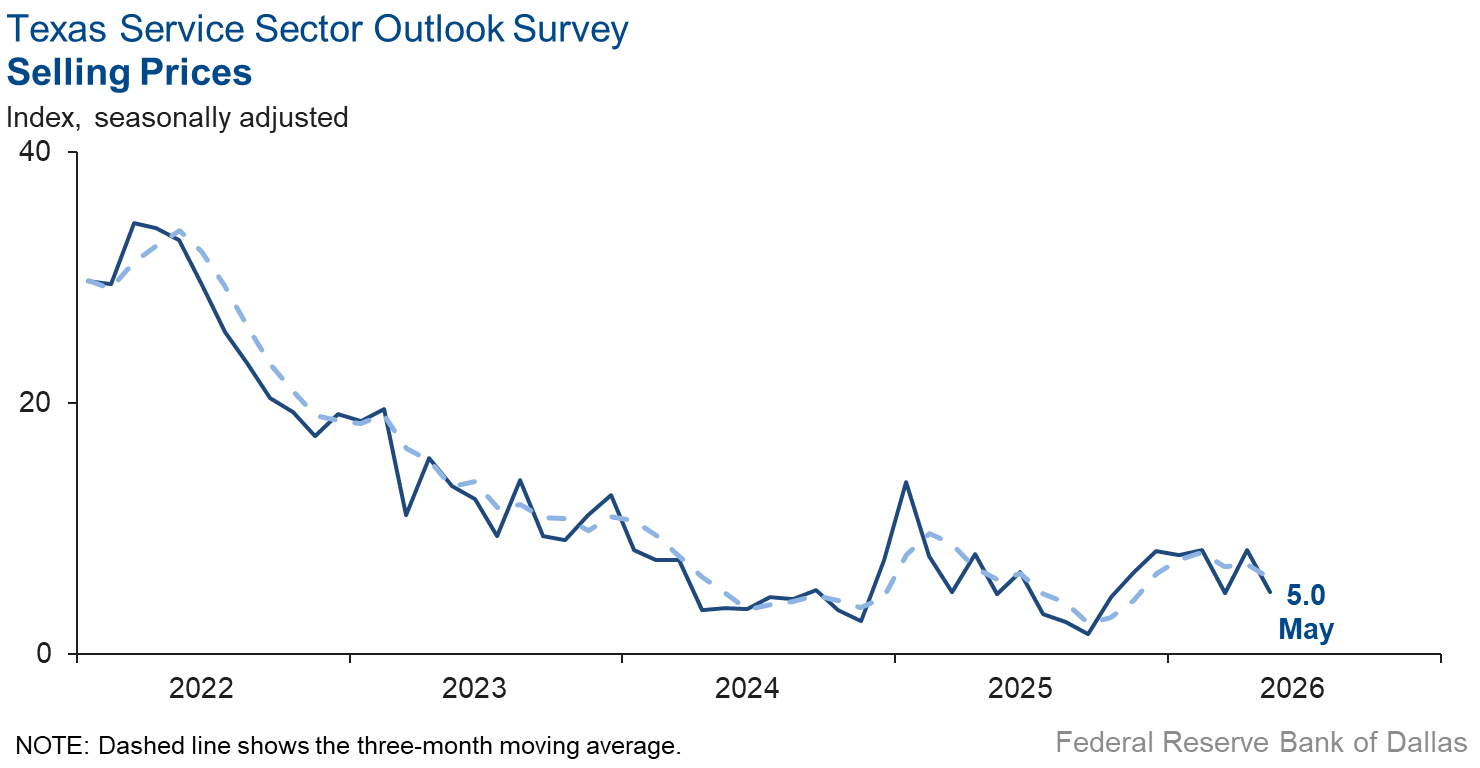
Selling price pressures eased slightly while input prices and wages rose at about the same pace as in April. The selling prices index dipped three points to 5.0. The input prices and wages indexes were both little changed, registering 29.7 and 6.2, respectively.
Respondents’ expectations regarding future service sector activity were mixed. The future revenue index ticked down three points but remained in solid positive territory at 28.9. However, the future general business activity index fell five points to a near zero reading. Other future service sector activity indexes, such as employment and capital expenditures, remained in positive territory.
Next release: June 30, 2026
Data were collected May 12–20, and 242 of the 350 Texas service sector business executives surveyed submitted responses. The Dallas Fed conducts the Texas Service Sector Outlook Survey monthly to obtain a timely assessment of the state’s service sector activity. Firms are asked whether revenue, employment, prices, general business activity and other indicators increased, decreased or remained unchanged over the previous month.
Survey responses are used to calculate an index for each indicator. Each index is calculated by subtracting the percentage of respondents reporting a decrease from the percentage reporting an increase. When the share of firms reporting an increase exceeds the share reporting a decrease, the index will be greater than zero, suggesting the indicator has increased over the prior month. If the share of firms reporting a decrease exceeds the share reporting an increase, the index will be below zero, suggesting the indicator has decreased over the prior month. An index will be zero when the number of firms reporting an increase is equal to the number of firms reporting a decrease.
Data have been seasonally adjusted as necessary.
Historical data are available from January 2007 to the most current release month.
| Business Indicators Relating to Facilities and Products in Texas Current (versus previous month) | ||||||||
| Indicator | May Index | Apr Index | Change | Series Average | Trend* | % Reporting Increase | % Reporting No Change | % Reporting Decrease |
Revenue | 5.0 | 4.3 | +0.7 | 10.0 | 5(+) | 23.5 | 58.0 | 18.5 |
Employment | –3.2 | –1.0 | –2.2 | 5.7 | 2(–) | 8.2 | 80.4 | 11.4 |
Part–Time Employment | 2.3 | 0.7 | +1.6 | 1.2 | 3(+) | 6.5 | 89.3 | 4.2 |
Hours Worked | –0.5 | –1.3 | +0.8 | 2.4 | 4(–) | 5.3 | 88.9 | 5.8 |
Wages and Benefits | 6.2 | 7.7 | –1.5 | 15.4 | 72(+) | 11.1 | 84.0 | 4.9 |
Input Prices | 29.7 | 31.2 | –1.5 | 27.7 | 73(+) | 33.2 | 63.3 | 3.5 |
Selling Prices | 5.0 | 8.3 | –3.3 | 7.4 | 70(+) | 13.4 | 78.2 | 8.4 |
Capital Expenditures | 6.4 | 6.2 | +0.2 | 9.7 | 70(+) | 12.5 | 81.4 | 6.1 |
| General Business Conditions Current (versus previous month) | ||||||||
| Indicator | May Index | Apr Index | Change | Series Average | Trend** | % Reporting Improved | % Reporting No Change | % Reporting Worsened |
Company Outlook | –5.4 | –5.0 | –0.4 | 3.8 | 4(–) | 12.1 | 70.4 | 17.5 |
General Business Activity | –7.7 | –9.9 | +2.2 | 1.7 | 4(–) | 12.1 | 68.1 | 19.8 |
| Indicator | May Index | Apr Index | Change | Series Average | Trend* | % Reporting Increase | % Reporting No Change | % Reporting Decrease |
Outlook Uncertainty | 14.0 | 24.8 | –10.8 | 14.1 | 60(+) | 25.4 | 63.3 | 11.4 |
| Business Indicators Relating to Facilities and Products in Texas Future (six months ahead) | ||||||||
| Indicator | May Index | Apr Index | Change | Series Average | Trend* | % Reporting Increase | % Reporting No Change | % Reporting Decrease |
Revenue | 28.9 | 31.5 | –2.6 | 37.2 | 73(+) | 43.3 | 42.4 | 14.4 |
Employment | 15.3 | 18.0 | –2.7 | 22.8 | 73(+) | 23.6 | 68.0 | 8.3 |
Part–Time Employment | 4.6 | 5.1 | –0.5 | 6.4 | 11(+) | 10.3 | 84.0 | 5.7 |
Hours Worked | 3.8 | 2.5 | +1.3 | 5.8 | 11(+) | 8.4 | 87.0 | 4.6 |
Wages and Benefits | 37.0 | 35.2 | +1.8 | 37.5 | 73(+) | 39.6 | 57.9 | 2.6 |
Input Prices | 45.9 | 46.9 | –1.0 | 44.2 | 233(+) | 49.7 | 46.5 | 3.8 |
Selling Prices | 22.0 | 29.8 | –7.8 | 24.4 | 73(+) | 30.4 | 61.2 | 8.4 |
Capital Expenditures | 16.7 | 16.5 | +0.2 | 22.4 | 72(+) | 24.9 | 66.9 | 8.2 |
| General Business Conditions Future (six months ahead) | ||||||||
| Indicator | May Index | Apr Index | Change | Series Average | Trend** | % Reporting Improved | % Reporting No Change | % Reporting Worsened |
Company Outlook | 0.6 | 6.8 | –6.2 | 15.2 | 13(+) | 20.0 | 60.6 | 19.4 |
General Business Activity | –0.7 | 4.7 | –5.4 | 11.8 | 1(–) | 21.5 | 56.3 | 22.2 |
*Shown is the number of consecutive months of expansion or contraction in the underlying indicator. Expansion is indicated by a positive index reading and denoted by a (+) in the table. Contraction is indicated by a negative index reading and denoted by a (–) in the table.
**Shown is the number of consecutive months of improvement or worsening in the underlying indicator. Improvement is indicated by a positive index reading and denoted by a (+) in the table. Worsening is indicated by a negative index reading and denoted by a (–) in the table.
Data have been seasonally adjusted as necessary.
Comments from survey respondents
Survey participants are given the opportunity to submit comments on current issues that may be affecting their businesses. Some comments have been edited for grammar and clarity.
- The war continues to weigh on people.
- The economy has been stable, but sentiment is unsteady. Economists and consumers are nervous about what will happen next and who it will impact. The good news is that it has been a wet spring, grass is green and beef and goat prices are at record highs.
- The confluence of multiple policy changes (reduced health care subsidies, new student loan caps, visa limitations and a reduction in federal grant funding), along with rising interest rates and inflation makes the higher education outlook extremely uncertain and challenging.
- Gas prices are too high and are affecting consumers in a major way. I would love to see the federal funds rate lowered a little as well. I teach economics to community college students and they are feeling the pinch of higher prices at the pump.
- This past Friday, all appliances built outside the U.S. have a 25 percent finished-product tariff added to their cost. This is a major disruption as customers have balked at the price increases and started to find [the products] cheaper elsewhere.
- Over the past 30 days, we have seen a surprising number of price increases from many of our suppliers, including green coffee, cups and bags. We are seeing fuel surcharges of 50 percent for coffee imported to New Jersey and 26 percent for Port of Houston. This is a material increase. We've also seen cost increases of over 10 percent for some required supplies, such as cups and bags and the like. So our concern is that input prices are far outpacing official inflation, and outpacing our pricing elasticity as well. Profitability has suffered in April and thus far in May. We've also seen some same-store decreases in traffic volume. Around 35 percent of our cafes have seen decreases of 2 percent to 6 percent, which is quite abnormal for our business. We tend to be very resilient, as our consumer is generally amongst the more affluent as our product is considered an affordable luxury. So in some instances we may be seeing a decrease in demand due to general consumer-spending declines. Time will provide a more complete picture.
- My view day-to-day is more pessimistic than ever in my 46 years in business. My costs continue to increase, outstripping my ability to increase my prices and then my margins flatten. I have little confidence this administration knows how to get us out of the Iran quagmire, or how to correct course on the economy.
- It seems that the Iran war has temporarily dampened some larger capital plans and spending.
- Discretionary income is still being pinched.
- Property and liability rates in business insurance are flattening and sometimes lowering, so that helps our business clients. We are aging in place so we will have some retirements in 2026.
- Commercial insurance rates are declining, but we are growing through adding additional customers. We are looking to take AI from a tool on people's desktops to a required step in workflows.
- As oil prices remain higher, it likely puts pressure on disposable income that could be spent eating out. At this point we are not seeing any decline in sales, however it may be masked by the summer season (Memorial Day to Labor Day) as we historically see a seasonal increase in sales. We continue to see shipping lines and trucking companies press for higher fuel surcharges. Because most of these were implemented in mid-to-late March and the price of oil has not materially decreased, we feel that some of these additional charges are piling on and we have strongly pushed back.
- Retail traffic has remained the same but sales per transaction have declined by 5 percent or more.
- The longer amount of time that gas prices stay elevated, the more we see genuine concern from customers and other business owners worried about how customer spending will tighten.
- The cost of fuel has created a hole in people’s pockets and has impacted [purchases of] non-essential items.
- High fuel prices continue to affect consumer spending among our less affluent customers. We believe a prolonged war will affect fuel prices and consumer goods more in the future.
- As the conflict with Iran continues and gas prices continue to increase, we will continue to see hesitancy from our customers to make purchases for leisure activities.
- Consumer confidence is down. Our product is optional.
- We have received a noticeable increase in job applications in May versus prior months.
- We have a large fleet of trucks. The increase in fuel prices is affecting our cost to deliver services to clients.
- Until we know about the geopolitical issues, we can't predict anything. Most of our customers are in a holding pattern as well.
- We've had a couple of employees leave. It’s going to make the next few months hard. We’re not really sure what is driving the turnover.
- For those in the government services industry, the true context is how well a reduced federal workforce can execute four quarters of procurement activity within the remaining three quarters.
- We are an architectural firm, and we are seeing project budget cuts and/or reductions in scope. Some projects in the design phase are in jeopardy of being abandoned or being delayed for one to two years. Lack of government funding in public projects and rising inflation are factors. Rising wages and benefits are causing stress for small companies.
- We are a management and executive search firm. We work with many different industries to help them find talent. Typically the positions we are asked to fill are accounting, finance, sales, go-to-market, client service and operations (can be pretty broad depending on the industry). Most of the first quarter was steady. We had a dip in April, but now we are as busy as ever. Lots of companies are looking to hire good talent and they can't find the right people by posting, since the right people are typically working.
- We (and our clients) are feeling inflation and government infrastructure spending has decreased, especially professional services to the Texas Department of Transportation (TxDOT), causing smaller companies to wind-down and close, and others to lay off professional staff.
- Uncertainty continues to be the [main] issue. Projects are not in the queue as energy investors and companies don't have any idea where we are headed.
- We are currently exploring raising our prices to hopefully increase wages to combat the rising cost of living. But we are also concerned that with the rise in cost of living, less people will be able to afford our services.
- Sales and profits are rising worldwide for us to make the 2026 fiscal year one of the strongest in the recent three years. Our biggest customers are buying a lot. In the President’s remaining term years, we expect strong growth due to the AI boom and the President’s successful economic policies.
- Uncertainty about memory pricing and availability continues to be a big issue.
- Our outlook for commercial and residential real estate differs significantly. Commercial real estate has not been materially affected by the Iran crisis. Operating revenue for commercial is up approximately 25 percent year over year. Residential real estate remains slow, with revenue down approximately 4 percent year over year. We do not expect this trend to change until the Iran crisis is resolved and there is greater clarity around the true direction of inflation.
- The recent increase in revenue was due to a high compliance tax period, rather than a general recovery of the economy. In fact, my client's financial reports show a general decrease in revenue.
- The war in Iran has a lot of consequences, mainly raw material price increases. Uncertainty is becoming the norm. It’s very hard to plan ahead.
- Great uncertainty remains paramount. There is some pessimism creeping into the energy markets as the Iranian conflict persists and global ramifications ratchet upwards.
- Uncertainty has become the new certainty. Everyone puts such a premium on reacting as quickly as possible that we get wild swings in prices and activities when they really aren't necessary.
- There continues to be uncertainty around government opportunities. It is unclear if final government funds will be released and what the timing will be. Activity is high, so we’re hoping for a decent-to-good batting average this year.
- Deal flow has slowed considerably. It is taking a lot longer to close with extensive add-ons for thorough due diligence. Market research and data updates are becoming exhaustive. There are concerns from clients about the reliability of government data, especially on jobs, inflation and unemployment.
- The prolonged war in Iran has impacted energy trade in a meaningful way and the cost of energy is showing up stateside. Inflation is proving to be sticky and systemic and will cause operational cost increases and will affect everything in real estate and will slow growth. This will weaken consumer demand for real estate services in the near term. Ongoing geopolitical uncertainty continues to dampen private capital equity markets and will also put a drag on real estate service line revenues.
- Rising mortgage rates are an increasing headwind. War in Iran is an increasing headwind from rising gas prices and the negative effect on consumer confidence.
- Employees are feeling squeezed and are starting to make noise about needing raises. They are very loyal and we love them, but we don't have extra money to give them. Even though we remain optimistic about our long-term prospects, profits are being squeezed right now.
- Airfares are a significant factor in our increased costs.
- Customers are more reserved in spending and showing caution for future spending beyond the basics.
- The market is stalled with the Iran war’s impact to oil and gas mergers and acquisitions due to higher oil prices which have heightened buy-sell spread in lower middle markets transactions. Natural gas transactions are driven by liquid natural gas (LNG) and data center regional trends, but are largely focused in joint ventures and other arrangements that are not engaging advisors.
- The lack of moisture is putting a damper on all business attitudes and directly hurting cattle and farming. Data centers are boosting employment and motel occupancy.
- [I have] growing concern related to inflation and the risk of a recession.
- The war in Iran and its impact on inflation and perceived future inflation has caused interest rates to increase, which is negative for the commercial real estate industry. The cost of tenant finish-out improvements for new and renewing tenants has increased, but rental rates have flattened out after having previously increased, particularly in the industrial flex market. Insurance costs and utility costs are still a big issue. We just renewed our electric utility contract that matured after the five-year term expired. We signed a new four-year contract, but the rate was 25 percent higher than the former contract.
- The war in Iran along with elevated gas prices is disrupting long term corporate decision making. With our clients, it is delaying growth and hiring plans.
- We are starting to see an upswing in general activity from the business brokerage side. Markets are becoming accustomed to the new normals: inflation, Middle East activity, politics, etc.
- Each year the summer is our busier season and our business picks up. It then drops off in September.
- Global uncertainties continue to impact long-term strategies and decisions.
- The Iran war is definitely changing things. Inflation is causing problems.
- I think the higher inflation numbers released this week, while not a surprise, certainly gives an indication that higher fuel prices may permeate all sectors of the economy in the coming months, making costs to provide our services higher across the board. I will be watching closely to see how this could kick off a new period of higher prices for all input goods.
Special questions
For this month’s survey, Texas business executives were asked supplemental questions on artificial intelligence (AI). Results below include responses from participants from both the Texas Manufacturing Outlook Survey and Texas Service Sector Outlook Survey. View individual survey results.
Historical Data
Historical data can be downloaded dating back to January 2007.
Indexes
Download indexes for all indicators. For the definitions of all variables, see data definitions.
| Unadjusted |
| Seasonally adjusted |
All Data
Download indexes and components of the indexes (percentage of respondents reporting increase, decrease, or no change). For the definitions of all variables, see data definitions.
| Unadjusted |
| Seasonally adjusted |
Questions regarding the Texas Service Sector Outlook Survey can be addressed to Isabel Brizuela.
Sign up for our email alert to be automatically notified as soon as the latest Texas Service Sector Outlook Survey is released on the web.