Texas Service Sector Outlook Survey


Growth in Texas service sector activity moderates
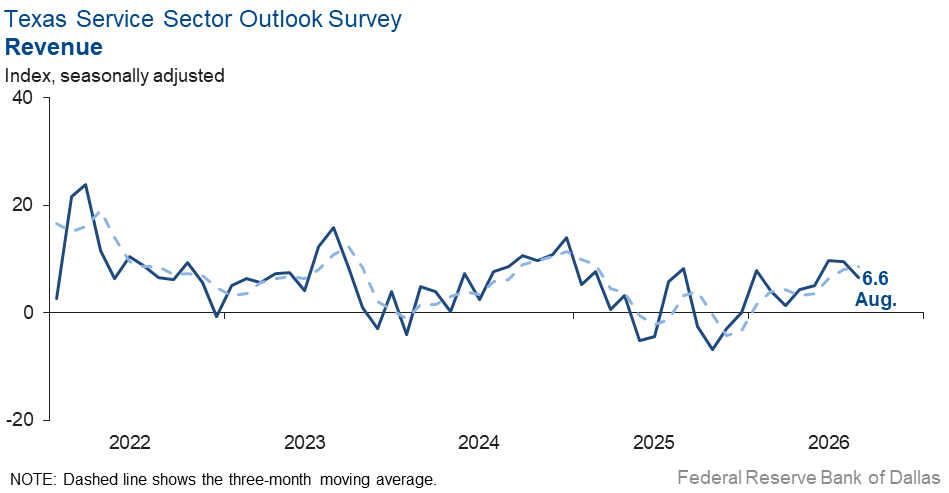
Texas service sector activity expanded in August, according to business executives responding to the Texas Service Sector Outlook Survey. The revenue index, a key measure of state service sector conditions, ticked down three points to 6.6.
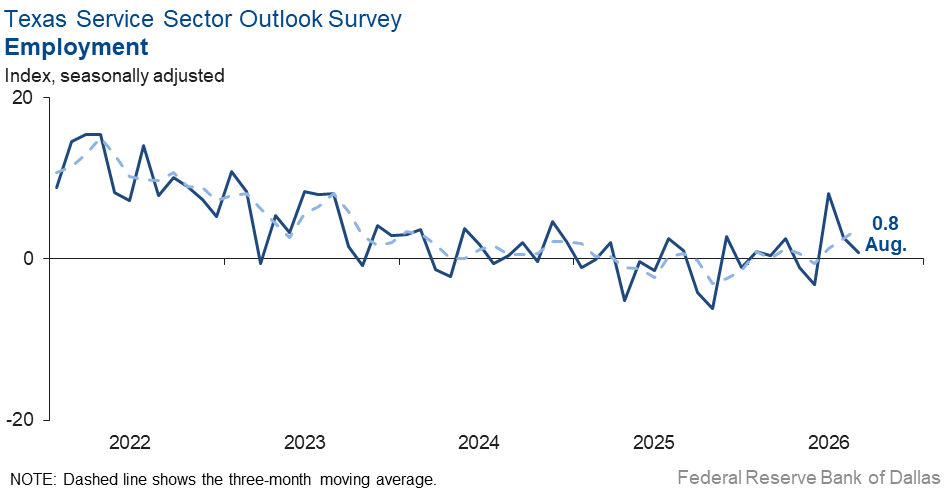
Labor market measures suggested no growth in employment, while workweeks increased at a similar pace as in July. The employment index dipped two points to a near zero reading, while the hours worked index was relatively unchanged at 5.7.
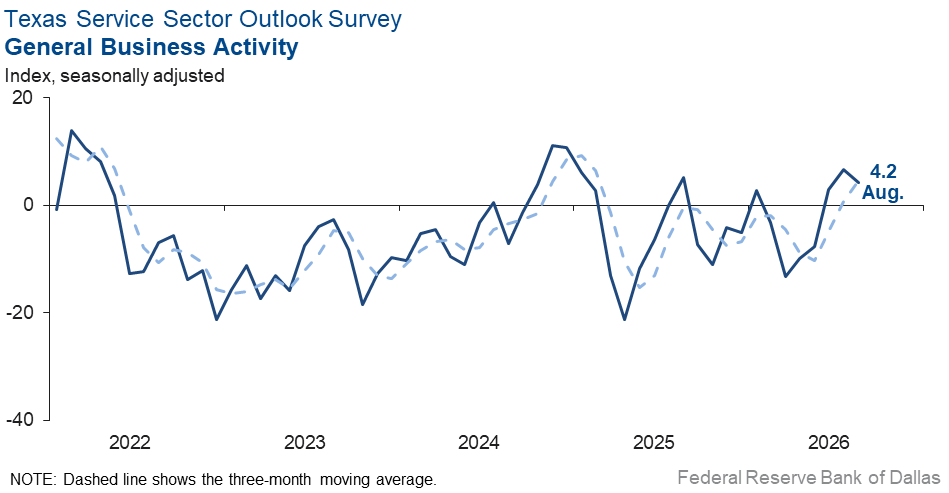
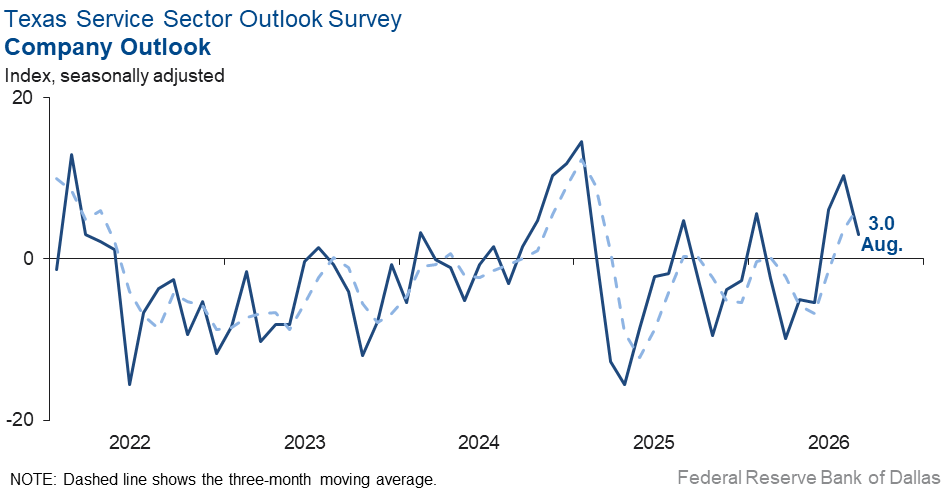
Perceptions of broader business conditions continued to improve in August, but optimism waned somewhat. The general business activity index edged down two points but remained in positive territory at 4.2. The company outlook index fell to 3.0 from 10.4. Meanwhile, the outlook uncertainty index was little changed at 12.9.
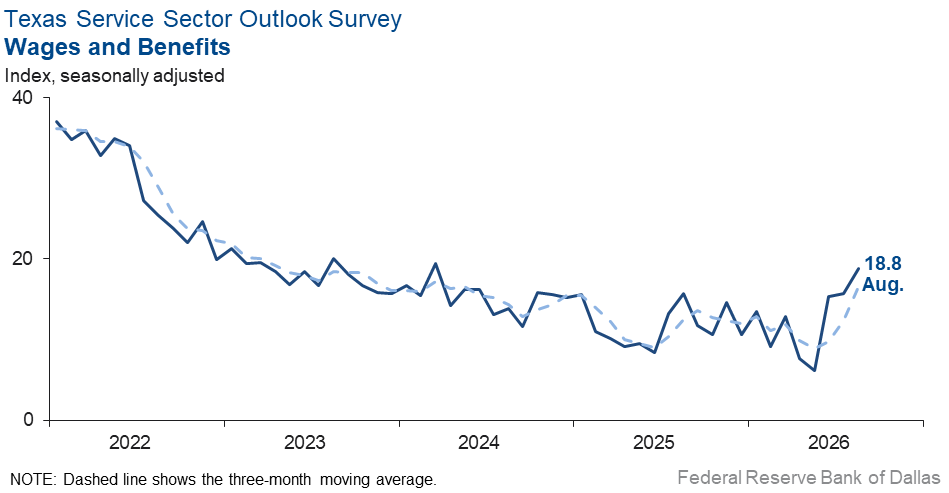
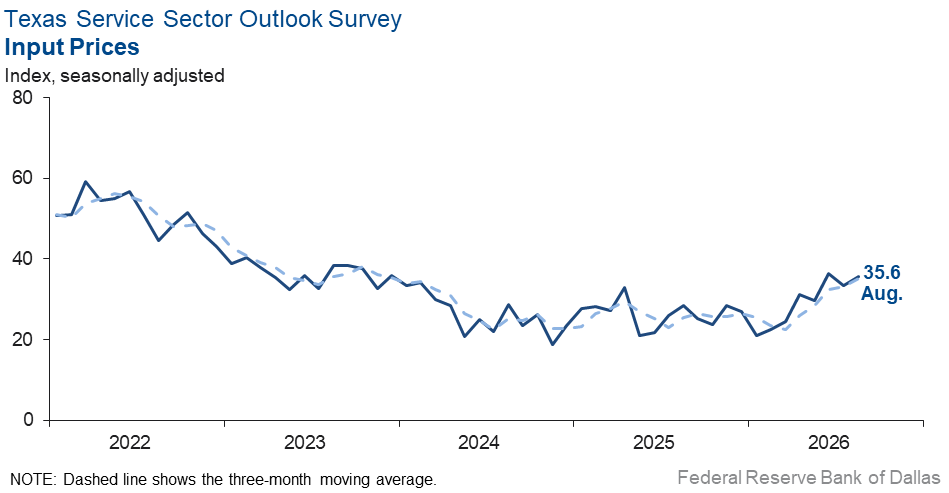
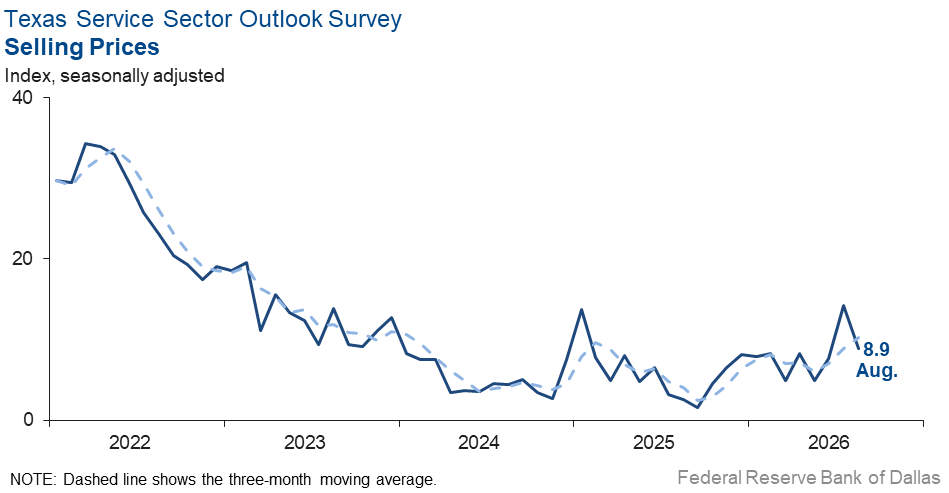
Input price pressures increased slightly, while selling prices rose at a slower pace than the previous month. The input prices index ticked up two points to 35.6, while the selling prices index fell five points to 8.9. The wages and benefits edged up three points to 18.8, a level that exceeds the series average of 15.4.
Respondents’ expectations regarding future business activity reflected continued optimism in August. The future revenue index rose slightly to 35.9 from 32.6, while the future general business activity index ticked up two points to 18.6. Other future service sector activity indexes, such as employment and capital expenditures, remained in solidly positive territory.
Next release: Sept. 29, 2026
Data were collected August 18–26, and 236 of the 340 Texas service sector business executives surveyed submitted responses. The Dallas Fed conducts the Texas Service Sector Outlook Survey monthly to obtain a timely assessment of the state’s service sector activity. Firms are asked whether revenue, employment, prices, general business activity and other indicators increased, decreased or remained unchanged over the previous month.
Survey responses are used to calculate an index for each indicator. Each index is calculated by subtracting the percentage of respondents reporting a decrease from the percentage reporting an increase. When the share of firms reporting an increase exceeds the share reporting a decrease, the index will be greater than zero, suggesting the indicator has increased over the prior month. If the share of firms reporting a decrease exceeds the share reporting an increase, the index will be below zero, suggesting the indicator has decreased over the prior month. An index will be zero when the number of firms reporting an increase is equal to the number of firms reporting a decrease.
Data have been seasonally adjusted as necessary.
Historical data are available from January 2007 to the most current release month.
| Business Indicators Relating to Facilities and Products in Texas Current (versus previous month) | ||||||||
| Indicator | Aug Index | Jul Index | Change | Series Average | Trend* | % Reporting Increase | % Reporting No Change | % Reporting Decrease |
Revenue | 6.6 | 9.5 | –2.9 | 9.9 | 8(+) | 25.9 | 54.8 | 19.3 |
Employment | 0.8 | 2.6 | –1.8 | 5.7 | 3(+) | 11.3 | 78.2 | 10.5 |
Part–Time Employment | –1.8 | –0.1 | –1.7 | 1.2 | 2(–) | 4.3 | 89.6 | 6.1 |
Hours Worked | 5.7 | 4.9 | +0.8 | 2.4 | 3(+) | 11.3 | 83.1 | 5.6 |
Wages and Benefits | 18.8 | 15.7 | +3.1 | 15.4 | 75(+) | 20.5 | 77.8 | 1.7 |
Input Prices | 35.6 | 33.5 | +2.1 | 27.8 | 76(+) | 37.8 | 60.0 | 2.2 |
Selling Prices | 8.9 | 14.2 | –5.3 | 7.5 | 73(+) | 15.3 | 78.3 | 6.4 |
Capital Expenditures | 6.0 | 11.5 | –5.5 | 9.6 | 73(+) | 11.9 | 82.2 | 5.9 |
| General Business Conditions Current (versus previous month) | ||||||||
| Indicator | Aug Index | Jul Index | Change | Series Average | Trend** | % Reporting Improved | % Reporting No Change | % Reporting Worsened |
Company Outlook | 3.0 | 10.4 | –7.4 | 3.8 | 3(+) | 21.5 | 60.0 | 18.5 |
General Business Activity | 4.2 | 6.6 | –2.4 | 1.8 | 3(+) | 23.0 | 58.2 | 18.8 |
| Indicator | Aug Index | Jul Index | Change | Series Average | Trend* | % Reporting Increase | % Reporting No Change | % Reporting Decrease |
Outlook Uncertainty | 12.9 | 12.7 | +0.2 | 14.0 | 63(+) | 24.0 | 64.8 | 11.1 |
| Business Indicators Relating to Facilities and Products in Texas Future (six months ahead) | ||||||||
| Indicator | Aug Index | Jul Index | Change | Series Average | Trend* | % Reporting Increase | % Reporting No Change | % Reporting Decrease |
Revenue | 35.9 | 32.6 | +3.3 | 37.1 | 76(+) | 48.8 | 38.3 | 12.9 |
Employment | 19.1 | 22.4 | –3.3 | 22.8 | 76(+) | 28.0 | 63.1 | 8.9 |
Part–Time Employment | 6.5 | 4.0 | +2.5 | 6.4 | 2(+) | 9.7 | 87.1 | 3.2 |
Hours Worked | 5.7 | 4.2 | +1.5 | 5.8 | 14(+) | 10.8 | 84.1 | 5.1 |
Wages and Benefits | 41.0 | 42.7 | –1.7 | 37.5 | 76(+) | 42.7 | 55.6 | 1.7 |
Input Prices | 48.1 | 47.3 | +0.8 | 44.3 | 236(+) | 50.3 | 47.5 | 2.2 |
Selling Prices | 27.6 | 25.2 | +2.4 | 24.5 | 76(+) | 33.9 | 59.8 | 6.3 |
Capital Expenditures | 20.4 | 23.9 | –3.5 | 22.3 | 75(+) | 26.2 | 68.0 | 5.8 |
| General Business Conditions Future (six months ahead) | ||||||||
| Indicator | Aug Index | Jul Index | Change | Series Average | Trend** | % Reporting Improved | % Reporting No Change | % Reporting Worsened |
Company Outlook | 19.1 | 21.0 | –1.9 | 15.3 | 16(+) | 35.2 | 48.8 | 16.1 |
General Business Activity | 18.6 | 16.8 | +1.8 | 11.8 | 3(+) | 35.2 | 48.2 | 16.6 |
*Shown is the number of consecutive months of expansion or contraction in the underlying indicator. Expansion is indicated by a positive index reading and denoted by a (+) in the table. Contraction is indicated by a negative index reading and denoted by a (–) in the table.
**Shown is the number of consecutive months of improvement or worsening in the underlying indicator. Improvement is indicated by a positive index reading and denoted by a (+) in the table. Worsening is indicated by a negative index reading and denoted by a (–) in the table.
Data have been seasonally adjusted as necessary.
Comments from survey respondents
Survey participants are given the opportunity to submit comments on current issues that may be affecting their businesses. Some comments have been edited for grammar and clarity.
- High inflation and international unrest are hitting middle-class consumers in the pocketbook, impacting travel for those not in the high-income or luxury sector. This has an outsized impact on a market like San Antonio vs. Houston, Austin, Dallas-Fort Worth.
- Increased demand for executive search and direct hires started in May, and finally the roles we have been working on are closing and starting work in August. This has been a year of dramatic swings in revenue, months with $30,000 and months with $230,000. Those are real numbers. It is very challenging to forecast demand and revenue. Overall, the number of jobs we’re receiving is going up while the time to fill is also getting longer. Clients hiring are very specific about their requirements and waiting until the right person is found. Candidates are reluctant to change jobs, and the number of available professionals for senior-level roles is shrinking. Grateful to be busy again but also praying it sticks and the economy survives the war in Iran and inflation.
- I’m concerned about the size of the deficit.
- The increase in Treasury bond yields is very worrisome for the long-term outlook of the economy. Washington needs to address its fiscal deficit ASAP.
- There has been a slowdown. We won’t realize it until the first quarter of 2027.
- Two main factors affecting our business are macroeconomic (tariffs affecting costs, and general economic slowdown, increased unemployment/uninsured rate, etc.) and uncertainty around the epidemiology of flu, COVID-19 and RSV, which tend to drive patient volume growth, especially during respiratory season.
- The uniform wear market is soft. We are experiencing threats from brands competing in the marketplace as well as uncertain city, state and federal budgets. The only way to survive is to add value where we can when serving the end-user.
- Stablecoin legislation is creating concern for the future of deposit retention in community banks. The interest rate environment is becoming more complicated to predict with economic uncertainty. Geopolitical events continue to be of concern, as well as the impact they will continue to have on the economy.
- Economic uncertainty, inflationary pressures and workforce shortages continue to affect our business operations. Higher costs for goods and services, combined with difficulties in hiring and retaining skilled employees, has put pressure on growth and profitability. Despite these challenges, we are focused on improving efficiency and continuing to meet customer needs.
- People in store count a 24 percent reduction in sales from last year.
- With food [costs] rising and fuel prices fluctuating, customers seem to be holding off on spending.
- There is a general slowdown in retail activity based on economic uncertainty.
- Input costs continue to increase, especially in the protein market.
- The economy is sluggish, with not a lot of disposable income for eating out.
- We have noticed a 5 percent decrease in customer spending even though the number of customers has stayed the same.
- Pharmacy Benefit Manager (PBM) prescription payment plans continue to impair pharmacies from providing quality pharmaceutical services to the patients they serve.
- Business activity and company outlook remains guarded due to economic uncertainty, largely related to oil and gas prices and the related impacts from the ongoing struggles abroad as well as ongoing trade wars, the Strait of Hormuz closure and [elevated] fertilizer costs.
- Oil and diesel costs are still a major concern and contributing to higher transportation costs.
- Lack of affordability of my products is costing me business and pressuring gross profit margins.
- The retail business seems to have improved across all manufacturers.
- We sell propane, gasoline and diesel, so price volatility caused by geopolitical uncertainty is something that we watch, as do our customers.
- I think that my general business activity is more positive because I am personally doing more about it. I am hosting events, contacting my vendors for help with giveaways, planning fall events to keep people positive and happy.
- Crude oil price volatility has continued, and confidence in U.S. producing basins is increasing.
- Uncertainty is still there, just that we have become used to it. It doesn’t help the decisions to go forward on large projects.
- Our team has put a lot more focus on business development, which has helped us increase our revenue forecast. But the rising costs of fuel and visitor tax increases for lodging continue to threaten our ability to offer quality services without increasing our prices.
- The increase in the company’s activity is primarily due to an anticipated and previously planned expansion project by one of our major existing clients. While this expansion is expected to generate additional business, it does not represent the acquisition of a new client. Therefore, uncertainty regarding broader business growth and market conditions continues to increase.
- We experienced a softening in July attributable to summer vacations of both our clients and our employees. That reverses late August when kids go back to school. Our response for August versus July does not signal a change in the economy; it shows a typical summer lull in the engineering consulting business.
- Fuel prices keep affecting our costs because of our vehicle fleet.
- The poor outlook for state and local governments across the board related to budgets and ability to maintain and finance public infrastructure is detrimental to our industry.
- The introduction of Grok Bot is an absolute game-changer for our company and industry. It is hard to imagine the ultimate impact to the economy from this advancement. This will make our team an order of magnitude more productive and will probably reduce the need for specialized labor and subcontractors enormously.
- We are introducing a new line of service to old and new clients that is more profitable with less work.
- Contract spending remains steady, but we are seeing erosion in optional services and ancillary spending.
- We have a couple of large projects about to start. I think that this is just normal business fluctuation. I’m not seeing any real change in the overall economy.
- Until we have more clarity on inflation, interest rates, government borrowing and the geopolitical situation, it is very difficult to confidently predict where the real estate market is headed.
- Awareness of existing global, systematic uncertainty has risen healthily.
- Continued high interest rates and job uncertainty because of AI are issues. It is definitely more of a buyer’s market.
- Rising interest rates are going to have an impact. If not immediately, then over the next 12 months they will impact the level of business activity.
- I have to admit that as painful as interest rates, inflation and the immigration crackdown have been for our company, the apartments we manage and our community, they have at least contributed meaningfully to rent reductions and property value rationalization. Occupancy has shrunk in workforce housing because people are doubling up more due to economic pressures and because immigrants are disappearing. Owners that can afford to lower rents to compensate are doing so. Those constrained by excessive leverage are hanging on by a thread and are steadily throwing in the towel. Lenders are doing what they can to avoid taking on REO (real estate owned) since they too are often underwater. We expect all this to flush through the system over the next year or two as owners take their losses (as we saw after the savings and loan crisis and Great Recession). Professional investors are ready to pick up properties for what they are really worth once the bandage is ripped off, make them attractive again and repeat the cycle, hopefully smarter and better. Cheap rent often means lower quality now, but as the cycle turns, we’ll go back to competing on value, and everyone should win.
- Continued chaos and on-again, off-again tariff policy is creating a great deal of uncertainty in our manufacturing community. It is impacting reshoring and relocation and expansion decisions. It also creates supply chain problems and bottlenecks. Similar policy uncertainty with Iran is causing oil prices to spike, which increases input costs for plastics and transportation costs across the industry. The latest tariff war with Canada will only worsen the impact on our industry.
- Data center activity is off the charts. This is driving labor costs through the roof, steel prices through the roof, you name it. If you happen to be in the construction sector, which we are, there are some benefits. Finding skilled labor is getting nearly impossible in rural areas where some of these data centers are being built.
- It is a tough market to make microeconomic decisions with how volatile and uncertain the macro environment is on a daily basis. We need stability.
- If it is not a data center, it does not exist.
- Uncertainty is the new reality. Entrepreneurs will adjust.
- Business has picked up, and things are starting to improve.
- Data centers are by far the largest influence on my six-month [Texas Service Sector Outlook Survey] answers seeing an "increase" compared to now.
- We are assessing any impacts of the governor’s [directive] for an audit of all large-loads of megawatt data center projects to our revenue projections.
- The war in Iran continues to create pricing pressures, which change on a daily basis.
- I think we’re now a little more bullish on the outlook going into 2027. Inflation seems to be holding steady, even if higher than preferred. And we think demand for U.S.-produced energy will remain extremely high, even after the conflict in Iran subsides.
Special questions
For this month’s survey, Texas business executives were asked supplemental questions on demand and margins. Results below include responses from participants from both the Texas Manufacturing Outlook Survey and Texas Service Sector Outlook Survey. View individual survey results.
Historical Data
Historical data can be downloaded dating back to January 2007.
Indexes
Download indexes for all indicators. For the definitions of all variables, see data definitions.
| Unadjusted |
| Seasonally adjusted |
All Data
Download indexes and components of the indexes (percentage of respondents reporting increase, decrease, or no change). For the definitions of all variables, see data definitions.
| Unadjusted |
| Seasonally adjusted |
Questions regarding the Texas Service Sector Outlook Survey can be addressed to Isabel Brizuela.
Sign up for our email alert to be automatically notified as soon as the latest Texas Service Sector Outlook Survey is released on the web.