
Once-oil-dependent Texas economy to keep growing as renewable energy expands
The energy industry is confronting a quickly evolving transition to renewable resources from CO2-emitting fossil fuels. Reducing such emissions is important because CO2 is a greenhouse gas that traps heat in Earth’s atmosphere. The burning of fossil fuels contributed substantially to a 40 percent net increase in atmospheric CO2 from 1750 to 2011.[1]
The “greening” of the U.S. and its electrical grid has accelerated with the increased use of solar and wind power—a trend that could profoundly change Texas and its powerful oil and gas sector.[2] Despite its deep ties to the oil and gas industry, the state is increasingly turning to wind—and more recently, solar—for power production.[3].
The historically prominent Texas energy industry is at a crossroads—and not for the first time. From the early 1980s to the early 2000s, the Texas oil and gas sector experienced a steady decline in production. Yet the state economy continued to outperform the nation.
This experience suggests that the relative strength of the Texas economy could persist in coming decades even if the upstream oil and gas sector experiences a long-term decline due to the energy transition.
Oil and Gas Prominence
The oil and gas sector has historically been a pillar of the Texas economy. With the first discoveries of major deposits—notably, Spindletop near Beaumont in 1901—the oil industry rapidly expanded. By the 1940s, Texas was the largest oil-producing state in the U.S. and among the largest oil-producing regions in the world. (If Texas were a country, its current oil production would rank fourth globally, behind the U.S., Russia and Saudi Arabia and ahead of Mexico and Canada.)
In the early 1980s, the oil and gas industry directly accounted for more than 15 percent of state gross domestic product (GDP) and nearly 5 percent of state employment (Chart 1). A national recession in 1981 and the oil-price collapse in 1986 diminished state oil and gas production and employment, setting in motion a decades-long decline in both.
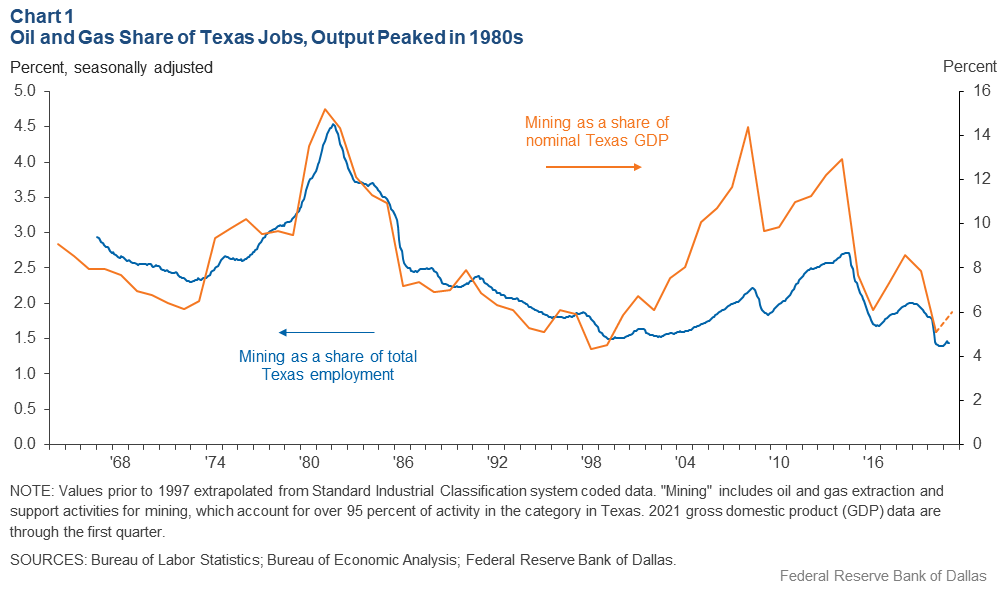
The sector’s relative prominence steadily slipped during the 1990s as fewer new oil deposits were found and the largest oil fields were in long-term decline. Increasingly, the industry turned to stripper wells, which produce 10 or fewer barrels of oil per day and operate at a cost disadvantage relative to global competitors.
Oil imports began to substitute for declining Texas production. The fall coincided with a shift in activity to the downstream sector. Billions of dollars in refining capacity and petrochemical manufacturing infrastructure grew along the Gulf Coast.
The shale boom in the mid-2000s reversed this production trend. Beginning with the Barnett Shale formation in North Central Texas, the new technologies and methods of hydraulic fracking and horizontal drilling reinvigorated the sector, extracting oil and gas from tight rock formations at a time of rising oil prices.
This oil and gas resurgence became most evident in the Permian Basin of West Texas and eastern New Mexico, where the sector had traditionally operated, and in new drilling areas in the Eagle Ford formation in South Texas.[4]
Texas Economic Impact
Historically, swings in the energy sector have materially affected the state’s economy, with sudden, sharp declines depressing broader activity. Texas employment growth fell below its long-term average and weakened to below the U.S. rate as oil prices abruptly declined in 1986, the late 1990s and during the shale oil bust of 2015–16 (Chart 2).
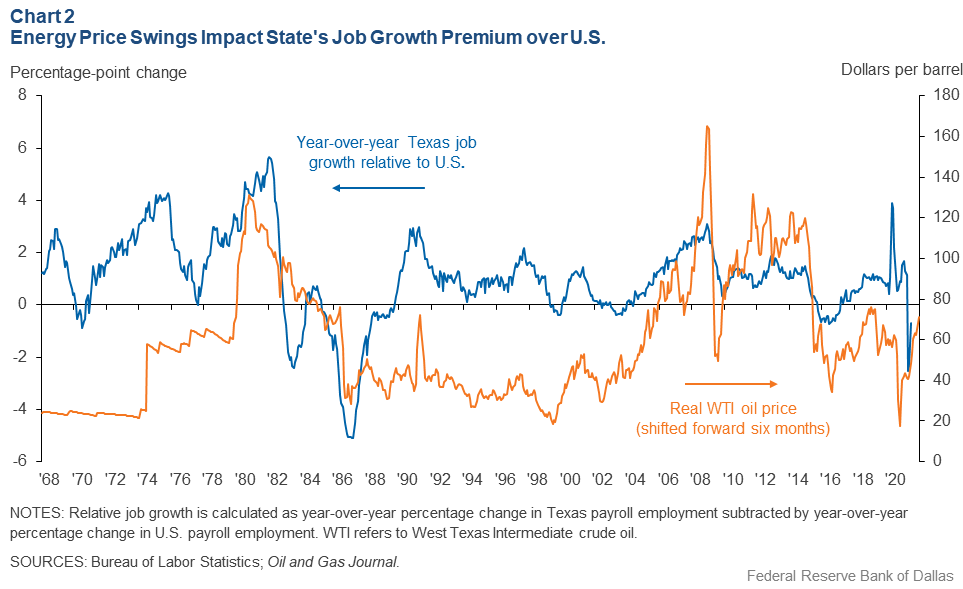
While the large oil price swings clearly affected the Texas economy in the short term, the effect of the longer-term sectoral decline from the early 1980s to the mid-2000s was more muted.[5] For example, during the 1990s, despite oil and gas sectoral weakness, the state’s economic growth continued to outpace the nation’s.
At that time, the share of economic output and employment attributable to oil and gas fell to the lowest levels on record going back to the 1960s, even as Texas experienced nearly 3 percent annual job growth and 4.7 percent annual GDP growth. By comparison, U.S. employment increased 1.8 percent and GDP expanded 3.3 percent, representing a slightly higher growth premium for Texas than the long-term average.
Texas Growth Sectors
The nation underwent a surge in output and productivity due to the tech boom beginning in the 1990s, with tech activity in Texas increasing more than in many other states. Even as fracking took hold, cresting in 2014, the oil and gas sector’s share of the state economy remained below its peak of the early 1980s.
Diversification of the overall Texas economy, including expansion into downstream energy operations such as petrochemicals and refining, has been pivotal. While gasoline and diesel account for a majority of current global oil demand, a growing share is due to petrochemical feed stocks such as ethane, naphtha and liquefied petroleum gas.
Petrochemicals are expected to account for one-third of the nearly 10 million barrel-per-day increase in oil demand during the next 10 years.[6] This should disproportionately benefit downstream activity along the Texas Gulf Coast even as oil and gas production’s impact becomes less prominent.
Most recently, in 2015–16—when oil prices declined over 70 percent from their 2014 peak—diversification, particularly from the growth of petrochemicals and refining, helped Texas’ employment grow even though its rate slipped below that of the U.S.[7] Low prices for natural gas, used in the manufacture of petrochemicals, provided a global competitive advantage for their production. Today, the state accounts for nearly one-third of total U.S. refining capacity and three-quarters of petrochemical output.
Professional, scientific and technical services employment has also grown. The share of jobs in this sector, which includes IT services such as computer systems design and computer programming as well as legal and accounting services, increased from under 4 percent in 1990 to 6.5 percent in 2019.
Calculating State Changes
It’s possible to quantify the evolution of industry diversification and how Texas differs from the nation.
The measure is calculated as 1 minus the squared sum of the absolute differences in job shares across 20 broad industry classifications—representing industries categorized with two-digit North American Industry Classification System codes.
If a region has the exact same job shares as the nation, the value of the measure is 1. If most of a region’s jobs are in one or two key industries, the value will be closer to zero. This measure is depicted in Chart 3, where the differential between Texas and the U.S. average narrowed from the mid-1980s to the mid-2000s and then widened following the fracking boom and energy sector resurgence.
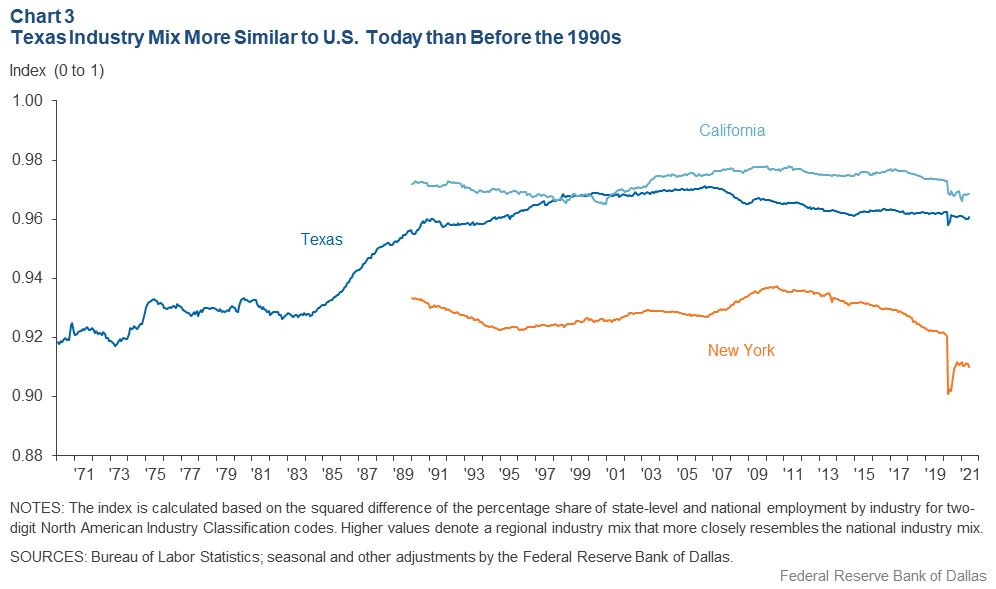
By this measure, the industry structure in Texas remains much more diversified than it was in the early 1980s, when the energy sector began its first major long-term decline. By comparison, California is more diversified than Texas, while New York is less so, primarily due to a low share of manufacturing employment and the high share of jobs in private education and health services industries in recent years.
Energy Sector Redefined
While the oil and gas share of employment and output may decline in Texas over the next several decades, the renewable energy sector is likely to grow significantly. This is not a recent phenomenon in Texas, although only in recent years have renewables grown into meaningful contributors to total power production.
Total electricity generation from renewable sources—primarily wind—has risen fourfold during the past 10 years, with its share of total power production increasing from 8 percent to 25 percent (Chart 4).
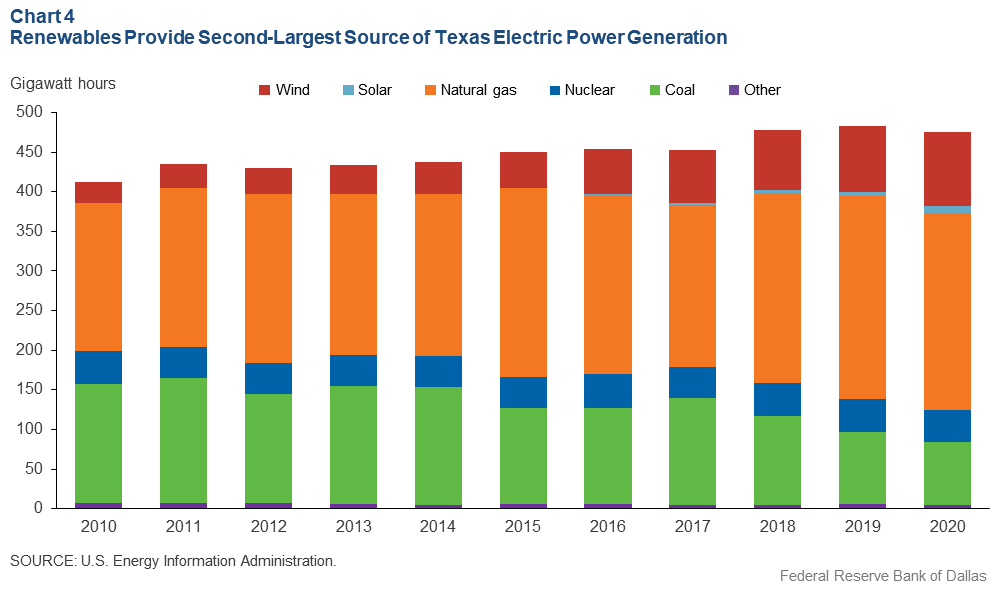
Wind and solar are expected to grow further, with new solar installations expected to make up nearly half of total electric generation capacity additions in Texas. While solar accounted for less than 0.5 percent of total electricity generation as recently as 2016, it now makes up 2 percent of the state’s energy portfolio.
The installation of an additional 10 gigawatts of solar capacity is planned in Texas in 2022—one-third of the total projected solar expansion in the U.S.—potentially doubling the state share. But solar must overcome the lack of a state-level net metering requirement, preventing residential customers from selling excess power back into the power grid, and no specified renewable energy target for solar capacity.[8]
Additionally, traditional fossil-fuel producers have shown little interest in renewables. The second quarter 2021 Dallas Fed Energy Survey suggests that fewer than 20 percent of oil and gas firms are currently producing or planning to invest in wind or solar power over the next four years.
Then again, renewable power is not a substitute for oil, natural gas or natural gas liquids in industries such as petrochemical and plastics production or for the global stock of equipment that relies on liquid fuels. The latter category is likely to come under pressure from electrification of the auto industry as combustion-engine vehicles become largely obsolete over the coming decades.
Path of Transition
The greatest impediment to renewable energy—apart from policy constraints—is the intermittency of solar and wind power. Unlike typically consistent and dispatchable sources such as natural-gas- and coal-powered electrical plants and fuels such as gasoline, renewables are contingent on weather conditions that vary significantly throughout the day, month and year.
Thus, a switch to renewable energy with no change in total power capacity is unfeasible. Rather, a more likely scenario would be a gradual but consistent expansion of the state’s renewable energy capacity, which is expected to account for a majority of new power production over the next 30 years.
During the next three decades, the technology and infrastructure to better store and distribute renewable power to businesses and homes will likely become available. Even so, the demand for power at times when solar or wind are inadequate will necessitate that a significant share of capacity remains in dispatchable sources such as natural gas.
Battery storage can mitigate some of the shortcomings of intermittent power, though the scale and expense of these solutions remain challenges. Only 230 megawatts of battery capacity exists in Texas, representing less than 1 percent of the state’s average daily energy consumption.
Overcoming this challenge may slow the growth in renewables’ share of power production. Even with new technologies continually reducing the cost of battery storage, the enormous scale of installation needed to substitute for a meaningful share of the state’s dispatchable power production suggests that fossil fuels, particularly natural gas, will occupy a central role in power production for years to come.
At the same time, public and political support to reduce CO2 emissions will likely help pressure a more rapid shift toward renewable power. Broadening demand for environmental-, social- and governance-based investment will further incentivize the movement of capital flows from traditional oil and gas activity to clean energy.
This is particularly true for the transportation sector, in which automakers have boosted investment in the development and production of electric vehicles. However, owing to the size of the existing fleet of gasoline-based vehicles, projections by the International Energy Agency suggest electric vehicles will account for only 5 to 12 percent of the total vehicle stock in the U.S. by 2030.
Similarly, other industries seeking to shift to renewable sources of energy will have to rotate their capital stock, which may last for decades more. This supports a projection of a gradual, rather than sharp, decline in the oil and gas sector.
Long-Term Outlook
Based on precedent, the Texas economy could continue to outperform the national average despite a persistent decline in oil and gas production. A high-tech boom and increased industry diversification in the 1990s produced strong overall job and output growth despite oil and gas sector weakness.
Net migration into Texas has remained strong in recent years as people have moved to the state to take advantage of job opportunities and a cost of living well below the national average. Growth in industries outside of oil and gas drew migrants at a disproportionate rate relative to other parts of the U.S., a trend that has persisted.[9]
This deepened the pool of high-skilled labor for regional firms, spurring additional growth. Firms also moved to the state to take advantage of a relatively lower cost of doing business.[10] Texas has led other states by a large margin in firm relocations since 2000, and despite the massive economic disruption brought about by the COVID-19 pandemic beginning in 2020, there are signs that this trend will continue or even accelerate.[11]
While the oil and gas sector has played an important role in the history of the Texas economy—creating booms and busts along the way—a gradual transition to renewables is unlikely to alter the state’s long-term trajectory. Over the next several decades, the enduring factors that have drawn people and businesses to Texas are likely to continue to play an outsized role in determining the state’s growth premium relative to the U.S.
Notes
- See U.S. Global Change Research Program, Fourth National Climate Assessment, vol. II, 2018, p. 39. Also see the Intergovernmental Panel on Climate Change, Climate Change 2014 Synthesis Report Summary for Policymakers, p. 4.
- “Texas’ Energy Base Drives Climate Concerns as Renewables Expand,” by Emma Marshall and Jesse Thompson, Federal Reserve Bank of Dallas Southwest Economy, Third Quarter, 2019.
- “Wind Power a Growing Force in Oil Country,” by Justin J. Lee and Kelvinder Virdi, Federal Reserve Bank of Dallas Southwest Economy, Second Quarter, 2017.
- “Oil Boom in Eagle Ford Shale Brings New Wealth to South Texas,” by Robert W. Gilmer, Raul Hernandez and Keith R. Phillips, Federal Reserve Bank of Dallas Southwest Economy, Second Quarter, 2012. Also, “Permian Basin Booms as New Techniques Resurrect Old Sites,” by Robert W. Gilmer and Jesse B. Thompson III, Federal Reserve Bank of Dallas Southwest Economy, Second Quarter, 2012.
- “The Impact of Changing Energy Prices on the Texas Economy,” by Mine Yücel, Michael Plante, Amy Jordan and Nicole Lake, in Ten Gallon Economy: Sizing Up Economic Growth in Texas, Palgrave Macmillan, 2015, pp. 139–56.
- “Net Zero by 2050: A Roadmap for the Global Energy Sector,” International Energy Agency, May 2021.
- “Diversified Houston Spared Recession … So Far,” by Jesse Thompson, Federal Reserve Bank of Dallas Southwest Economy, Third Quarter, 2015.
- “Abundant Sunshine Not Enough to Power Texas Residential Solar Energy,” by Benjamin Meier and Jesse Thompson, Federal Reserve Bank of Dallas Southwest Economy, First Quarter, 2019.
- “Gone to Texas: Migration Vital to Growth in the Lone Star State,” by Pia Orrenius, Alexander Abraham and Stephanie Gullo, Federal Reserve Bank of Dallas Southwest Economy, First Quarter, 2018.
- “Why Texas Grows Faster: The Role of Smaller Government,” by Jason Saving, in Ten Gallon Economy: Sizing Up Economic Growth in Texas, Palgrave Macmillan, 2015, pp. 33–45.
- “Texas Top-Ranked for Firm Relocations,” by Anil Kumar and Alexander Abraham, Federal Reserve Bank of Dallas Southwest Economy, Fourth Quarter, 2018.
About the Authors

Christopher Slijk
Slijk is an associate economist in the Research Department at the Federal Reserve Bank of Dallas.

Keith R. Phillips
Phillips is an assistant vice president and senior economist in the San Antonio Branch of the Federal Reserve Bank of Dallas.
Southwest Economy is published quarterly by the Federal Reserve Bank of Dallas. The views expressed are those of the authors and should not be attributed to the Federal Reserve Bank of Dallas or the Federal Reserve System.
Articles may be reprinted on the condition that the source is credited to the Federal Reserve Bank of Dallas.
Full publication is available online: www.dallasfed.org/research/swe/2021/swe2103.