
Natural gas demand recovers, lifts prices
Global demand for U.S. natural gas has risen as many pandemic-induced limits on economic activity have been lifted, but domestic production has only slowly recovered.
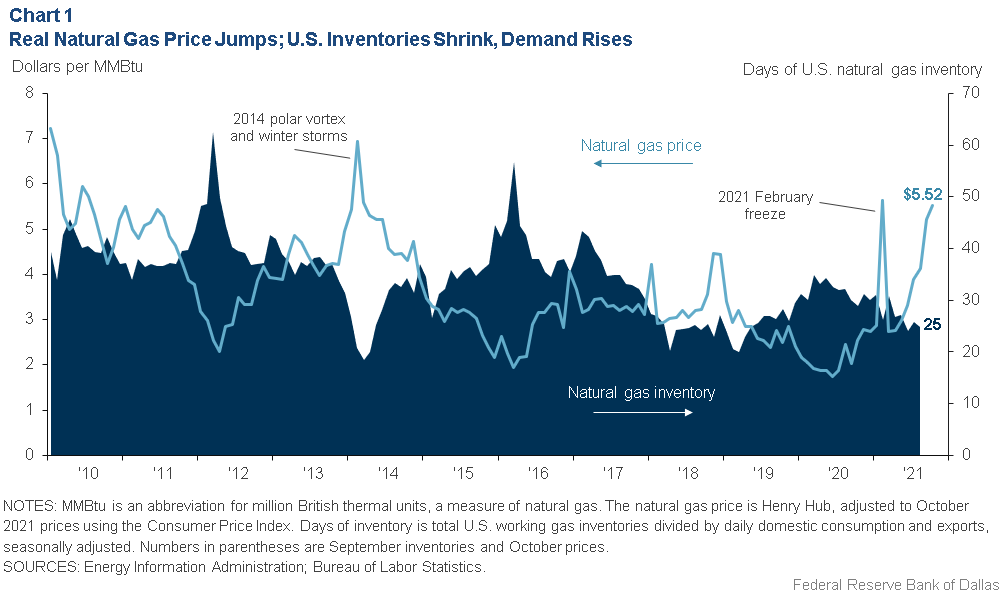
Inventories of natural gas have fallen, while exports have risen. With domestic consumption and exports at or near record highs and capital spending by oil producers anemic, U.S. natural gas prices climbed to $5.52 per million British thermal units (MMBtu) in October, the highest sustained price level since 2010. Despite subsequent price weakening, U.S. consumers could face increased heating costs should winter temperatures plummet and inventories remain tight.
Production Recovers Slowly
The global pandemic initially decimated oil demand, sending inventories sharply higher.[1] Energy prices subsequently collapsed, and U.S. oil and related gas production followed suit. Since the onset of the pandemic in February 2020, production expenditures have only slowly recovered. U.S. associated gas (natural gas co-produced with oil) remained 1.6 billion cubic feet per day (bcf/d) below prepandemic levels in September 2021, while crude oil production was down 2 million barrels per day (mb/d).
The pandemic only lightly damped U.S. natural gas consumption. Stay-at-home orders and limits on businesses shifted utility and heating demand from commercial users to residential customers. International demand, however, was not as resilient. Liquefied natural gas (LNG) exports fell 60 percent from March to July 2020 and did not recover until November 2020. Since then, demand for LNG has soared as European and Asian markets have struggled with tight energy markets.
A cold winter—punctuated by Texas’ February deep freeze and power outage—slowed natural gas production while simultaneously spiking demand. Heat spells in the western U.S. were followed by hurricane-related disruptions to offshore gas production in August. Seasonally adjusted natural gas inventories declined, pushing prices higher.
The shale boom transformed the U.S. into a low-cost natural gas producer in the late 2000s, increasing the export market. Real (inflation-adjusted) U.S. natural gas prices fell from an average of $7.84 per MMBtu in the late 2000s to $3.77 per MMBtu in the 2010s. Prices in 2019 averaged just $2.55. Natural gas production from oil shale basins alone accounted for 35 percent of total U.S. gas supply (Chart 1).
Exports are commonly tied to long-term supply contracts—the volume of gas moved doesn’t fluctuate much with the price.[2] Pipeline and LNG exports made up more than 18 percent of total U.S. production (18.5 bcf/d) in 2021, up from 5 percent in 2010. New capacity and increased pipeline flows will likely raise that to 22.4 bcf/d by December 2022. To meet further domestic and export demand growth over the next several months, oil production (and the natural gas that comes with it) will likely need to rise.
Pipeline constraints will limit further production growth in the northeastern U.S. In contrast, gas pipelines are expanding to the Gulf Coast from oil-producing regions like the Permian Basin and gas-rich basins such as the Haynesville in East Texas and northern Louisiana.
Still, expenditures for new output remain limited among oil and gas producers recovering from losses incurred in recent years. The producers may be reticent to invest given their focus on investor returns, pending methane regulations to curb greenhouse gas emissions and other regulatory challenges.
The Energy Information Administration recently projected the U.S. would add nearly 4 bcf/d of gas production by fourth quarter 2022—half of that dedicated to export. The increase would provide some relief. Nonetheless, prices could remain elevated absent more moderate weather during 2022.
Notes
- “COVID-19 Tanks U.S. Fuel Consumption, Prices,” by Olu Eseyin and Jesse Thompson, Federal Reserve Bank of Dallas Southwest Economy, Second Quarter, 2020.
- “LNG Markets Unleashed: How Texas Stands to Benefit,” by Darcy Taj and Kunal Patel, Federal Reserve Bank of Dallas Southwest Economy, Third Quarter, 2017.
About the Authors

Jesse Thompson
Thompson is a senior business economist in the Research Department at the Federal Reserve Bank of Dallas.
Southwest Economy is published quarterly by the Federal Reserve Bank of Dallas. The views expressed are those of the authors and should not be attributed to the Federal Reserve Bank of Dallas or the Federal Reserve System.
Articles may be reprinted on the condition that the source is credited to the Federal Reserve Bank of Dallas.
Full publication is available online: https://www.dallasfed.org/research/swe/2021/swe2104.