
Changes in labor force participation help explain recent job gains
The U.S. labor force participation rate—the number of people either employed or unemployed as a proportion of the noninstitutionalized working-age (age 16 and older) population—declined following the Great Recession to a low of 62.3 percent in 2015.
Since then, the rate has stabilized at just below 63 percent. The U.S. labor market has continued to add jobs each month at a brisk pace, despite the unemployment rate approaching historically low levels. An important factor in the leveling off of the labor force participation rate and continued job creation is a recent rebound in the prime-age (25 to 54 years) participation rate (Chart 1).
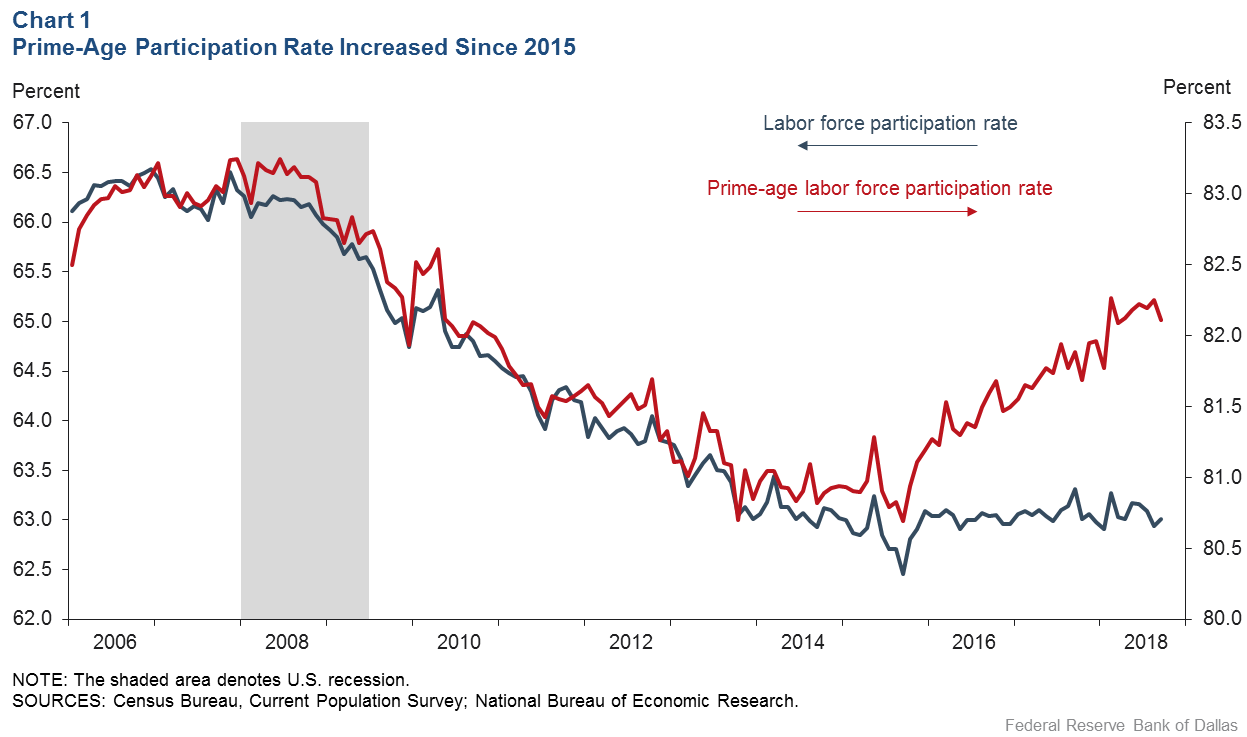
In fact, if the prime-age participation rate had remained at its average in the second half of 2015 (80.9 percent) through September 2018, and the path of the unemployment rate was unaffected, the economy would have added, on average, 40,000 fewer jobs per month (140,000 jobs instead of 180,000).
After considering which demographic groups are driving the changes in the prime-age labor force participation rate, we find all education groups and those individuals claiming disability status are behind its recent rise, though to differing degrees.
Using data from the Current Population Survey, we separate prime-age individuals into four categories based on their highest level of education: college, some college, high school and no diploma. Similarly, we separate prime-age individuals into disability and no disability bins. An individual is placed in the disability bin if they report a physical or cognitive difficulty.
Participation greatest among more-educated groups
Table 1A shows the average participation rate by education level in the first half 2008 and second half 2015 —the period that captures the decline in the prime-age participation rate. Over this period, the participation rate decreased for each education group. More-educated individuals, who participate at a higher rate, experienced the smallest decline.
Table 1B examines the recent rebound, showing the average participation rate by education for the last half of 2015 and the last six months of available data (April 2018 to September 2018). The participation rate increased by a similar amount for each education group, but the overall participation rate remains 0.9 percentage points below its pre-Great Recession level.
Table 1: Most-educated individuals show greater labor force participation
| Table 1A: Participation declined since Great Recession onset | |||||
|---|---|---|---|---|---|
| College | Some College | High School | No Degree | Total | |
| 2008H1 | 88.8 | 84.8 | 80.9 | 68.7 | 83.1 |
| 2015H2 | 87.6 | 81.9 | 76.6 | 65.6 | 80.9 |
| Difference | –1.2 | –2.9 | –4.2 | –3.2 | –2.2 |
| Table 1B: Participation rebounds in recent period of labor tightness | |||||
|---|---|---|---|---|---|
| College | Some College | High School | No Degree | Total | |
| 2015H2 | 87.6 | 81.9 | 76.6 | 65.6 | 80.9 |
| 20186M | 88.4 | 82.7 | 77.9 | 66.7 | 82.2 |
| Difference | 0.8 | 0.8 | 1.2 | 1.2 | 1.3 |
| NOTES: H1 is first six months of the year. H2 is the last six months of the year. 6M is the latest six months, which is April to September 2018. SOURCES: Census Bureau, Current Population Survey; authors’ calculations. |
|||||
Decomposing changes in the participation rate
The total population participation rate can change even if each demographic group’s participation rate is constant, because any one group’s share of the population can vary over time. Therefore, the changes in the total participation rate are decomposed into a contribution from changing participation rates within a group (weighted by the group’s population share) and a contribution from the change in population shares (weighted by a group’s participation rate minus the total participation rate).
For example, if the population share increases for a group that participates at a higher rate than the total population (for example, college-educated individuals), it positively contributes to the total change in the participation rate. The sum of both contributions across the education groups is equal to the total change over a given period.
Educational attainment affects activity
Chart 2 displays the results of the prime-age labor force participation rate decomposition. The red bars display the decomposition of the change from first half 2008 to second half 2015, while the blue bars show the decomposition of the change from second half 2015 to the last six months of available data (April 2018 to September 2018). For each period, the solid bars show the labor force participation rate contribution, and the shaded bars display the population share contribution.
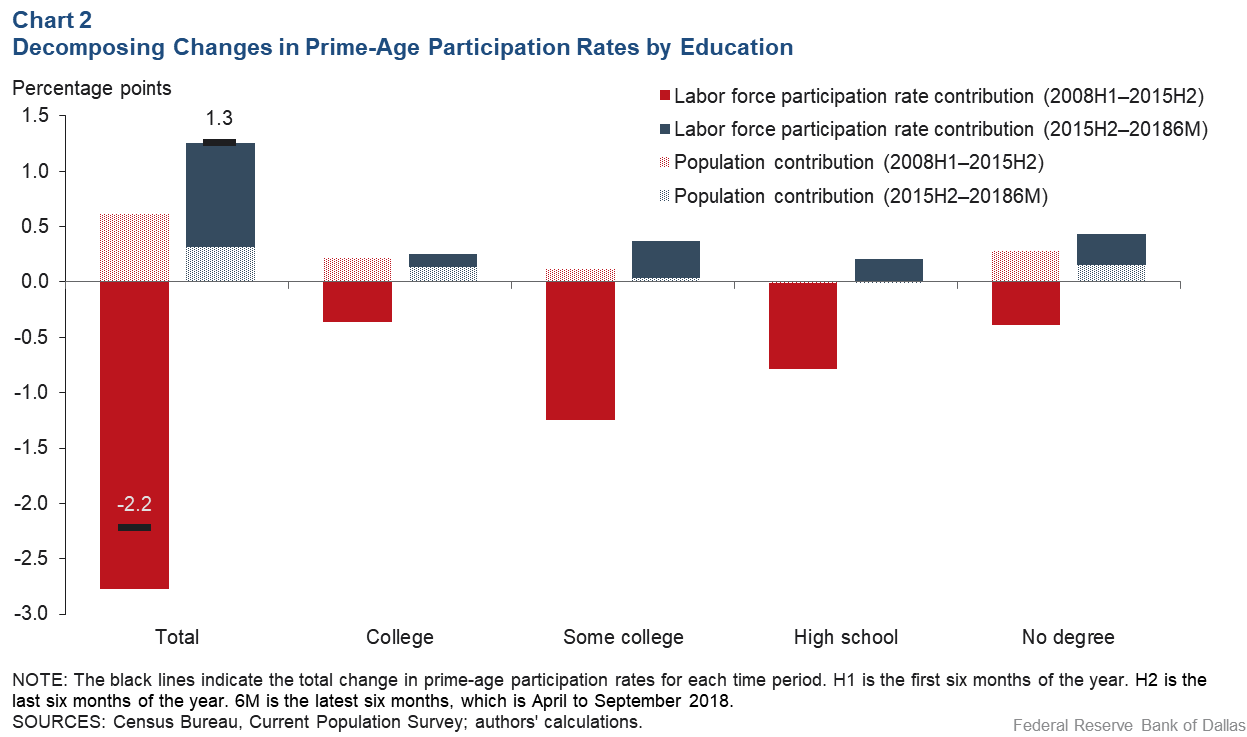
Black lines in the first two columns indicate the total change in the prime-age participation rate in each period (i.e., the sum of the labor force and population share contributions). The shaded bars show that a more-educated population partially mitigated a sharp decline in the participation rate from 2008 to 2015 and boosted the increase over the last three years.
In both periods, the positive population share contributions for each education group reflect fewer individuals with lower educational attainment who participate in the labor force at a lower-than-average rate. Also, there are more people with higher educational attainment who participate at a higher-than-average rate.
In the first period, at the onset of the Great Recession, a decreased participation rate among middle-educated individuals (some college and high school graduates) drove the overall rate. During the rebound, however, participation rate contributions were more spread out across education groups.
Considering disability status in the labor force
Tables 2A and 2B show the average labor force participation rate by disability status for the two periods. Both tables show that the participation rate moved in the same direction for people with and without disabilities; however, the changes were much larger for people with disabilities.
Table 2: Disabled led labor force participation drop-off, rebound
| Table 2A: Activity fell sharply beginning with Great Recession | |||
|---|---|---|---|
| Disability | No Disability | Total | |
| 2008H2 | 40.3 | 86.1 | 83.1 |
| 2015H2 | 34.8 | 84.0 | 80.9 |
| Difference | –5.5 | –2.1 | –2.2 |
| Table 2B: Disabled help push recent participation higher | |||
|---|---|---|---|
| Disability | No Disability | Total | |
| 2015H2 | 34.8 | 84.0 | 80.9 |
| 20186M | 39.2 | 84.9 | 82.2 |
| Difference | 4.4 | 0.9 | 1.3 |
| NOTES: H2 is last six months of the year. 6M is the latest six months, which is April to September 2018. SOURCES: Census Bureau, Current Population Survey; authors’ calculations. |
|||
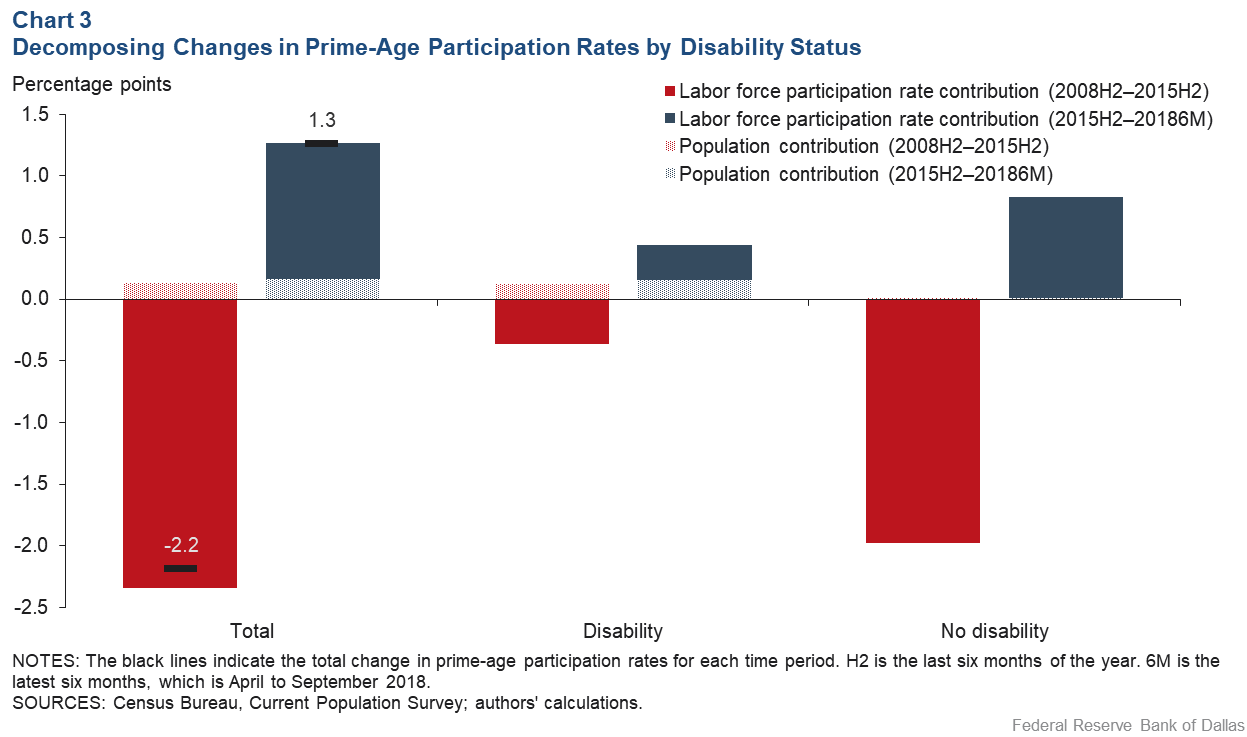
Using the same decomposition described above, Chart 3 displays the results of the prime-age labor force participation rate decomposition by disability status. In both periods, the decline in the share of the population with a disability, which participates at about half the rate of the rest of the population, boosted the total participation rate.
In the first period, the combination of the labor force and population share contributions of those with a disability explained only 0.3 percentage points of the 2.2 percentage-point decline in the participation. During the rebound, the contribution of those with a disability was much larger, 0.5 percentage points of the 1.3 percentage-point increase in the participation rate.
Questioning the return to pre-Great-Recession levels
All education groups and disability-status individuals broadly drove the prime-age participation rate increase from 2015 to 2018. Despite the steady rebound, this rate remains 0.9 percentage points below its pre-Great-Recession level.
One might conclude from the steady recovery that the participation rate will continue increasing as individuals across education groups reenter the labor force. However, the prime-age participation rate had similar trends in the early 2000s—sharply declining from 2001 to 2005 and rising until 2008—but never returned to its pre-2001-recession level. This calls into question whether prime-age participation rates will continue to offset the downward trend in the overall rate and boost job gains in the coming years.
About the Authors
The views expressed are those of the authors and should not be attributed to the Federal Reserve Bank of Dallas or the Federal Reserve System.