
Has U.S. monetary policy gone off track?
No, monetary policy hasn’t gone off track. The same simple rule that describes U.S. monetary policy from 1987 to 2008 also nicely describes policy from 2014 to the present. Over both periods, the actions of the Federal Open Market Committee (FOMC) can be explained by the committee’s pursuit of full employment and price stability.
To the extent that past economic outcomes are judged satisfactory, a rule that accurately describes past FOMC behavior provides a guidepost for assessing current policy and an indication of how policy is likely to respond to future economic developments. And to the extent that past economic outcomes are judged unsatisfactory, finding a rule that accurately describes past policy can be helpful when attempting to uncover what went wrong, and for identifying changes in strategy that might improve future performance.
The notion that the FOMC’s policy choices are driven by its efforts to meet its dual-mandate objectives of full employment and price stability goes back at least to John Taylor’s work in the early 1990s. Taylor showed that movements in short-term interest rates from 1987 through 1992 could be explained by the gap between real gross domestic product and its trend (“slack”), and by the four-quarter percent change in the gross domestic product deflator (“inflation”).
Famously, the response of the interest rate to inflation in the Taylor rule is more than one-for-one—a condition, called “the Taylor principle,” that is required for stability in a wide variety of macroeconomic models. Subsequent research has confirmed Taylor’s main results using alternative slack and inflation measures. More controversially, some researchers have found evidence of inertia, or sluggishness, in policy’s response to slack and inflation.
Standard Taylor Rule breaks down
Taylor’s interest rate rule and most variants have gone badly off the rails in recent years, predicting a much higher interest rate path than that actually observed. (Alternatively, it could be that FOMC policy has gone badly off the rails.) The solid and dashed red lines in Chart 1 illustrate the problem.
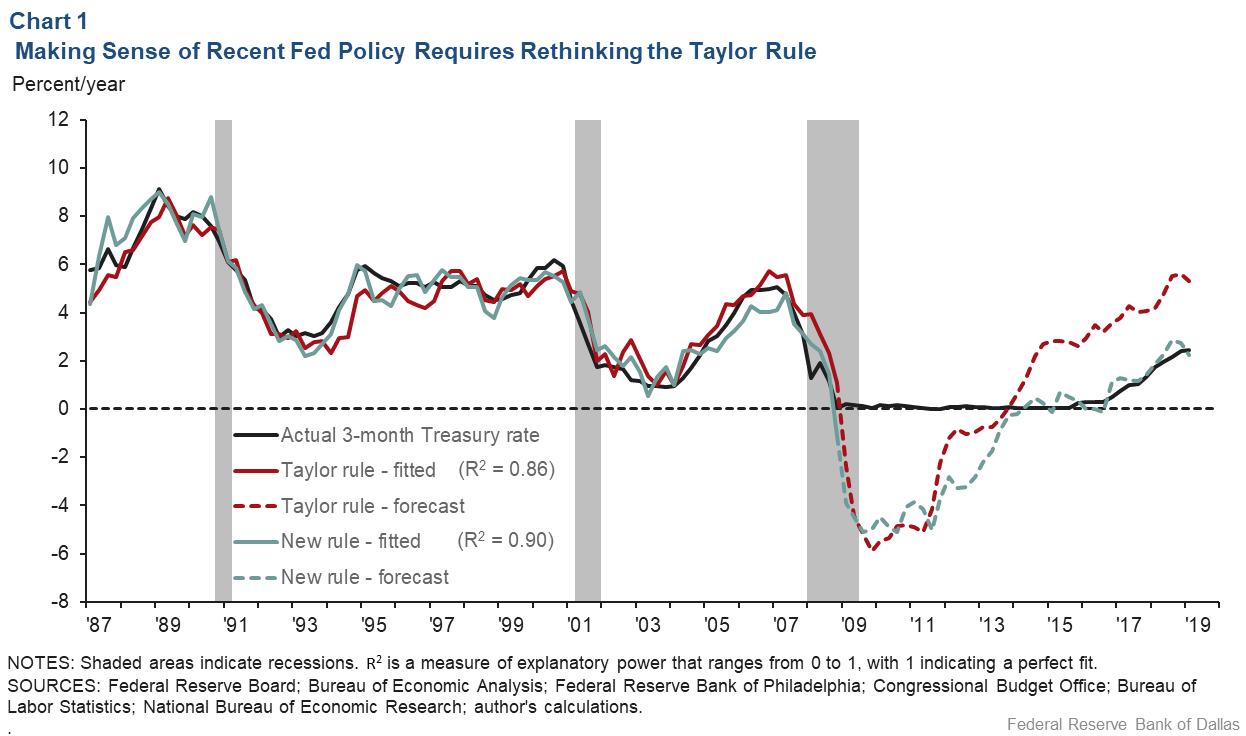
The solid red line shows the values of a short-term interest rate (the three-month Treasury rate) predicted by a standard, Taylor-style policy rule fitted to data from 1987 through 2008. The Taylor rule in question measures slack as the gap between the unemployment rate and real-time Congressional Budget Office (CBO) estimates of the full-employment or “natural” unemployment rate.
It measures departures from price stability as the gap between four-quarter “core” personal consumption expenditures (PCE) inflation and 10-year inflation expectations as captured by the Survey of Professional Forecasters. Finally, it measures the stance of policy as the real short-term interest rate, defined as the difference between the three-month Treasury rate and four-quarter core PCE inflation, less a constant. There is no allowance for policy inertia.
The fitted Taylor rule does a creditable job of explaining the actual path of policy from 1987 through 2008: The solid red line captures most of the movement in the solid black line.
Take that same rule and try to use it to predict policy during the financial crisis and recovery (the dashed red line) and its performance falls apart: The rule calls for a much lower interest rate than was actually seen from 2009 to 2013, and a much higher interest rate from 2014 to the present. That policy was tighter than desired during the first several years following the crisis is no surprise, given the difficulty of pushing rates below zero. The FOMC’s behavior over the past five years is the puzzle.
An alternative Taylor rule—described below—produces the fitted values shown in solid green and out-of-sample predictions shown in dashed green. The new rule is much more successful at predicting the FOMC’s post-2013 decisions. It also does a somewhat better job of explaining the precrisis evolution of policy. What explains this consistent success over a 30-year span?
Tweak #1: Average inflation targeting
A modest contributor to the alternative rule’s success is average inflation targeting (AIT). AIT is the idea that in setting policy, the FOMC should look at inflation over a period longer than one year. We find evidence that the FOMC already engages in average inflation targeting of a sort: It puts roughly equal weight on one-year realized inflation and one-year expected inflation in its policy deliberations. That the FOMC would pay attention to the near-term inflation outlook as well as inflation’s near-term past realization makes a great deal of sense given the lags with which monetary policy affects prices.
Tweak #2: A better way of measuring the stance of policy
While it is interesting that past FOMC behavior shows evidence of a type of average inflation targeting, AIT makes only a small contribution to our improved ability to explain FOMC policy decisions. The real key to our success is that we use the slope of the yield curve (less a constant) to gauge the stance of monetary policy.
Specifically, we assume that the FOMC raises the three-month Treasury rate relative to the five-year/five-year forward Treasury rate when inflation is high and/or the labor market is perceived to be tight, and lowers the short interest rate relative to the long-forward rate when inflation is low and/or the labor market has slack. Raising short-term rates relative to long-term rates reduces the profitability of intermediation, restricting credit. Lowering short-term relative to long-term rates eases credit.
Because it looks at the five-year period that begins five years from now, the long-forward rate is relatively insulated from cyclical influences and from current policy. It well-approximates the long-run neutral level of rates (which economists call R*) as measured by sophisticated statistical techniques.
That conclusion is supported by evidence that the slope of the yield curve is a powerful (non-linear) predictor of changes in the unemployment rate. Unlike sophisticated R* measures, however, the long-forward rate is calculated directly from market rates, and policymakers can track it in real time. Perhaps that is why we’ve found that in explaining the FOMC’s policy moves, the long-forward rate actually outperforms more complicated R* measures.
Mind the gaps
By thinking of the FOMC as choosing the short-term interest rate relative to a long-term rate, in response to inflation and unemployment gaps, one can readily explain the behavior of short-term rates since 1987. The exception is the five-year period immediately following the global financial crisis, when policy was constrained by the zero lower bound on interest rates.
About the Author

Evan F. Koenig
Koenig is a senior vice president and principal policy advisor in the Research Department at the Federal Reserve Bank of Dallas.
The views expressed are those of the authors and should not be attributed to the Federal Reserve Bank of Dallas or the Federal Reserve System.