
Economic policy uncertainty emerges as drag on stock market
Investors, facing heightened uncertainty due to a range of factors, such as interest rates, macroeconomic growth prospects and economic policy conduct, expect to be compensated for added risk. Higher risk premiums, in turn, tend to depress stock prices. Over the past two years, virtually all of the downside pressure on stock prices has come from the elevated levels of such uncertainty.
Isolating the effect of economic policy uncertainty on equity prices requires an analysis of the combined interaction of the factors thought to affect stock prices. Systematically quantifying the impact of economic policy uncertainty is inherently difficult, further complicating such a review. Recent advances in natural language processing, however, have made it possible to track sentiment related to economic policy uncertainty.
We employ one such widely used measure to isolate the effects of economic policy uncertainty on stock prices. In the absence of such uncertainty, the Standard & Poor’s 500 Index would have been about 12 percent higher over the past two years, we observe.
Using the press to monitor economic policy uncertainty
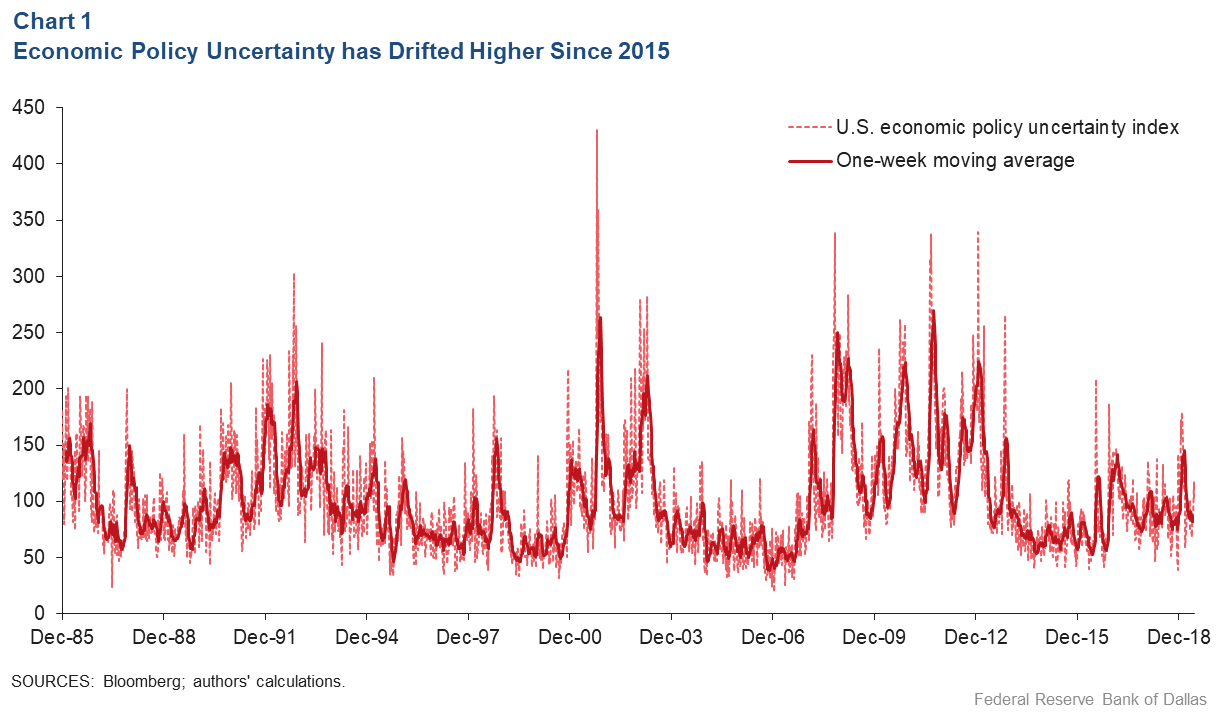
A recently published, peer-reviewed index of print media news coverage provides a measure of the relative prominence of uncertainty-related reports. In addition to indexing the number of articles in major U.S. newspapers that reference uncertainty, this measure incorporates a weighted count of federal tax-code provisions scheduled to expire and the extent to which professional forecasters disagree with one another about future levels of inflation and fiscal policy.
Referred to as the U.S. economic policy uncertainty index (EPUI), its coverage begins in January 1985, and its daily values average 100 during 1985–2009. EPUI indicates that economic policy uncertainty has been generally trending upward since a relative lull in 2014 (Chart 1).
Research has linked elevated levels of EPUI to reduced bank lending and reduced capital expenditures. An unanswered issue is how economic policy uncertainty has affected U.S. equities after accounting for conventional drivers such as interest rates, real (inflation-adjusted) economic activity and macroeconomic growth prospects. We find that the recent uptick in the EPUI has weighed negatively on the stock market and, over the past two years, has become the dominant source of downward pressure.
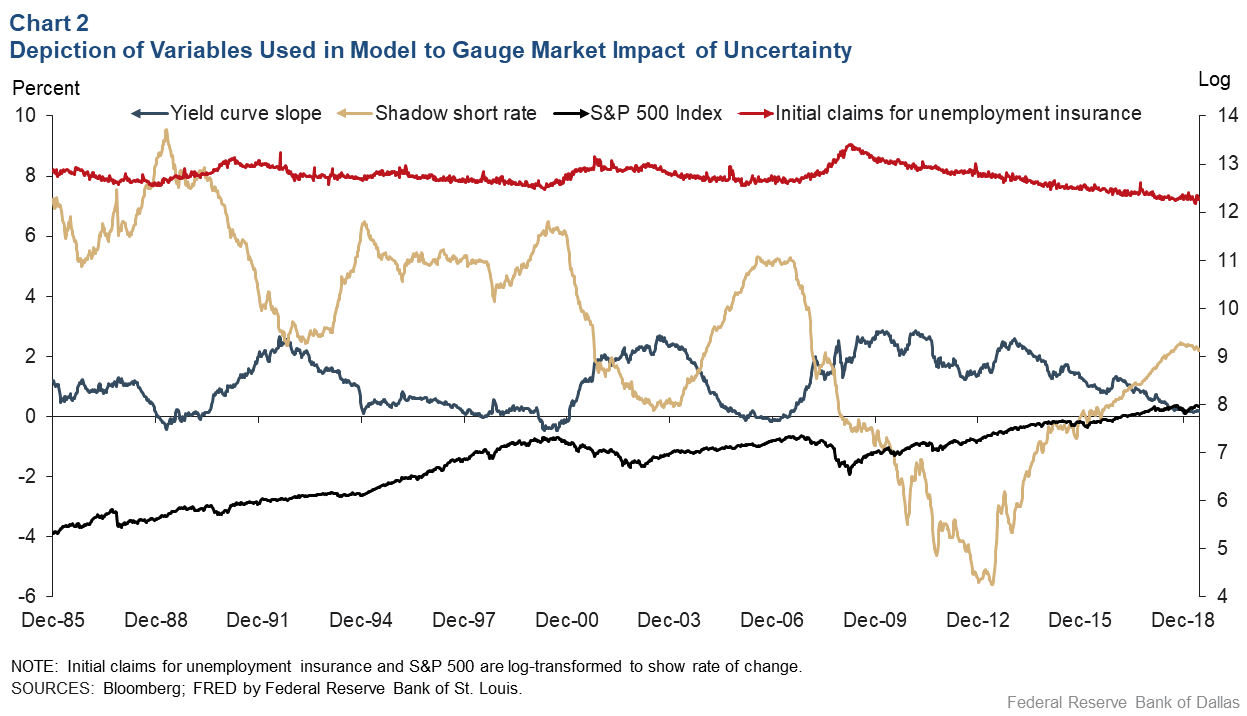
Variables used in our model are known for their intuitive links to equity valuation, either directly or as proxies. In addition to policy uncertainty, they include measures of real activity, the effective monetary policy interest rate and expectations of future macroeconomic activity (Table 1). Since the measure of real activity with the highest frequency is the weekly initial claims for unemployment insurance, the analysis follows that frequency. The data cover December 1985 through May 2019, a period that encompasses multiple bouts of increased equity volatility, changes in the stance of monetary policy, trade tensions, various levels of aggregate economic growth and a number of financial crises (Chart 2).
Table 1: Variables in the Empirical Model
| S&P 500 Index | A mainstay representation of the U.S. equity markets, the index reflects the market-weighted value of the 500 largest publicly traded U.S. corporations. |
| Economic policy uncertainty index | Index developed to represent the degree of policy uncertainty using press mentions of “policy uncertainty,” expiring federal tax code provisions and dispersion in professional forecasters’ outlooks for inflation and fiscal policy. |
| Initial claims for unemployment insurance | A measure of slack in the workforce and an indicator of real activity. |
| Shadow short rate | The federal funds rate extracts information from the rest of the yield curve (yields on Treasuries of different maturities) to obtain implied negative values for the shortest-term rate when federal funds are at the zero lower bound. |
| Yield curve slope (10-year minus two-year Treasury rates) | Yield curve slope approximates the financial markets’ expectations of future economic activity. |
Dynamic responses to shocks
Disentangling contributions of different shocks to the dynamics of any given variable, such as stock prices, requires additional assumptions regarding how variables interact contemporaneously. We impose relatively unrestrictive assumptions to identify the underlying structural shocks to all variables and study their respective effects.
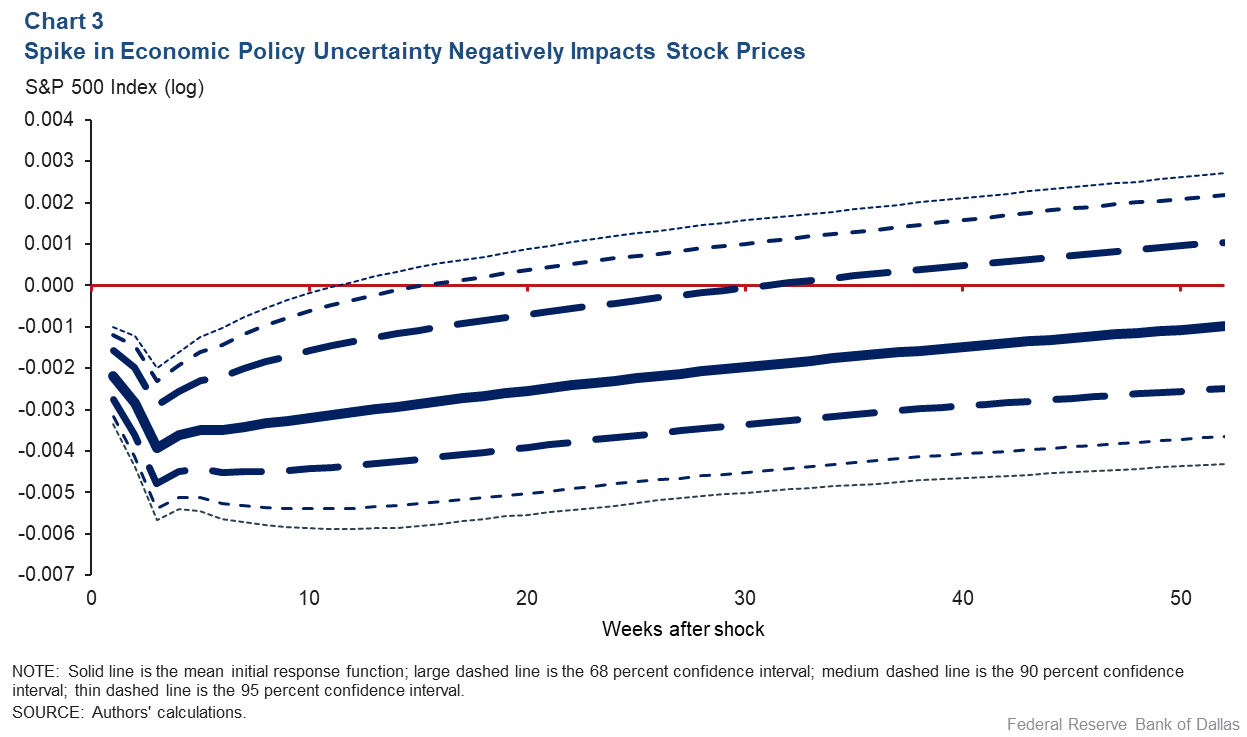
Impulse response functions show the dynamic reaction of a given variable to a one standard deviation shock and how that response propagates over time. The response of equity prices (given by the log S&P 500 Index) to a shock in economic policy uncertainty is negative and statistically significant (Chart 3). The results are consistent with economic intuition: All else equal, as economic policy uncertainty rises, the S&P 500 Index declines. On average, this negative impact lasts for more than a year, with one standard deviation of economic policy uncertainty shock reducing stock prices by about 0.4 percent.
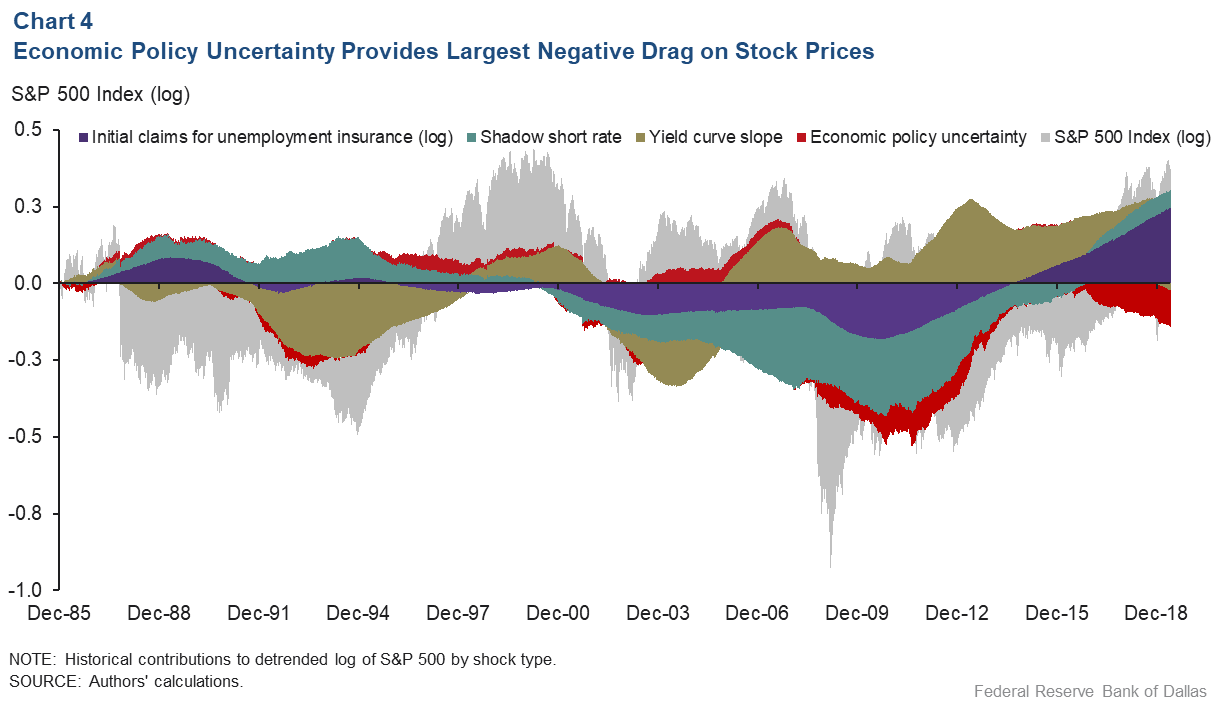
Next, we gauge the relative contributions of shocks to different variables and movements in the detrended S&P 500. Positive contributions (those stacked above zero) identify the factors that have pushed stock prices above their long-term trend; negative contributions (those stacked below zero) show the factors that explained downward pressures (Chart 4).
Historically, much of the fluctuations in the S&P 500 can be explained by unexpected developments in the yield curve slope, monetary policy and the stock market’s own shocks.
Economic uncertainty weighs on equities
Although economic policy uncertainty has historically contributed little to explaining stock market fluctuations, its impact has become much larger in recent years. It has accounted for a large portion of the downside to the stock market fluctuations since 2016. This last result is particularly striking, since virtually all other factors have provided a positive impulse to the S&P 500.
Increased economic policy uncertainty reduced the S&P 500 Index by about 12 percent relative to what would have occurred on average within the sample by the end of the review period. This is quantitatively similar to the contribution of the heightened level of unemployment claims during the Great Recession.
About the Authors

Pavel Kapinos
Kapinos is a senior research economist in the Supervisory Risk and Surveillance Department at the Federal Reserve Bank of Dallas.

Alex Musatov
Musatov is a financial sector advisor in the Supervisory Risk and Surveillance Department at the Federal Reserve Bank of Dallas.
The views expressed are those of the authors and should not be attributed to the Federal Reserve Bank of Dallas or the Federal Reserve System.