
Declining immigration weighs on GDP growth, with little impact on inflation
The U.S. experienced an unprecedented immigration surge from 2021 to 2024, driven mainly by an influx of immigrants crossing the Southwest border without visas. Many were released into the country after encountering the Border Patrol.
These immigrants were issued humanitarian parole, allowed to enter the U.S. to seek asylum or given notice to appear in immigration court. Others entered the country illegally without encountering enforcement personnel. The Congressional Budget Office (CBO) projected that 7.3 million “other foreign nationals,” unauthorized immigrants or immigrants with some form of quasi-legal status, but not valid visas, were added to the U.S. population on net during 2021–24. This dwarfed the prepandemic annual average of about 100,000.[1]
Although the postpandemic immigration surge slowed by mid-2024, policies the new administration implemented this year have already led to further reductions in this type of immigration in terms of both less inflow and higher outflow (the latter reflecting more deportations). The slowdown in unauthorized immigrant inflows will have important implications for growth of the labor force and economy and may impact wages and prices. Increases in the foreign-born population accounted for most labor force and population growth in recent years. Unlike previous influxes of unauthorized immigrants, during the latest instance many postpandemic arrivals were granted temporary protections, allowed to enter the country and issued work permits.
To gauge the potential impact on the U.S. economy of reduced unauthorized immigration, we use a structural vector autoregressive (VAR) model of the relationship between net inflows of unauthorized immigrants and key macroeconomic variables such as gross domestic product (GDP) and inflation using data beginning in the 1950s.
We then take the analysis a step further by mapping different immigration policy scenarios into future immigration shocks with macroeconomic effects that can be quantified within the structural VAR model. This methodology allows us to consider several scenarios for the future evolution of unauthorized immigration, including a mass-deportation scenario in which the number of people removed from the country annually rises to 1 million by year-end 2027.
The identification of the model builds on insights from previous studies that show migration responds to changes in economic pull factors with a delay. Conditions in the home country and unexpected changes in immigration enforcement also play important roles in migration. This evidence suggests immigration inflows can be treated as predetermined with respect to U.S. macroeconomic conditions within the same year.
Our estimates show that an unexpected increase in net unauthorized immigration raises U.S. output growth for about two years but has almost no effect on inflation. Applying these estimates to our baseline policy scenario, which assumes that net unauthorized immigration remains at its spring 2025 level, annual GDP growth is about 0.8 percentage point lower than it would have been if net unauthorized immigration would have evolved as in the CBO’s latest demographic projection. The CBO estimates reflect the laws and policies in place in November 2024 and, hence, do not incorporate immigration policy changes after January 2025.
The baseline scenario represents about a 2.4 million decline in net unauthorized immigration during 2025–28 relative to the CBO projection. In a mass-deportation scenario with a larger decline, the negative effect on growth is about the same magnitude but more persistent.
The VAR model estimates are robust to the sample period, the lag order and alternative model specifications. However, there are several caveats. First, the predicted effects are highly uncertain, as the estimates have large error bands that include zero in many cases.
Second, the VAR model estimates used for the scenario analysis are based on data from 1955 to 2019. The economy has evolved significantly over this period and since the pandemic. As a result, the historical relationship between variables such as migration and GDP may not adequately capture their relationship in the postpandemic period. Moreover, time-varying effects of immigration or other possible nonlinearities could bias our estimates in an unknown direction.
Third, our results only speak to the potential effects of restricting unauthorized immigration, which may be quite different from the effects of restricting legal immigration. Given these caveats, readers should be aware of the uncertainty around our estimates, especially regarding immigration’s effects on GDP growth.
Unauthorized immigration: past, present and future
To create a measure of net unauthorized immigration, we use data from the U.S. Department of Homeland Security (DHS) to add up unauthorized migrant inflows and subtract outflows. The result is a time series of monthly net unauthorized immigration from October 2013 to March 2025 (Chart 1).
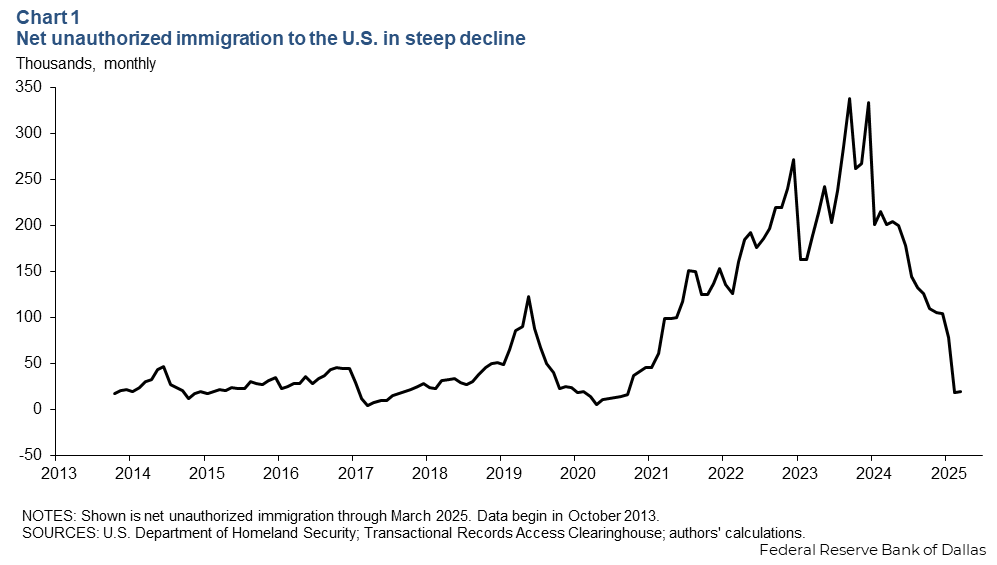
The DHS data utilized to construct inflows include information on encounters with unauthorized immigrants along the U.S. borders with Mexico and Canada and in the interior. The data also include Border Patrol estimates of the number of immigrants who illegally entered the U.S. along the borders and got away (eluded capture), a flow called “gotaways” by DHS. For outflows, we utilize migrant repatriations (removals and returns at the borders and the interior). Hence, net unauthorized immigration totals nationwide migrant encounters and border gotaways as a measure of the inflow and subtracts repatriations as a measure of the outflow.[2]
Net unauthorized immigration was very low during 2013–18, as Chart 1 shows. It spiked in 2019 due to a surge in migration from Central America before falling sharply in 2020, as the borders shut down in response to the coronavirus outbreak.
Once the borders reopened in late 2021, net unauthorized immigration rose dramatically, reaching a historical high in late 2023, before once more falling in 2024. The decline accelerated in June 2024, as the Biden administration began restricting certain migrants’ ability to request asylum along the southern border. By March 2025, net unauthorized immigration was down 82 percent from the December 2024 level—from 105,000 to 19,000 per month.
To evaluate the macroeconomic effects of the future evolution of net unauthorized immigration, we construct migration scenarios that speak to the current administration’s two major policy goals. The first is to stop unauthorized immigration at the border, canceling humanitarian parole and essentially suspending the asylum-seeking process. The second goal is to conduct mass deportations from the interior of the country.
Net unauthorized immigration is therefore decomposed into two components. The border-inflow is the sum of encounters and gotaways minus repatriations that occur at the borders, and the interior-outflow is deportations of people arrested in the U.S. interior.
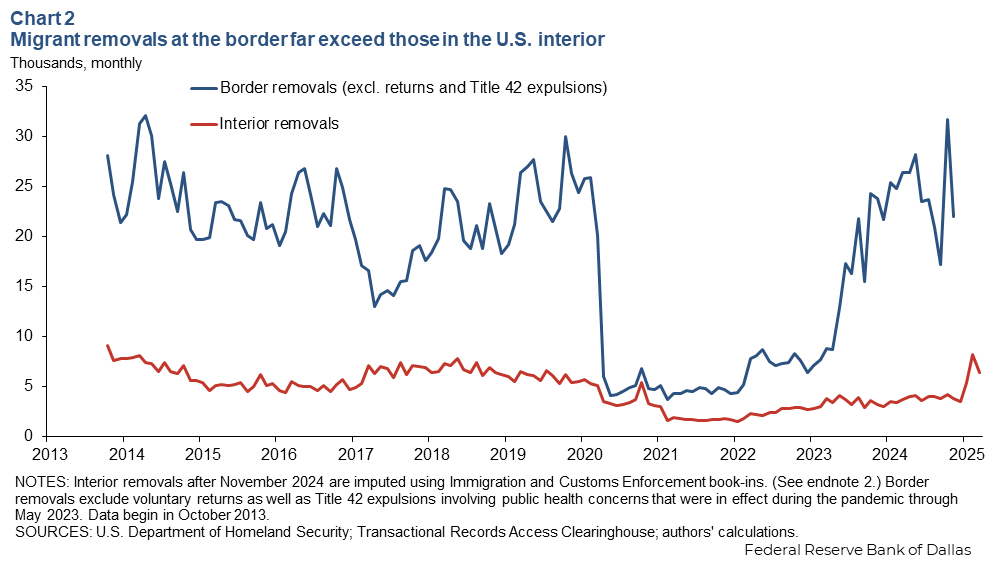
Given the progress in stopping immigration along the U.S.–Mexico border, we expect the border-inflow component of net unauthorized immigration to remain near zero as it has in recent months. The path of the interior-outflow component, however, is uncertain. Arresting and removing unauthorized immigrants has proven difficult, and Immigration and Customs Enforcement (ICE) is falling short of its numerical targets. Historically, interior removals have always been low compared with those at the border (Chart 2).
That said, ICE received an unprecedented funding increase under the administration’s spending plan. Resources will be provided to hire more agents, house and transport more migrants and pay for state and local partnerships with law enforcement.
To gauge the potential impact of immigration restrictions on the U.S. economy, we consider several scenarios for the possible evolution of net unauthorized immigration. These scenarios differ only in the expected number of interior removals; we assume the border-inflow component will continue near zero.
In the baseline scenario for net unauthorized immigration (Chart 3, black dash), we assume the number of interior removals will stay at its current estimated level. This is approximately 243 migrants per day, or 87,500 per year, which is about 2.6 times the 2021–24 average number of removals. We estimate this number using ICE book-ins for February and March 2025. (DHS stopped publishing monthly data on interior removals after its November 2024 report.)
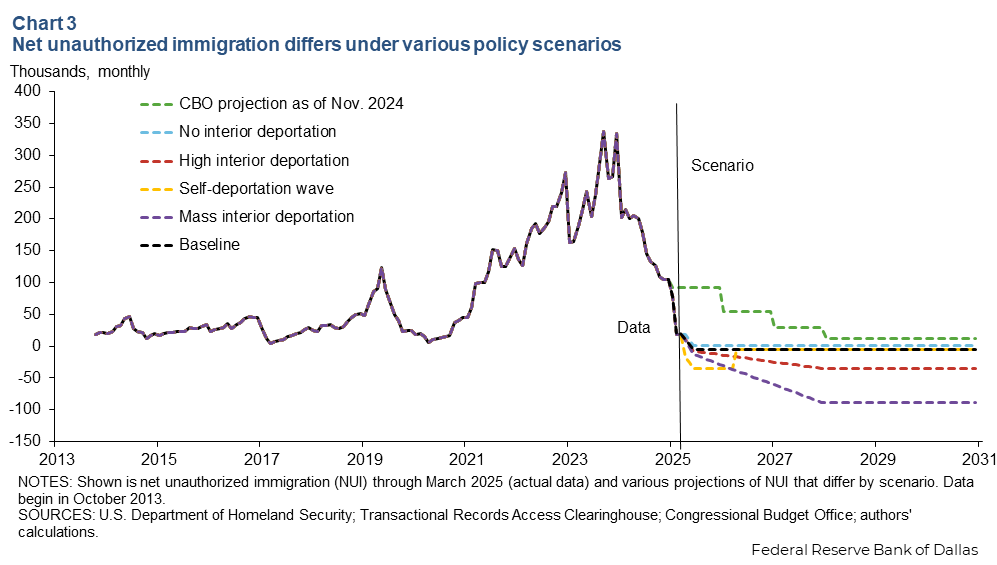
The high interior deportation scenario (Chart 3, red) allows interior removals to gradually increase to 437,500 per year by year-end 2027, five times as many as in the baseline scenario.
In the third scenario, a self-deportation wave (Chart 3, orange), half of migrants with temporary protected status (TPS) leave the U.S. before mid-2026, triggering a front-loaded self-deportation wave. According to the National Immigration Forum, 863,880 people from 16 countries had temporary protected status as of September 2024.
In the mass deportation scenario (Chart 3, purple), interior removals gradually increase to 1 million annually by year-end 2027. This scenario describes an extreme outcome that is unlikely due to resource constraints (for example, on personnel, funding and detention space), as suggested by the American Immigration Council.
Finally, to evaluate the extent to which reduced immigration inflows at the border alone contribute to the potential macroeconomic effects, we consider a fifth scenario of interior removals held at zero (Chart 3, light blue).
We compare the five scenarios for net unauthorized immigration with the CBO’s projections (Chart 3, green). The CBO projection, published in January 2025 but based on data available as of November 2024, shows a much higher level of net unauthorized immigration than any of the five scenarios we model.
In the following analysis, we first predict the economic outcomes consistent with the CBO’s projection using our VAR model estimates. We then use this prediction as the benchmark to evaluate the macroeconomic effects of immigration restrictions in each of our scenarios.
The structural VAR model
In this section, we propose a structural VAR model to analyze the effects of unauthorized immigration on key U.S. macroeconomic variables. We use annual data for 1955–2019 to estimate the model. Historical data going back that far are available only on an annual frequency. We choose 1955 as the starting point because it is after the implementation of the 1952 Immigration and Nationality Act and avoids the world wars and Great Depression, which are periods of significant disruption that could bias our results.
In addition, before the 1950s, variation in unauthorized immigration was primarily driven by waves of European immigrants. The new arrivals differed notably from the immigrants from Mexico and Central America that would come to define such flows in the latter half of the 20th century. European immigrants attempted to enter the U.S. via the southern border to avoid the literacy test, for example, an immigration barrier not applied to Mexicans who typically arrived as temporary laborers. In fact, the Bracero Program, which allowed Mexicans to migrate as seasonal farmworkers, was underway during the first decade of our sample period.
We choose 2019 as the end of our estimation sample to avoid including the pandemic years. Net unauthorized immigration boomed and busted in the postpandemic period, representing extreme outliers and posing an overfitting problem for the VAR model.
We use annual fiscal year data from the Yearbook of Immigration Statistics published by the Office of Immigration Statistics in DHS.[3] Data before 1978 originated with the annual reports of the Immigration and Naturalization Service, part of the Department of Justice until 2003, when DHS was created. The yearbook data contain the number of migrant encounters (previously called apprehensions) and removals and returns for the entire period. Gotaways, however, are only available since 2010 and, hence, we impute gotaways for the years with missing data.[4] Thus, we can construct a time series of net unauthorized immigration following the method we use for the monthly data—the sum of encounters and gotaways minus removals and returns.
For the macroeconomic variables, we use annual data on the personal consumption expenditure (PCE) price index from the Bureau of Economic Analysis (BEA), real GDP and its components (also from BEA), nonfarm payroll employment (Bureau of Labor Statistics) and U.S. population (Census Bureau).
Let  , where NUIt denotes net unauthorized immigration as a percent of the previous-year U.S. population, ΔEMPt is the annual growth rate of nonfarm payroll employment, πt is the PCE annual inflation rate, and ΔGDPt is yearly GDP growth. We postulate that these data are jointly explained by a structural VAR model.
The structural model can be written as  , where yt is the four-by-one vector of year t observations for
  . wt denotes the vector of mutually uncorrelated independently and identically distributed structural shocks and
  , represent four-by-four dimensional coefficient matrices. The intercept has been dropped for expository purposes. The reduced-form VAR model representation is
 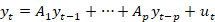 , where
  ,
,  and
and  We set the lag order, p, to 2.
The net unauthorized immigration shock is identified based on the assumption that net unauthorized immigration is predetermined with respect to the other model variables within the same year. This assumption is supported by previous evidence that migration responds to changes in economic pull factors with a delay, and that other factors, such as economic and political conditions in home countries and unexpected changes in immigration enforcement, also play important roles in driving migration.
Chart 4 shows unauthorized immigration inflows, outflows and their difference as a percentage of the previous-year population for the sample period. The contemporaneous correlation between net unauthorized immigration and U.S. recession dates is -0.09 and statistically insignificant, consistent with net flows' insensitivity to U.S. economic conditions in the same year.
In addition, large movements in net unauthorized immigration, such as those in the 1970s and 1980s, coincided with periods of significant political and socioeconomic unrest in Mexico and Central America, suggesting that home country conditions not driven by U.S. macroeconomic conditions are important causes for migration.
Under our identifying assumption, NUIt is ordered first to identify the structural net unauthorized immigration shock. The model is partially identified in that only the first shock is identified. The estimates of the responses to this shock are invariant to the identification of the remaining structural shocks (see Christiano et al. 1999).
Since we are also interested in the responses of various GDP components for part of our analysis, we augment the four-variable model above with an additional variable, such as the change in a given GDP component over the previous year’s GDP value. GDP components include, among others, consumption and residential and non-residential investment. This allows us to assess the contribution of a component to the overall GDP response.
The model estimates allow us to conduct scenario analysis of the effects of immigration restrictions. This requires mapping the hypothetical path of net unauthorized immigration in each scenario, as shown in Chart 3, into a sequence of structural shocks to net unauthorized immigration.
Let  denote the structural net unauthorized immigration shock at year j in scenario s, where
  for j ≥ 2024. We sequentially obtain net unauthorized immigration shocks and the responses of other model variables for j > 2024 . First, the net unauthorized immigration shock can be recovered by
 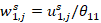 , where
  is the reduced-form innovation (calculated using
  and
and  ) and
) and  is the (1,1)th element of
  . Second, given , we predict the responses of all other model variables holding other structural shocks at zero, i.e.,
 , where k = 2,3,4, and
  is the k th row of . We iterate these two steps forward to obtain
  for j > 2024. (Similar methods for conducting scenario analysis have been used in Kilian and Zhou 2020; 2022.)
Since we are interested in the effects of immigration restrictions relative to a benchmark of what would have happened in their absence, we use the hypothetical paths of GDP growth and inflation simulated under the CBO’s immigration projection as the benchmark. We apply the algorithm above to obtain this benchmark, denoted as  . The effect of immigration policy in each scenario can be quantified as
  , for
, for  {baseline, high interior deportation, self-deportation wave, mass interior deportation, no deportation} and j > 2024.
The macroeconomic effects of unauthorized immigration
Using the structural VAR model estimated on data from 1955 to 2019, Chart 5 shows that U.S. GDP growth typically increases for two years in response to an unexpected increase in net unauthorized immigration and then gradually reverts to its mean. Inflation shows almost no response in the first few years but decreases slightly at longer horizons. When expanding the model to include GDP components, we find that residential investment mainly drives the short-term increase in GDP growth, while nonresidential investment and consumption contribute to the response of GDP growth at longer horizons.
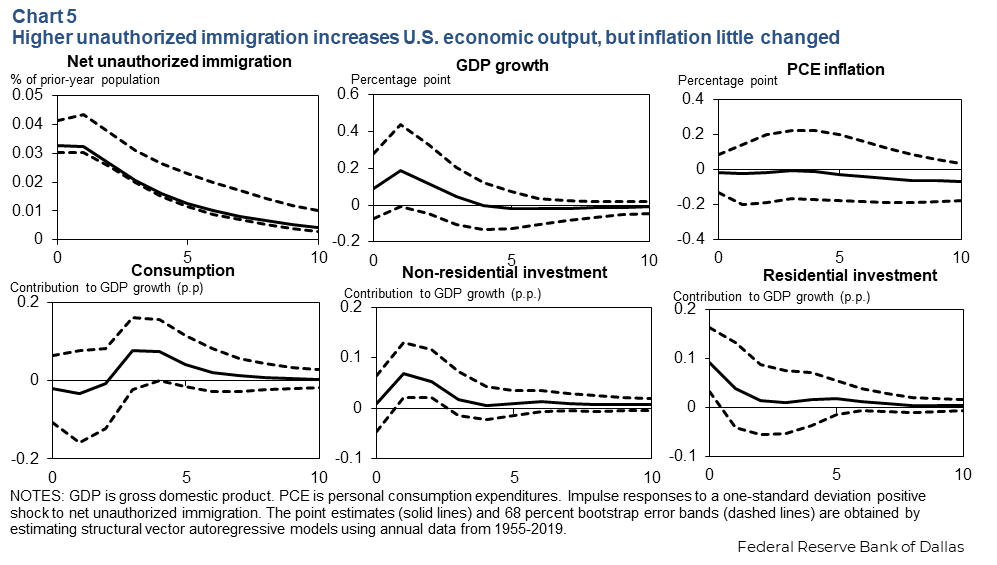
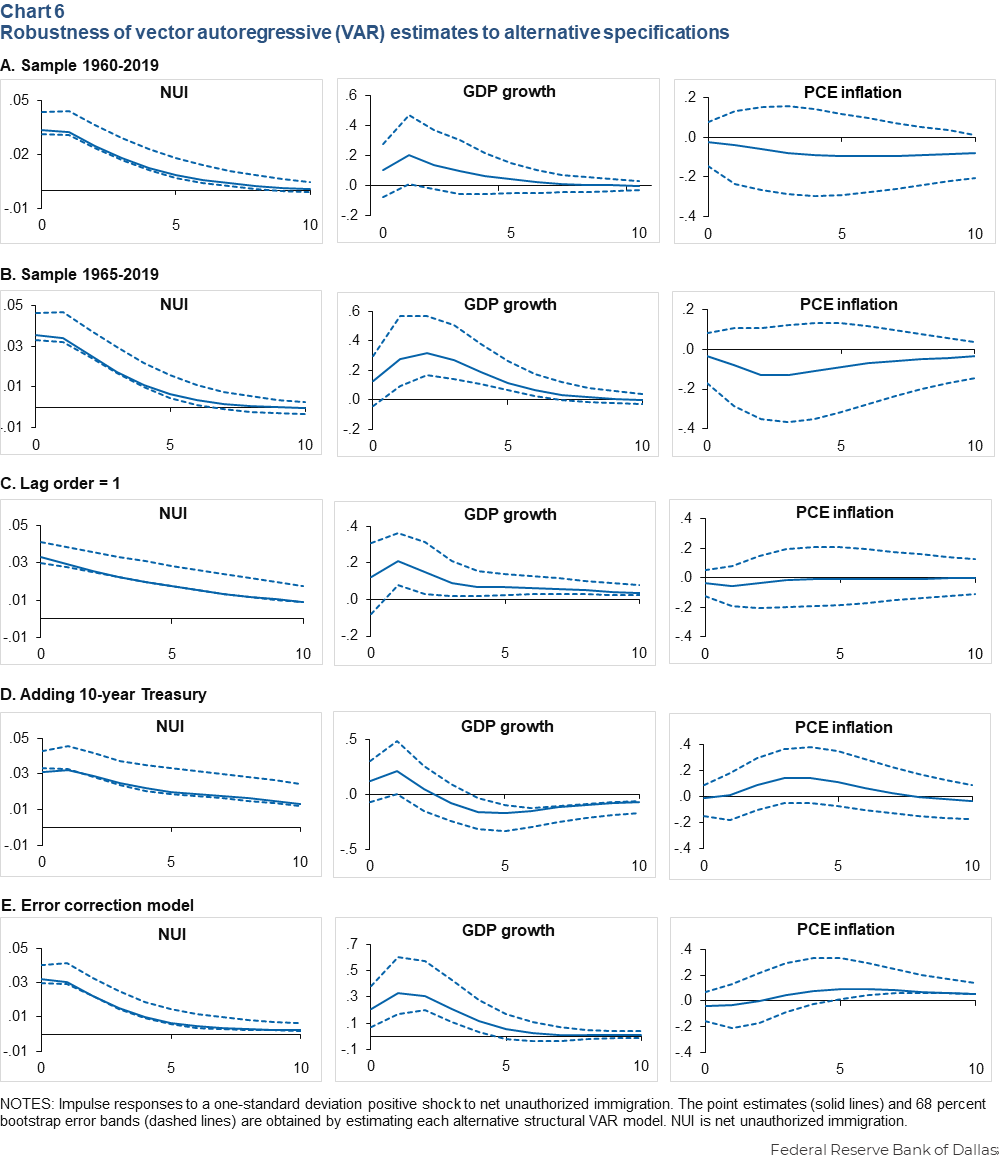
Chart 6 examines the robustness of our VAR estimates. We present five robustness checks: rows (A) and (B) consider alternative sample periods; row (C) considers a shorter lag order; row (D) augments the four-variable model with the 10-year Treasury yield; and row (E) considers an alternative error-correction-model specification in which ΔEMPt is replaced by the ratio of nonfarm payroll employment to GDP. In all specifications, output growth increases in response to a positive net unauthorized immigration shock, while the response of inflation is close to zero, suggesting that our model estimates in Chart 5 are robust.
Potential effects of immigration policy in 2025–27
We now use the estimates from the model in Chart 5 and the hypothetical future paths of net unauthorized immigration in Chart 3 to conduct scenario analysis. The construction of confidence bands around these predicted effects is nontrivial and beyond the scope of this study.
Table 1 summarizes the macroeconomic effects of immigration restrictions in each scenario. The baseline scenario projects that the reduction in net unauthorized immigration will cause GDP growth to be 0.81 percentage points below the benchmark in 2025. The four other scenarios project GDP growth between 0.75 and 1.01 percentage points below the benchmark. The self-deportation wave scenario has the largest effect because the exodus of immigrants is assumed to occur in the near term.
Table 1. Effects of immigration shocks on GDP and inflation by scenario
| GDP growth | 2025 | 2027 |
| Baseline scenario | -0.81 | -0.49 |
| High interior deportation | -0.83 | -0.84 |
| Self-deportation wave | -1.01 | -0.45 |
| Mass interior deportation | -0.89 | -1.49 |
| No interior deportation | -0.75 | -0.38 |
| PCE inflation | ||
| Baseline scenario | 0.15 | 0.06 |
| High interior deportation | 0.15 | 0.12 |
| Self-deportation wave | 0.18 | 0.06 |
| Mass interior deportation | 0.16 | 0.21 |
| No interior deportation | 0.14 | 0.05 |
| NOTE: Estimates are shown in percentage points relative to the counterfactual benchmark of GDP growth or PCE inflation implied by the Congressional Budget Office’s immigration projection published in January 2025. | ||
Reduced immigration inflows at the border, not deportations, account for most of the negative effect on GDP growth. In fact, reduced border inflows account for 93 percent of the projected reduction in GDP growth in the baseline scenario.
In 2027, GDP growth is predicted to be between 0.49 to 1.49 percentage points below the benchmark, depending on the extent of interior deportations. The mass interior deportation scenario, in particular, predicts a larger negative effect on growth. In all scenarios, the inflation effects are modest, about 15 basis points above the benchmark in 2025 and 5 to 21 basis points higher in 2027. The modest inflation effects are consistent with recent studies using quantitative macroeconomic modeling.
These effects represent the most likely outcomes of the policies given the historical data. The limited availability of historical data and its annual frequency means these estimates are highly uncertain. However, this does not mean the results are not informative.
There is good reason to be concerned that immigration policies that lead to a reduction in net unauthorized immigration relative to historical trends, all else equal, are likely to significantly lower real GDP growth relative to the counterfactual. Moreover, related studies are in line with our results. A Brookings Institution article estimated a low-immigration scenario with negative net immigration would lower real GDP growth by 0.4 percentage point in 2025. A Peterson Institute working paper estimated a mass deportation scenario in which 1.3 million unauthorized immigrant workers are removed from the U.S. would lower real U.S. GDP 2.7 percent from 2025 to 2028.
Conclusion
We propose a new empirical approach to studying the macroeconomic effects of unauthorized immigration. Leveraging historical variation in unauthorized immigrant flows, the model estimates suggest an unexpected rise in net unauthorized immigration increases U.S. GDP growth with little effect on inflation. These estimates are useful for examining the potential effects of a reduction in net unauthorized immigration. Our analysis raises the concern that a sharp tightening of immigration policies has the potential to substantially reduce output growth.
Notes
- For simplicity, we henceforth refer to this group as unauthorized immigrants, but some of them have temporary legal permission to live and work in the U.S.
- We supplement the DHS data needed to construct net unauthorized immigration with two other sources to fill in missing information in the recent period. First, removals data have not been updated since November 2024, so we impute them using Syracuse University’s Transactional Records Access Clearinghouse data on the number of Immigration and Customs Enforcement (ICE) detention book-ins. These data are strongly correlated with interior removals. Second, the official Border Patrol estimate of gotaways is not available after 2022. In this case, we infer gotaways using DHS press releases and news articles that cite data from Freedom of Information Act (FOIA) requests filed with Customs and Border Protection.
- The federal government fiscal year has run from Oct. 1 to Sept. 30 since 1976. Before that, it was July 1 to June 30.
- To impute gotaways for 1955–2009, we use the ratio of gotaways to encounters in the Yearbook of Immigration Statistics data (about 18 percent). We then add 15 percent to the entire gotaway series to correct for what DHS officials estimate is the average undercount in their published estimates.
About the authors

Pia Orrenius is a vice president in the Research Department at the Federal Reserve Bank of Dallas.

Grace Ozor is a former research analyst in the Research Department at the Federal Reserve Bank of Dallas.

Madeline Zavodny is a professor of economics at the University of North Florida.

Xiaoqing Zhou is an assistant vice president in the Research Department at the Federal Reserve Bank of Dallas.