
Impact of COVID-19 on small service firms clouds Texas jobs estimates
The 2020 downturn has differed from past recessions in many ways. It has particularly affected high-contact service industries such as restaurants, bars, hotels, retail establishments and personal services. These contain a large number of independent businesses with few employees.
The concentration of such smaller firms creates a special challenge for the Bureau of Labor Statistics (BLS) because the agency undersamples small firms in its jobs survey. This gives rise to questions regarding the comprehensiveness of the data underlying estimates of job losses and gains in Texas this year.
Current employment statistics
The BLS provides one of the most commonly used gauges of the health of the national, state and metro economies, the monthly Current Employment Statistics (CES). The CES, also known as the establishment survey or the payroll survey, is made up of two parts.
A majority of the series is based on unemployment insurance records and reported in the Quarterly Census of Employment and Wages (QCEW). It covers approximately 97 percent of total nonfarm jobs. Because these records are only available with a considerable lag, the BLS captures more recent changes through a second source, a business survey accounting for 31 percent of U.S. nonfarm jobs.
To efficiently cover the majority of jobs, the BLS concentrates this survey on larger firms. In March 2018, U.S. private firms with at least 500 employees represented 37.8 percent of all jobs (0.5 percent of firms) but 80.4 percent of all jobs in the sample (12.1 percent of firms).
Meanwhile, private firms with 49 or fewer employees accounted for 29.5 percent of all jobs (93.8 percent of firms) nationwide but only 2.3 percent of the jobs in the sample (58 percent of firms).
The BLS recognizes that sample misrepresentation can bias the results and takes steps to reduce it by giving higher weights to smaller firms. For example, if one in every 100 businesses is selected from the smallest employment size class, it is assigned a weight of 100 because the response represents itself and the 99 other firms not sampled.
While this bias adjustment worked well in the past, the undersampling of small firms during the pandemic may result in larger errors—positive and negative—than normal.
Every March, with the release of January data, the BLS benchmarks the state-level CES estimates through September of the previous year by replacing survey estimates with those derived through the QCEW. When Texas data for January 2020 were released, the annual benchmarking covered the period through September 2019.
Until the next benchmarking in March 2021 (covering the period through January 2021), the less-comprehensive CES will extend the data series by four to 15 months.
The Dallas Fed, seeking to get a more comprehensive view of regional growth, early benchmarks Texas jobs data by utilizing the QCEW as soon as it is released each quarter. Figures for each month in first quarter 2020 were released Aug. 19, and current data from the Dallas Fed are early benchmarked though March.
These revisions adjust for sampling errors and other factors, such as seasonal factors and birth and death adjustments. The large swings in jobs during the second quarter likely influenced the usual seasonal factors.
Historically small Texas revisions
Texas has had the smallest average benchmark revisions among the states since 2007, a recent study found. During the most recent early benchmarking, with first quarter 2020 QCEW data, the Dallas Fed revised the March annualized employment growth rate for Texas to show a more profound contraction than initially estimated, –5.2 percent from –4.1 percent (Chart 1).
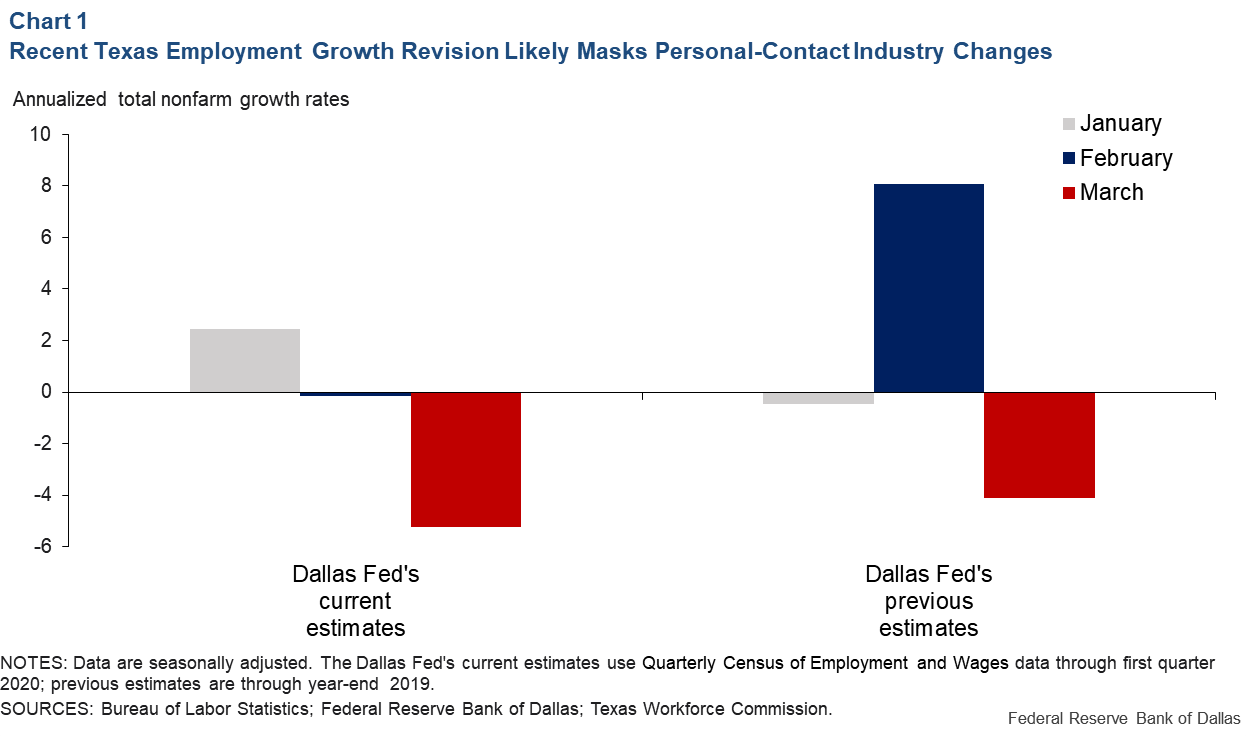
While the March revision was smaller than revisions for both January and February, it masked large changes within high-personal-contact industries.
First-quarter benchmarking sheds light on future revisions
The size of job revisions across sectors of the economy in the first quarter varied widely; some of the largest ones were in leisure and hospitality, retail and personal services.
In the revision for March, the month when the pandemic widely hit the United States, accommodation (hotels) and grocery stores experienced large upward revisions, while building material, gardening equipment and supplies, clothing stores, repair and maintenance, and personal and laundry services were revised lower (Chart 2).
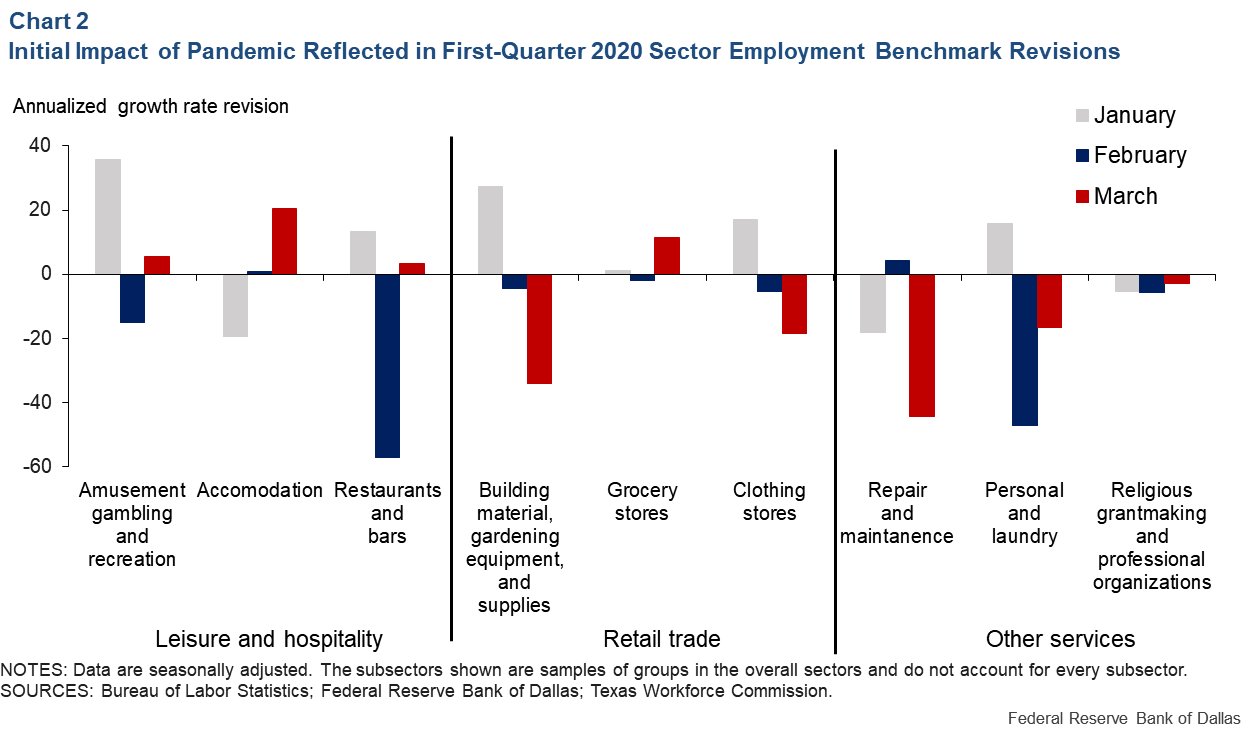
Restaurants and bars and personal and laundry services had experienced large revisions in February. The much weaker activity revealed in the revisions could be due to some establishments taking a cautious approach to hiring because of a lack of clarity at the time over whether COVID-19 would significantly affect the U.S.
There were some large, mostly upward, revisions in January as well. This is not unusual since revisions tend to be larger in January, when the BLS reclassifies firms in the QCEW if their main production item changed.
Looking toward second-quarter revisions
The revisions for the first quarter suggest the pandemic most affected high-personal-contact sectors dominated by small businesses. These sectors are difficult to survey and, thus, susceptible to large revisions. The mix of upward and downward revisions partially offset each other in the quarter, resulting in a moderate downward revision to total nonfarm jobs.
The overall story from the jobs data isn’t likely to change with the second-quarter benchmark. Texas was hit hard by the pandemic and experienced historic job losses. However, the unique nature of this downturn and its impact on service industries dominated by small, high-personal-contact businesses suggests that revisions will also be particularly large for those affected sectors. Although the pandemic had just begun affecting the Texas economy during the first quarter, initial first-quarter data revisions were already sizable for these industries.
The QCEW data for second quarter 2020 were released Nov. 12. The Dallas Fed will publish the early benchmarked CES through June on Nov. 20 to coincide with October job estimates.
About the Authors

Emma Marshall
Marshall is an economic programmer/analyst in the Research Department at the Federal Reserve Bank of Dallas.

Keith R. Phillips
Phillips is an assistant vice president and senior economist in the San Antonio Branch of the Federal Reserve Bank of Dallas.
The views expressed are those of the authors and should not be attributed to the Federal Reserve Bank of Dallas or the Federal Reserve System.