
Systemic risks, interdependencies weigh on 2021 global outlook
The path of economic recovery from the COVID-19 recession remains far from clear. A fitful rollout of vaccines and governmental responses to new variants of the virus loom over a global growth rebound that private forecasters estimate at 5.5 percent for 2021.
Downside risks arise from the speed with which the pandemic has spread, underscoring how common shocks and interdependencies across countries are important considerations.
How do we estimate risk?
We assess the global outlook for 2021 using Consensus Forecasts data for 39 countries, covering 78.4 percent of global gross domestic product (GDP) in 2019. These data, drawn from private forecasters’ range of outcomes, describe likely real GDP growth in the individual countries.
These estimations were formed in late December 2020 and, hence, each of the 39 forecast distributions incorporates knowledge of the most recent developments—the third wave of the virus infection, vaccine availability and distribution challenges, and the result of the 2020 U.S. election.
Forecast distributions fitted to this data permit the exploration of multiple dimensions of perceived country risk. A standard deviation is a statistical measure of the dispersion of outcomes around the mean of the distribution and is conventionally also used as a measure of risk. A high standard deviation suggests a riskier outlook.
If a forecast distribution is normal (graphically resembling a bell curve), the standard deviation suffices to assess country risk. But often we observe a forecast distribution that is not normal.
The likelihood of outcomes in the data is not always spread symmetrically around the mean forecast. Instead, the distribution can be skewed or tilted toward either end—known as the tails of the distribution. A negative skew commonly suggests that the tail is fatter on the side of the more negative outcomes. The kurtosis measures the combined likelihood of the tails of the distribution relative to its center. Accordingly, positive excess kurtosis indicates that the likelihood of extreme outliers in the tails is higher than in a normal distribution.
As the forecast distribution data increasingly differ from normal—as measured by skewness and kurtosis—the greater the insufficiency of the standard deviation as a measure of risk.
Table 1 summarizes skewness and kurtosis for risk observed in each of the 39 countries’ GDP forecast distributions. It illustrates the degree of heterogeneity across countries and the importance of tail risk in the 2021 outlooks for many of them.
Table 1: Summary Statistics for the 39 Country Forecast Distributions
| Mean | Standard deviation | Skewness | Excess kurtosis | |
| Minimum | 2.2 | 0.4 | -1.3 | -1.1 |
| Average | 4.4 | 1.2 | 0.1 | 0.3 |
| Maximum | 11.0 | 2.2 | 0.9 | 1.3 |
A bottom-up view of global risk
The COVID-19 crisis has vividly illustrated that tail events are real and relevant and that systemic risk—understood as the likelihood that tail events occur simultaneously—cannot be ignored either.
In other words, even though private forecasters offer a window into individual country outlooks for 2021, we recognize that outcomes at the tails of the distribution might be interdependent across countries. For instance, if COVID-19 were to mutate out of the range of the existing vaccines, it is safe to expect bad outcomes across the board.
Unfortunately, we do not observe directly how the prospects in one country may depend on those of other countries. Copula modeling permits us to capture the extent to which outcomes across countries are interdependent. There are different parametric types that are easy to estimate, with the Clayton copula and t copula the most useful to our analysis because they highlight dependencies among tail events across countries. This is helpful as we gauge tail risks to the 2021 global outlook.
We estimate these dependencies using historical data from 1994 to 2019 over the Clayton copula and t copula. While both copula types display tail risks, the Clayton further introduces a degree of asymmetry (or skewness).
We visualize in Chart 1 how both copulas compare with the independent copula that precludes any form of dependency. The distributions on the margins of each subplot represent the country-specific forecast distributions for generic country A and country B.
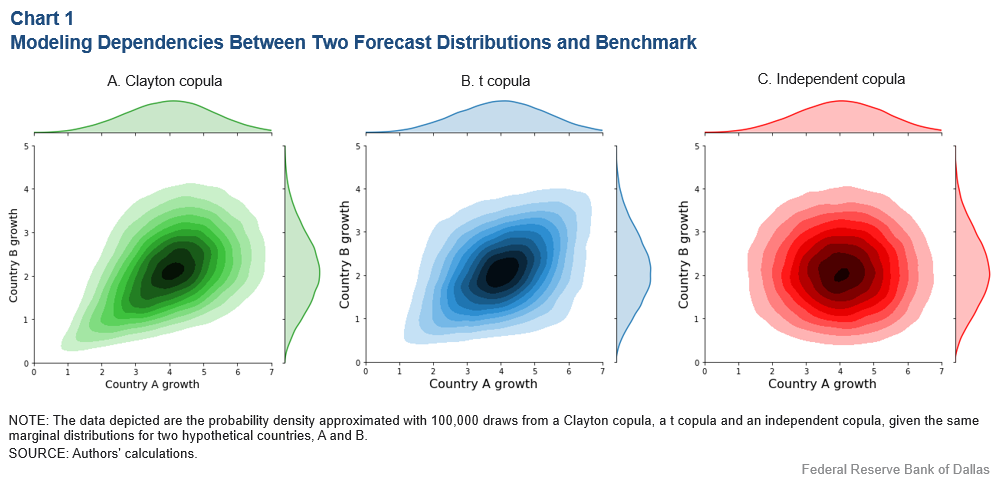
Inside each subplot, the shading illustrates the joint probability of outcomes in both countries—darker shading showing a greater likelihood.
Adopting an independent copula (the rightmost subplot), country A and B’s outlooks are uncorrelated. In contrast, using the Clayton copula (leftmost subplot) introduces a degree of association between the growth forecasts of both countries that becomes tighter for outcomes on the left tail of both distributions. The t copula shows similar patterns on both tails. Hence, very poor growth outcomes occurring jointly are more likely under either dependency structure.
Systemic risk matters
Chart 1 illustrates that our global risk assessment can be seriously biased when the assumption of cross-country independence is violated. Therefore, we choose to impose the historical dependencies as estimated in the data with both a Clayton and a t copula.
With each copula and the country distributions recovered from Consensus Forecasts, we construct a joint distribution over possible outcomes for all 39 countries in our sample. Using those joint probabilities, we derive the distribution of the global output growth forecast for 2021, weighting each country according to its share of purchasing-power-parity-adjusted global output in 2019. Purchasing power parity provides a common basis of valuing output across countries.
Chart 2 plots the resulting set of mean estimates and confidence bands derived under the assumption of stronger tail dependency (green and blue bars) and the independence assumption (red).
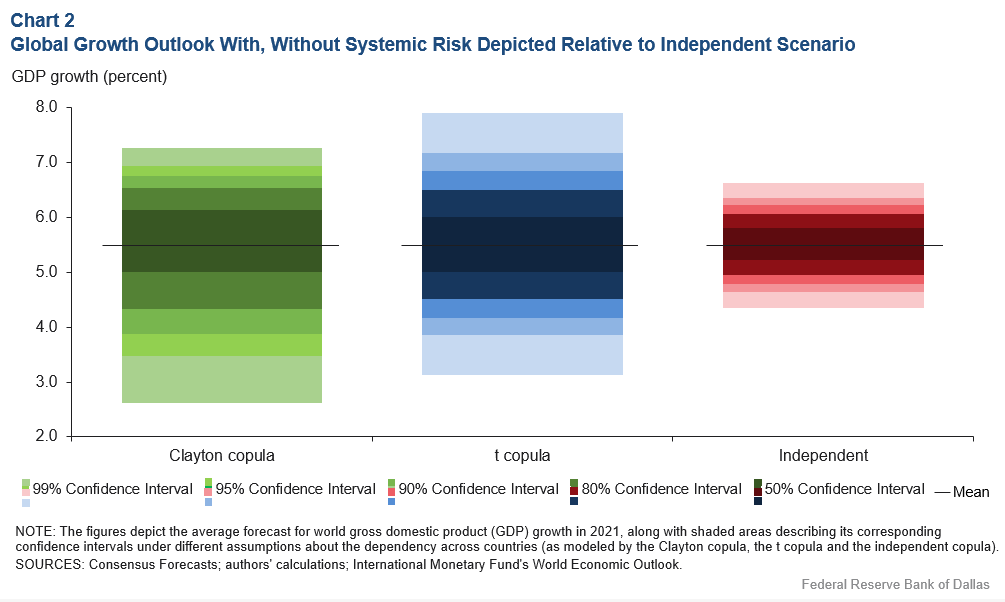
The nature of dependency has little effect on the mean global growth forecast of 5.5 percent. Differences can be seen, however, in the level of dispersion between the different dependency structures. We argue, therefore, that ignoring systemic risk may result in severely underestimating the degree of uncertainty about the global outlook for 2021.
The Clayton copula, moreover, suggests not only that there is higher dispersion in the forecast, but also that, if anything, the balance of risks appears tilted to the downside. This highlights the snowball effect that bad outcomes in one country can have on the global economy.
Tail risk complicates global outlook
2020 was a rather dire year for the global economy, which contracted an estimated 3.6 percent based on forecast data available as of December 2020, according to the Database of Global Economic Indicators.
Forecasts for 2021 anticipate a strong rebound, though this outcome comes with a high degree of uncertainty because of the widespread systemic risks that the pandemic poses.
Our analysis, partly informed by the private forecasters’ balance of country risks, highlights the importance of cross-country dependencies and tail risk on the global outlook. Policymakers as well as households and firms should remain attentive to whether those correlated tail risks materialize and be prepared to manage them in real time.
About the Authors

Jarod Coulter
Coulter is a research analyst in the Research Department at the Federal Reserve Bank of Dallas.

Enrique Martínez-García
Martínez-García is a senior research economist and advisor in the Research Department at the Federal Reserve Bank of Dallas.
The views expressed are those of the authors and should not be attributed to the Federal Reserve Bank of Dallas or the Federal Reserve System.