Energy Indicators

May 8, 2020
Falling demand and rapidly rising inventories caused crude prices to collapse in April, breaching negative territory for the first time in history. In response to market prices and logistical constraints, the industry has had to sharply curtail drilling and completion activity. Oil and gas mining jobs in the U.S. and Texas declined modestly in the most recent releases, which reference February and early March. Since then, initial claims for unemployment have surged in the sector, notably in the energy-dominated Midland and Odessa region.
Prices
Oil prices plunge
Prices for crude oils fell further in April as weak demand from refiners and consumers drove production into storage. The average daily closing price for global benchmark Brent was $18, while Houston averaged $19 (Chart 1). Spot prices at regional hubs traded lower, with West Texas Intermediate (WTI) priced in Midland at $17 and Bakken averaging $9.
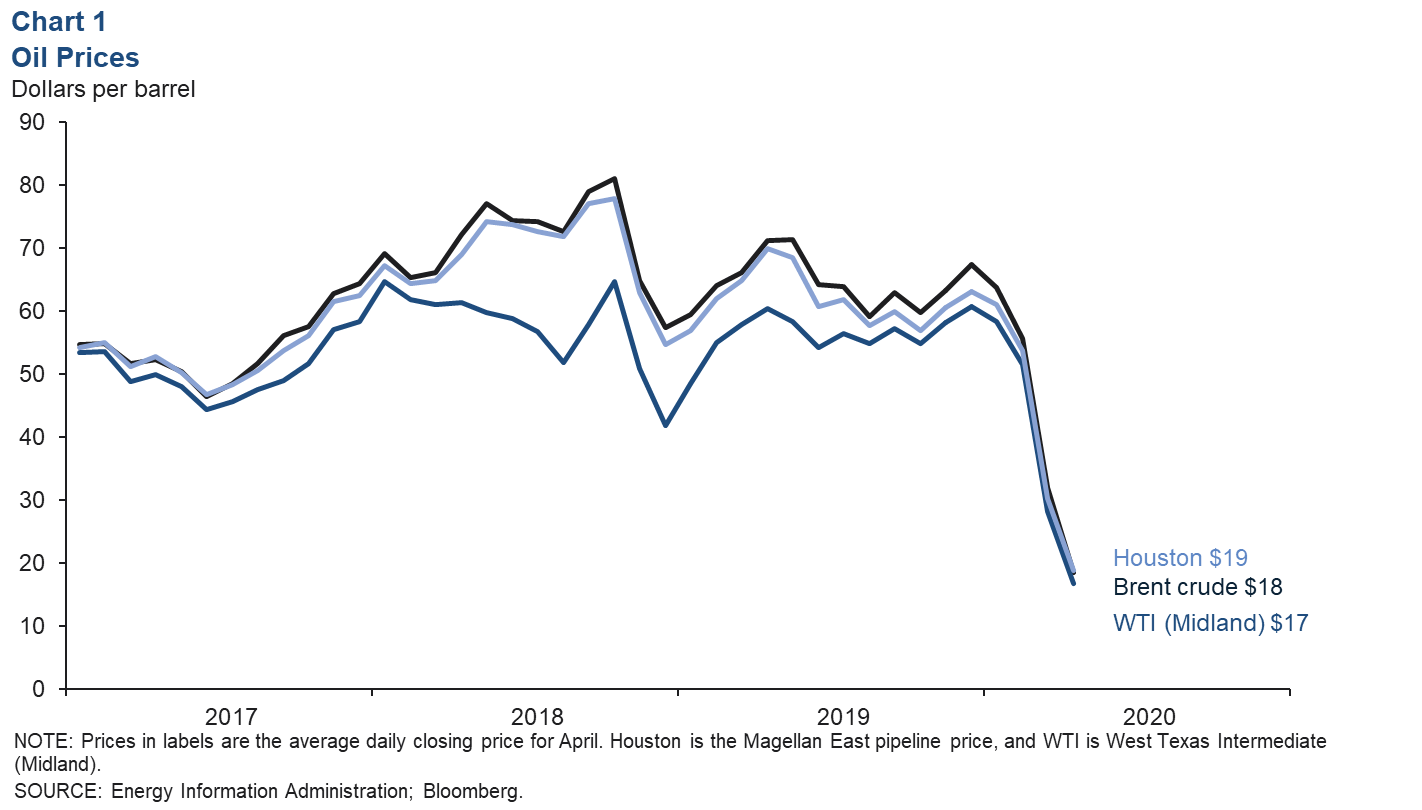
WTI crude futures contracts for May delivery traded below zero for the first time in history on April 20, 2020, as rapidly depleting spare crude storage capacity left many futures market investors unable to find buyers at a positive price before having to close out their positions due to market rules. As funds flowed into the June contract the last week of April, the futures contract for delivery of a barrel WTI in June averaged under $15, down from $27 for the week ending April 17.
Gas prices also soften
Henry Hub natural gas slipped to an average daily close of $1.74 in April (Chart 2). In West Texas, the Waha benchmark for natural gas averaged 27 cents. Natural gas prices have softened due in part to a drop in domestic demand from power, refining and chemical producers.
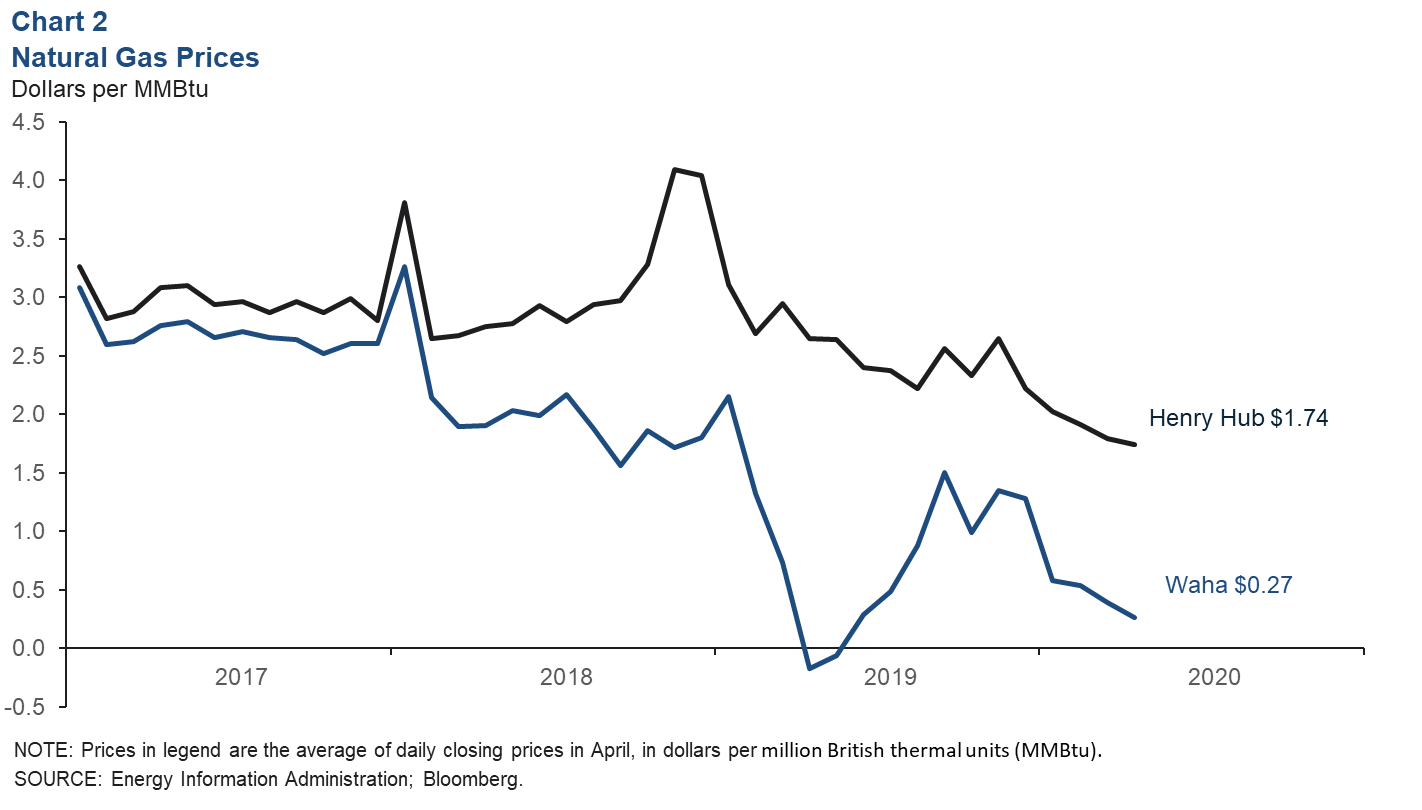
Natural-gas-fired generation was down over 13 percent from the first half of March to mid-April, according to data from the Energy Information Administration (EIA). Refineries and chemical plants consume natural gas for power and heat, and as raw material for products such as petrochemicals, fertilizer and industrial hydrogen. Refinery utilization was down to nearly 72 percent in April, and weekly railcar loadings of chemicals suggest chemical capacity utilization—already down to 74 percent in March—fell further in April.
Inventories
Commercial crude stocks held at tanks in Cushing, Oklahoma, rose to nearly 63.4 million barrels (mb), up from 42.8 mb at the end of March (Chart 3). The rapid rate of increase—the result of refineries curtailing the amount of crude they process and producers increasing output—has many concerned Cushing may run out of space in the weeks ahead. Weekly data from the EIA and satellite-based information from firms such as Kayrros suggested that increases the week of April 28 had slowed, and comments from industry contacts indicate that production shut-ins are underway due to low prices and midstream constraints.
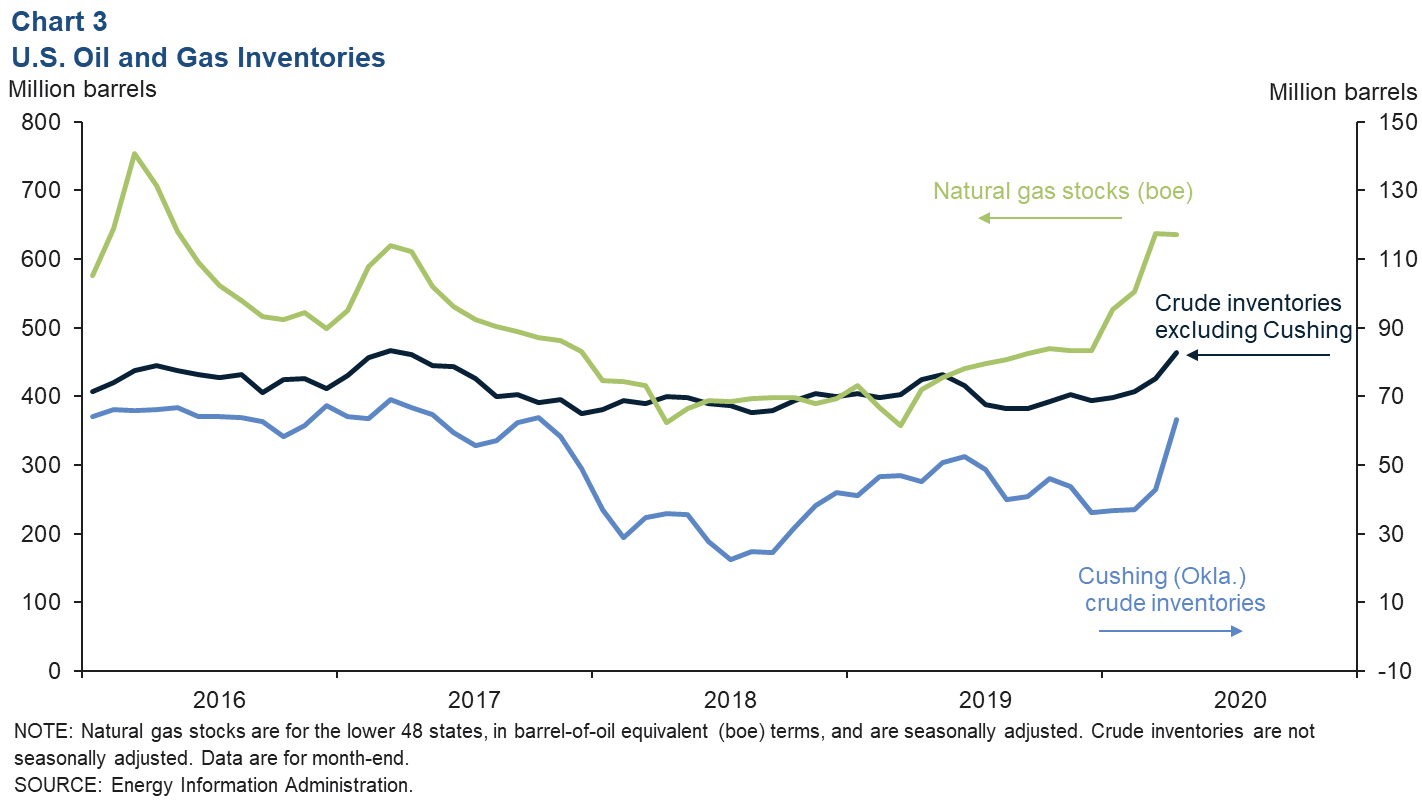
Commercial stocks across the rest of the U.S.—which exclude the strategic petroleum reserve—increased as of the week ending April 24 to 527.6 mb, the second-highest level in the data behind March 2017. Seasonally adjusted natural gas stocks reached 3.6 trillion cubic feet (or 615.8 million barrels of oil on an energy-equivalent basis)—the highest level since May 2016.
Drilling activity
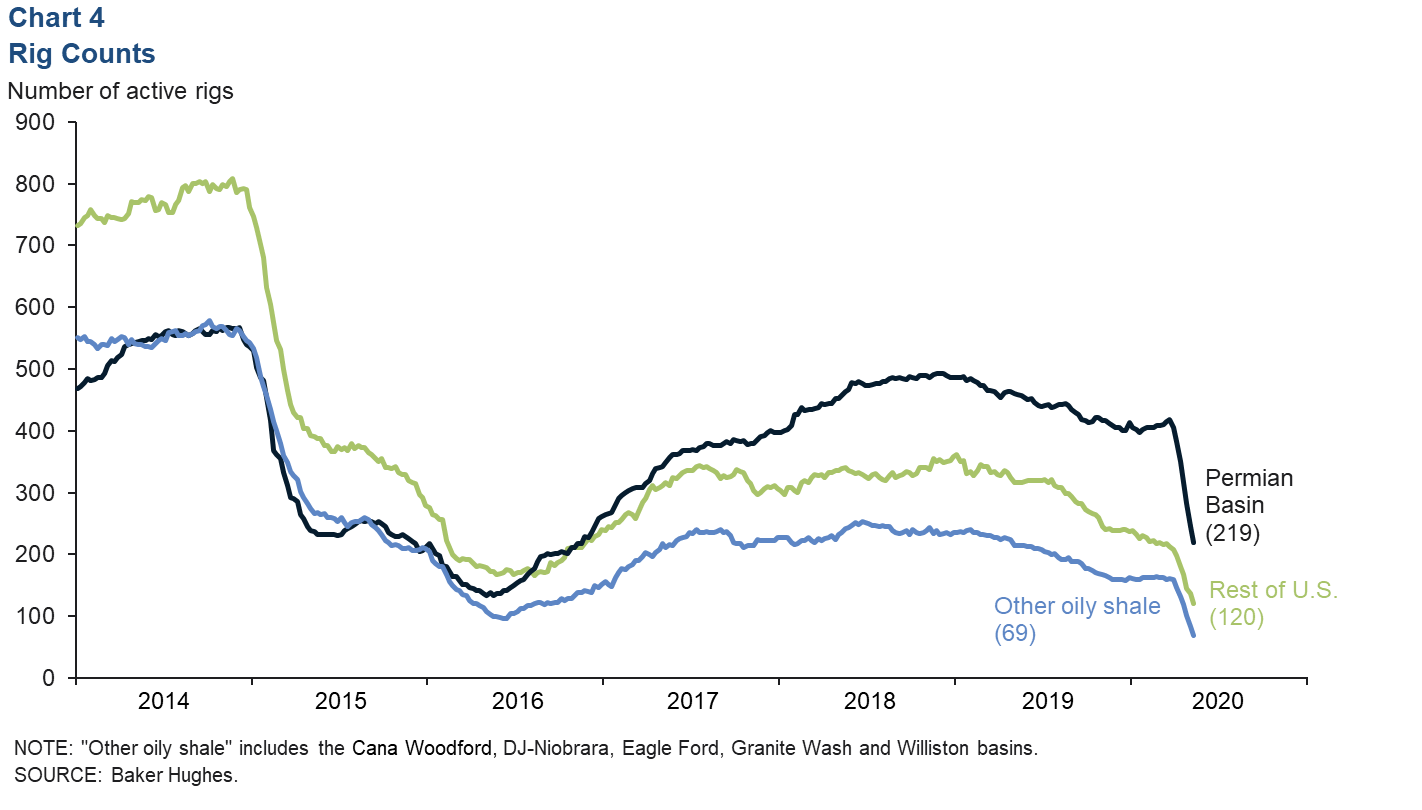
The number of active drilling rigs declined sharply in April. The Permian Basin rig count fell 43 percent to 219 from the end of March to the week ending May 1, its lowest level since November 2016 (Chart 4). Across other oil-focused basins, the count dropped by more than half to 69 rigs, and drilling in the rest of the U.S. dropped by nearly a third to 120 rigs. Information from industry contacts, satellite data and outlets like Rystad indicate that firms are also cutting back hard on well completions, with the number of active frack fleets dropping by more than half. The falloff in activity since March means demand for labor has fallen sharply.
Employment
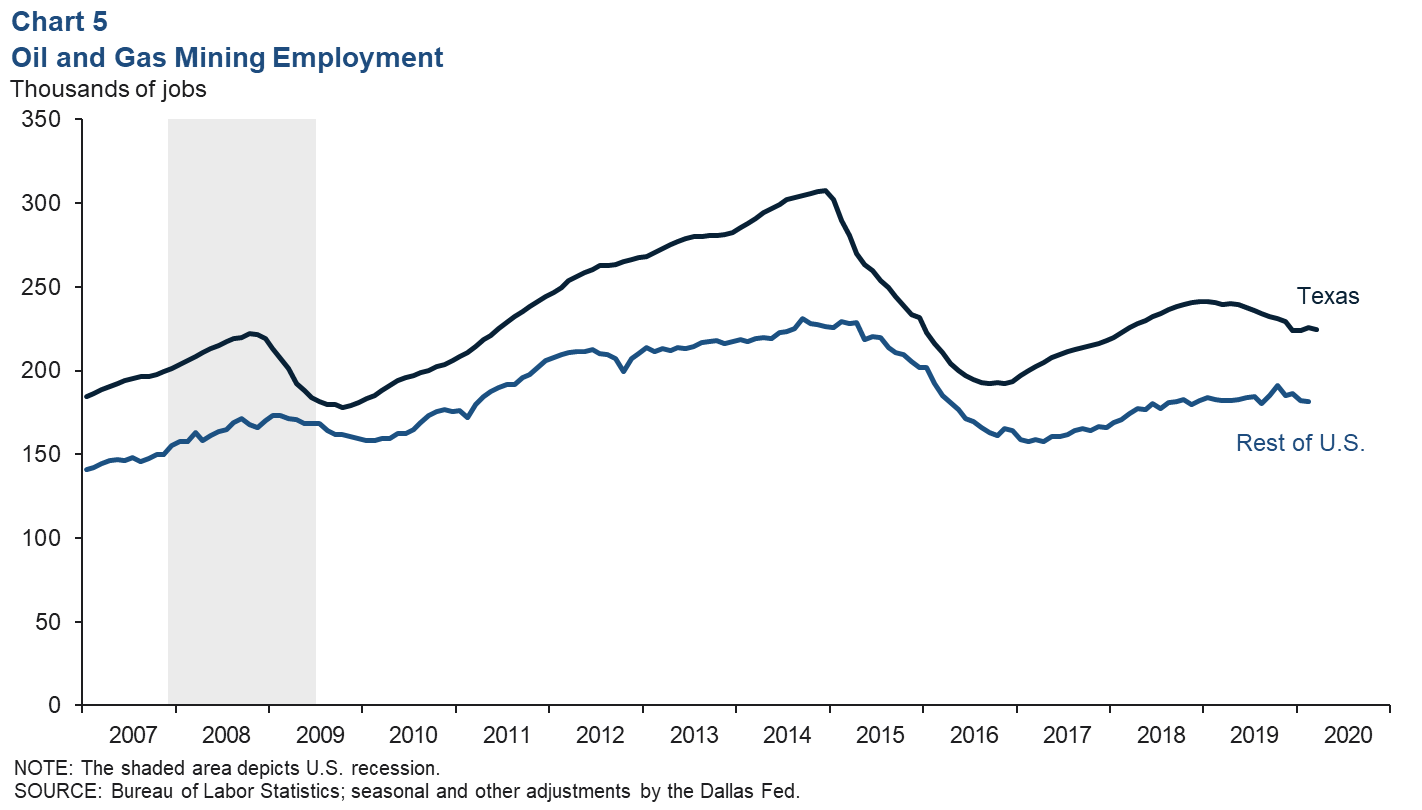
Texas mining payrolls post modest losses
Texas mining jobs data for March (based on a survey for the pay period that includes the 12th day of the month) showed a drop of 1,284 (Chart 5). The bulk of those losses came from support activities for mining, a sector representative of oilfield services firms. Jobs data for the rest of the U.S. declined in February. The fact that payrolls were little changed in Texas in the March survey underscores the sudden impact of COVID-19 containment in the second half of the month.
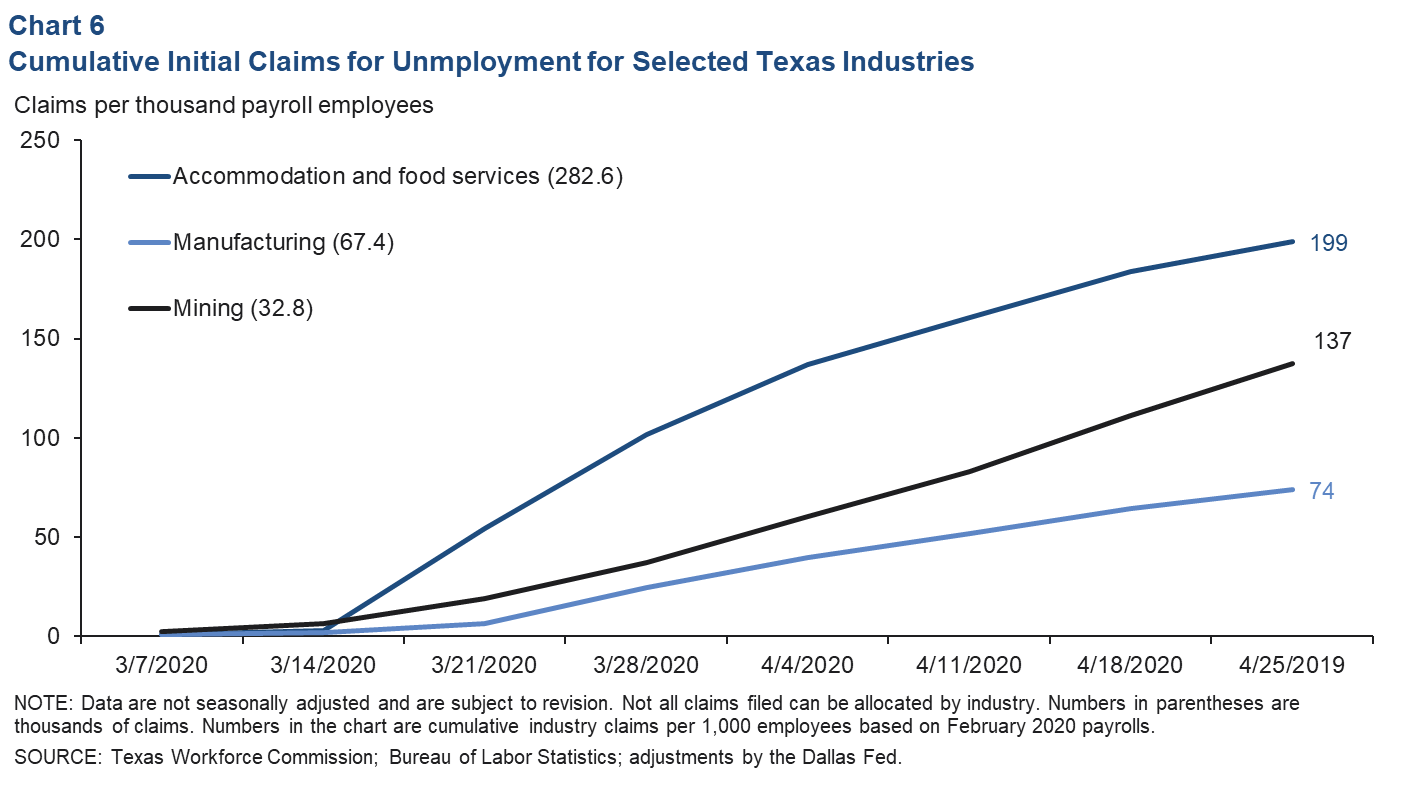
Initial claims for unemployment accelerating
Mandatory shelter-in-place orders have been a blow to Texas employment. The Texas Workforce Commission (TWC) reported a surge in weekly initial claims for unemployment benefits, with total statewide weekly claims climbing into the hundreds of thousands by the end of March. The TWC reports many of these claims by industry. The mining sector (almost entirely oil and gas) has seen a cumulative 32,800 claims filed from the week ending March 7 to the week ending April 25. That’s about 137 claims for every 1,000 jobs on mining industry payrolls in February (Chart 6).
Midland and Odessa indicators
Employment turns broadly negative
The Midland and Odessa combined metropolitan areas logged an annualized 6.4 percent drop in employment from February to March 2020 (-1,100 jobs) (Chart 7). The sharpest decline was in professional and business services (-200), but the sector that shed the most jobs was mining, logging and construction (-700).
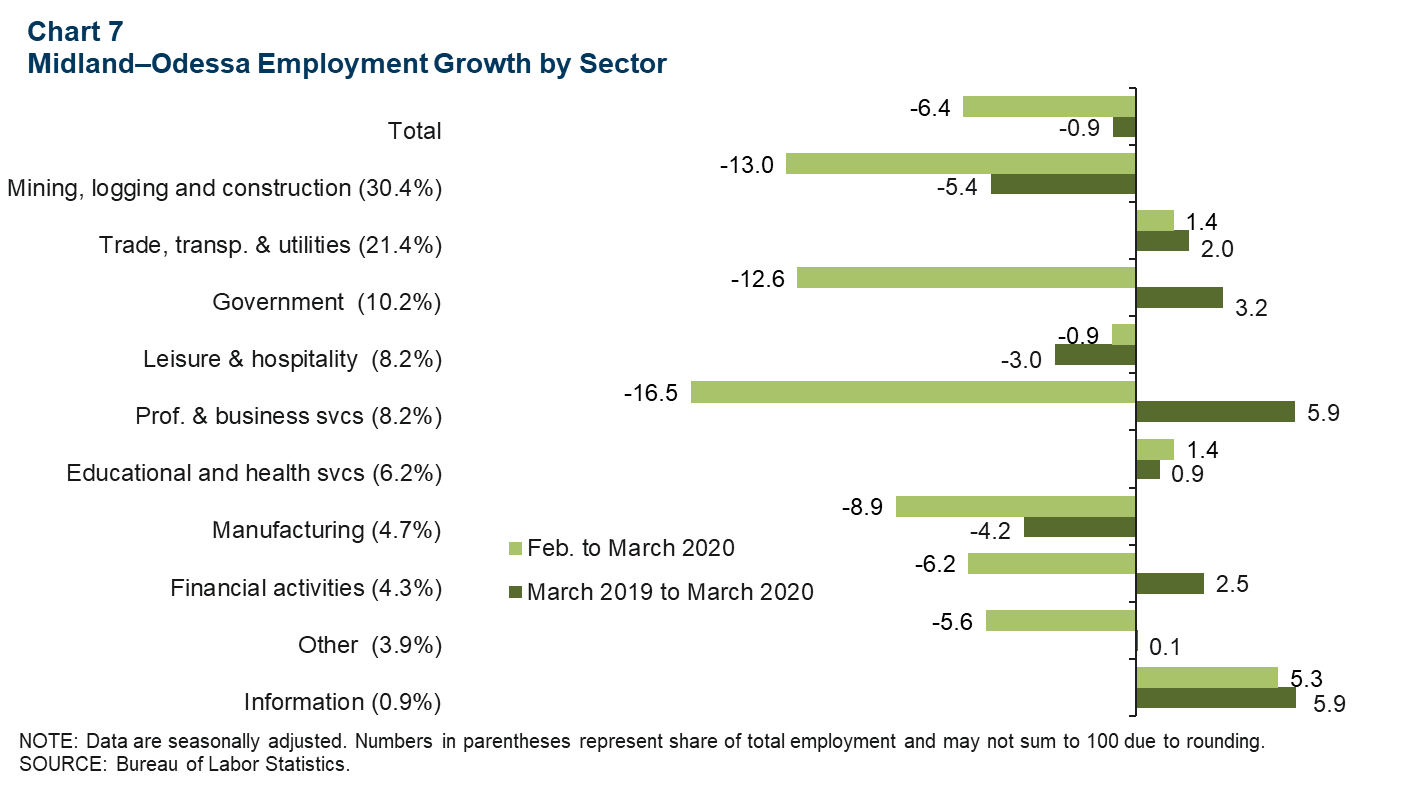
Compared with a year prior, total payroll employment fell 0.9 percent (1,700)—the steepest year-over-year drop since January 2017. The decline came as losses in goods-producing sectors (such as manufacturing and mining, logging and construction) overwhelmed broad-based growth in service-providing industries (such as leisure and hospitality, and professional and business services).
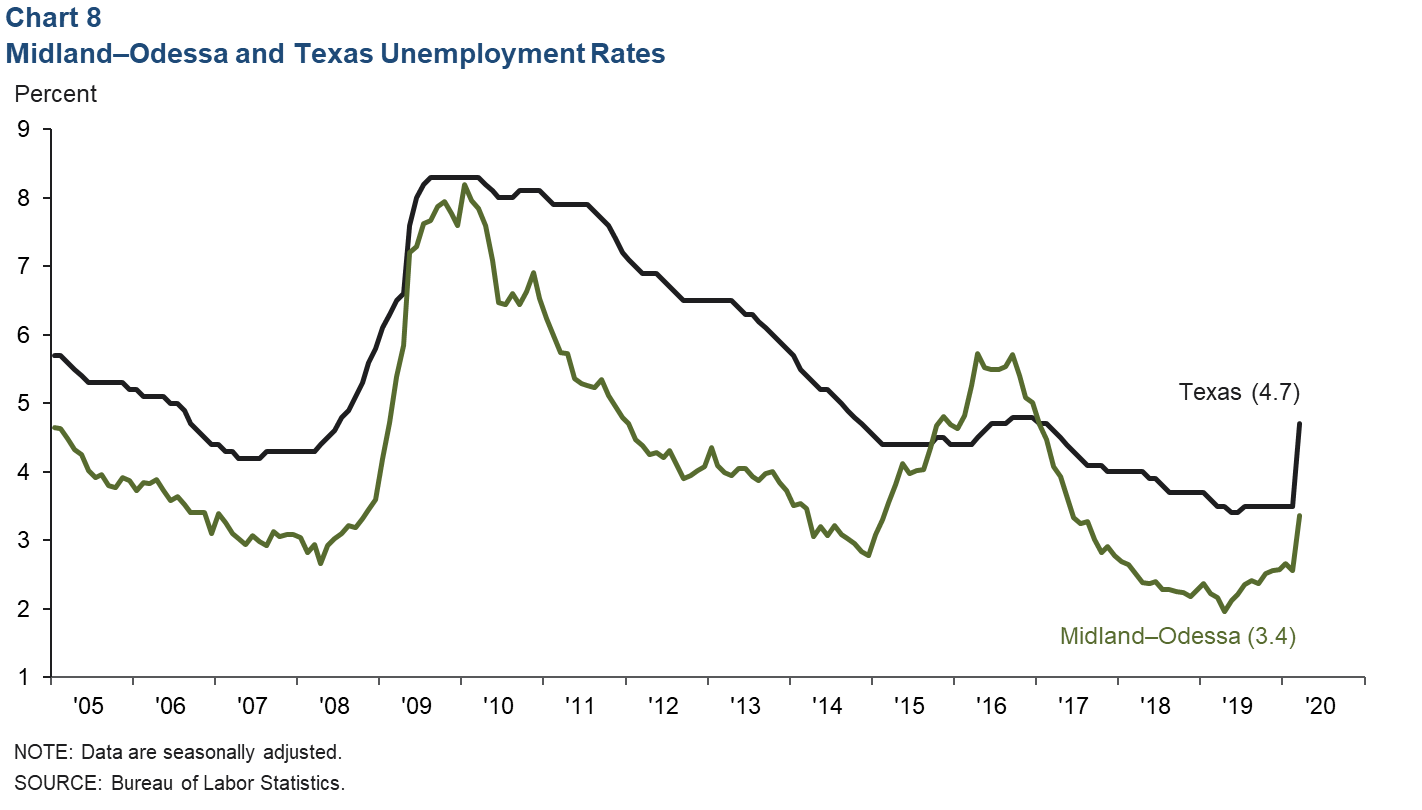
Unemployment rate spikes in March
The Bureau of Labor Statistics’ household survey showed a marked increase in unemployment in Texas during March. Midland and Odessa unemployment spiked to 3.4 percent (Chart 8). The unemployment rate statewide surged to 4.7 percent. Since mid-March, initial claims for unemployment allocated to the metropolitan area by the TWC have spiked relative to pre-coronavirus and year-ago levels and hovered in April near 3,000 claims each week. While there is no forecast for local unemployment rates, the state unemployment rate is projected to rise to 12.4 percent in April. Initial claims data suggest local unemployment rates may rise in kind.
About Energy Indicators
Questions can be addressed to Jesse Thompson at jesse.thompson@dal.frb.org. Energy Indicators is released monthly and can be received by signing up for an email alert. For additional energy-related research, please visit the Dallas Fed’s energy home page.