Houston Economic Indicators

April 28, 2020
Data for March in Houston have begun to show the effects of efforts to contain the coronavirus (COVID-19) pandemic. Employment contracted, the business-cycle index slowed, leading indicators were broadly negative, and the unemployment rate rose sharply for March. Weekly initial claims for unemployment insurance in April remained elevated. Existing-home sales contracted but remain at a healthy level. Taken together, the data paint a sobering picture of further declines ahead.
Employment
Job Count Sees Worst Fall Since 2009
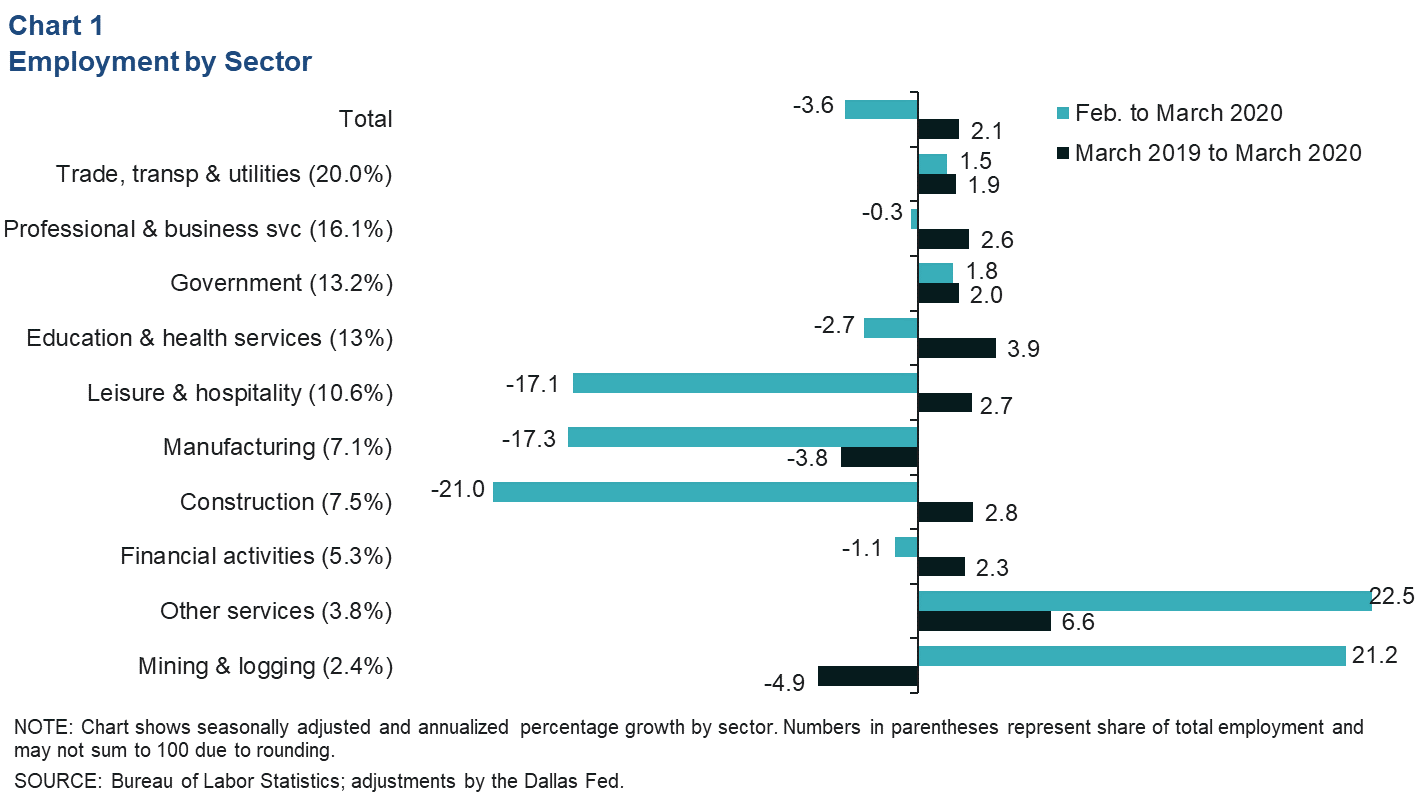
Initial estimates for the February-to-March change in employment (based on a survey for the pay period that includes the 12th day of the month) show a 3.6 percent annualized decline in total employment (-9,800 jobs), the sharpest one-month decline since August 2009 (Chart 1). Declines were led by leisure and hospitality (-5,300), construction (-4,800) and manufacturing (-3,600). Job gains were led by other services (2,000; includes various services such as auto mechanics, dry cleaners and animal boarding). Perhaps underscoring how drastic the recent weakness in oil markets has been since mid-March, the initial estimate for mining and logging jobs (almost entirely oil and gas) saw a sharp increase (1,200).
March Unemployment Rate Climbs
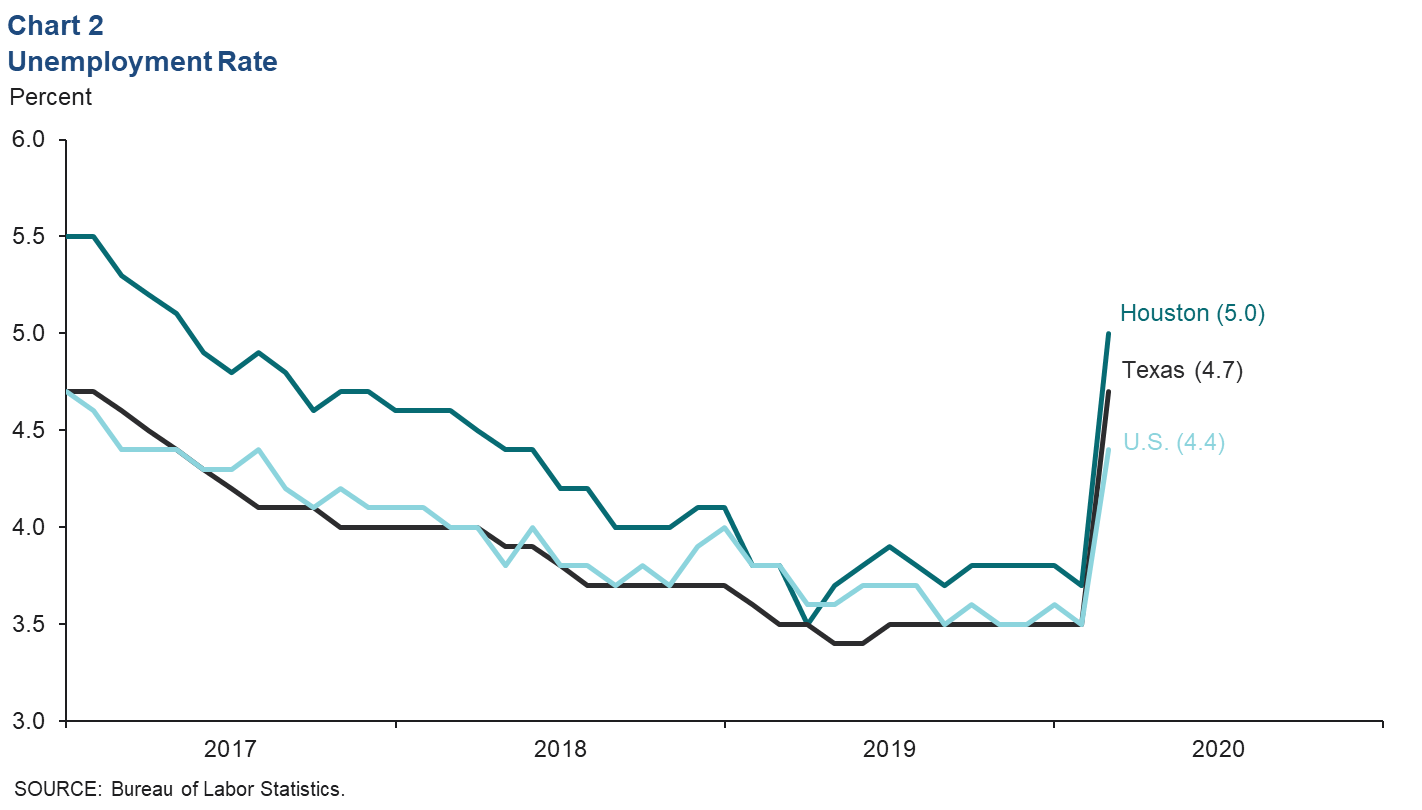
Unemployment rates shot up in March. Houston’s unemployment rate was 5.0 percent, Texas’ reached 4.7 percent, and the U.S. rate was 4.4 percent (Chart 2). Initial claims data for the past several weeks suggest that Texas unemployment is likely to more than double to 12.4 percent (with caveats), an increase likely to be mirrored by Houston, whose shares of Texas’ weekly initial claims filings have been persistent at 26–27 percent.
The size of Houston’s labor force (the sum of employed and unemployed persons) fell by 9.9 percent in March, the second-most-precipitous drop in the history of the data since 1990, though this is subject to revision. The biggest decline was 14.2 percent in January 2000. State-level data showed a 14.2 percent drop in the labor force in March by comparison. If those who lose their jobs exit the labor force, it may hold down the official unemployment rate.
Houston Weekly Unemployment Insurance Claims Slow
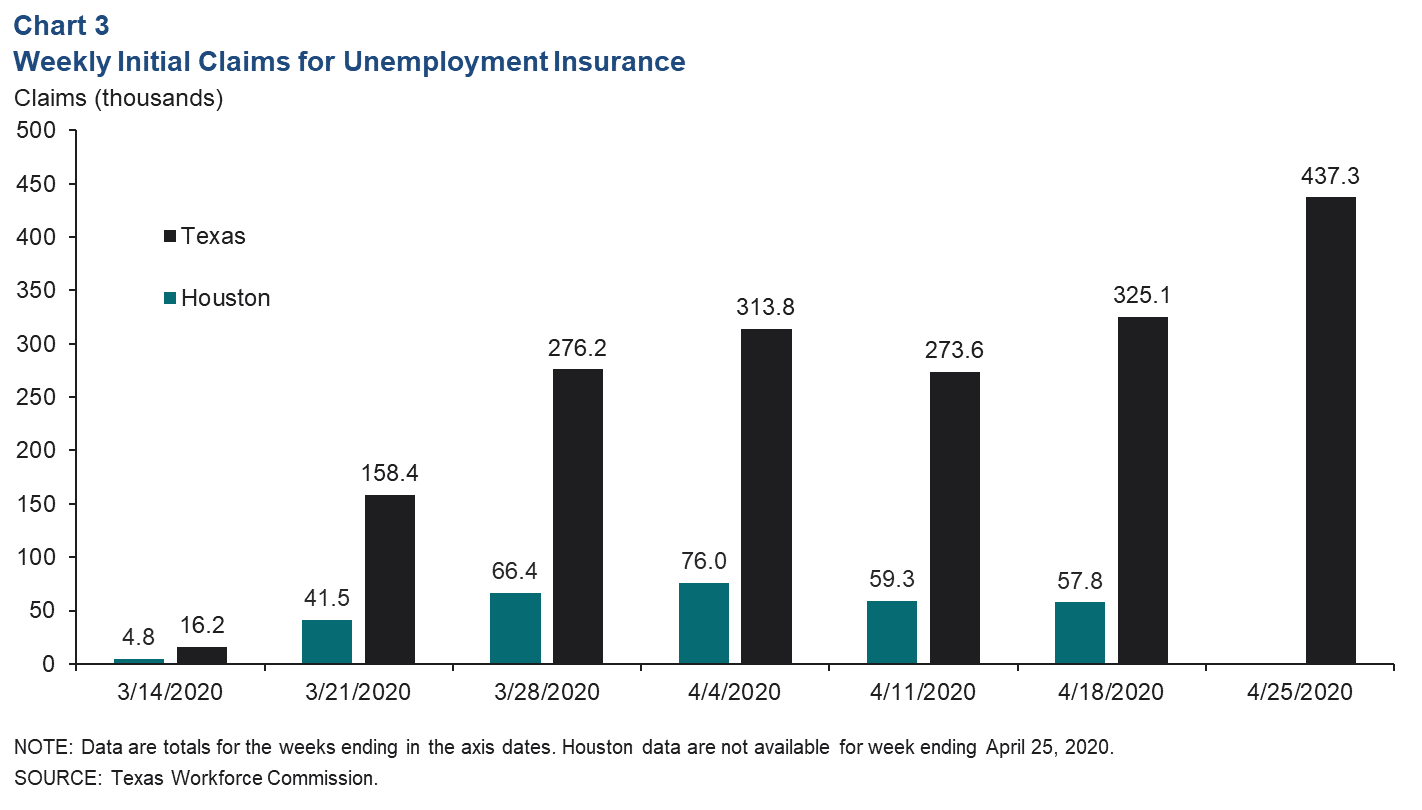
Initial claims for unemployment insurance in Houston slowed in mid-April but remain elevated. The number of claims allocated to the metropolitan area peaked the week of April 4 at 76,000 but had slowed to 57,800 the week of April 18 (Chart 3). However, state-level claims for the week ending April 25, 2020, increased to 437,300. When data become available, Houston may have seen a similar increase in claims. Statewide, claims from workers in the oil and gas sector have been late to rise relative to other sectors like leisure and hospitality, which were hard hit relatively early in the pandemic.
Business Cycle and Leading Indexes
Leading and Coincident Indicators See Sharp Drop
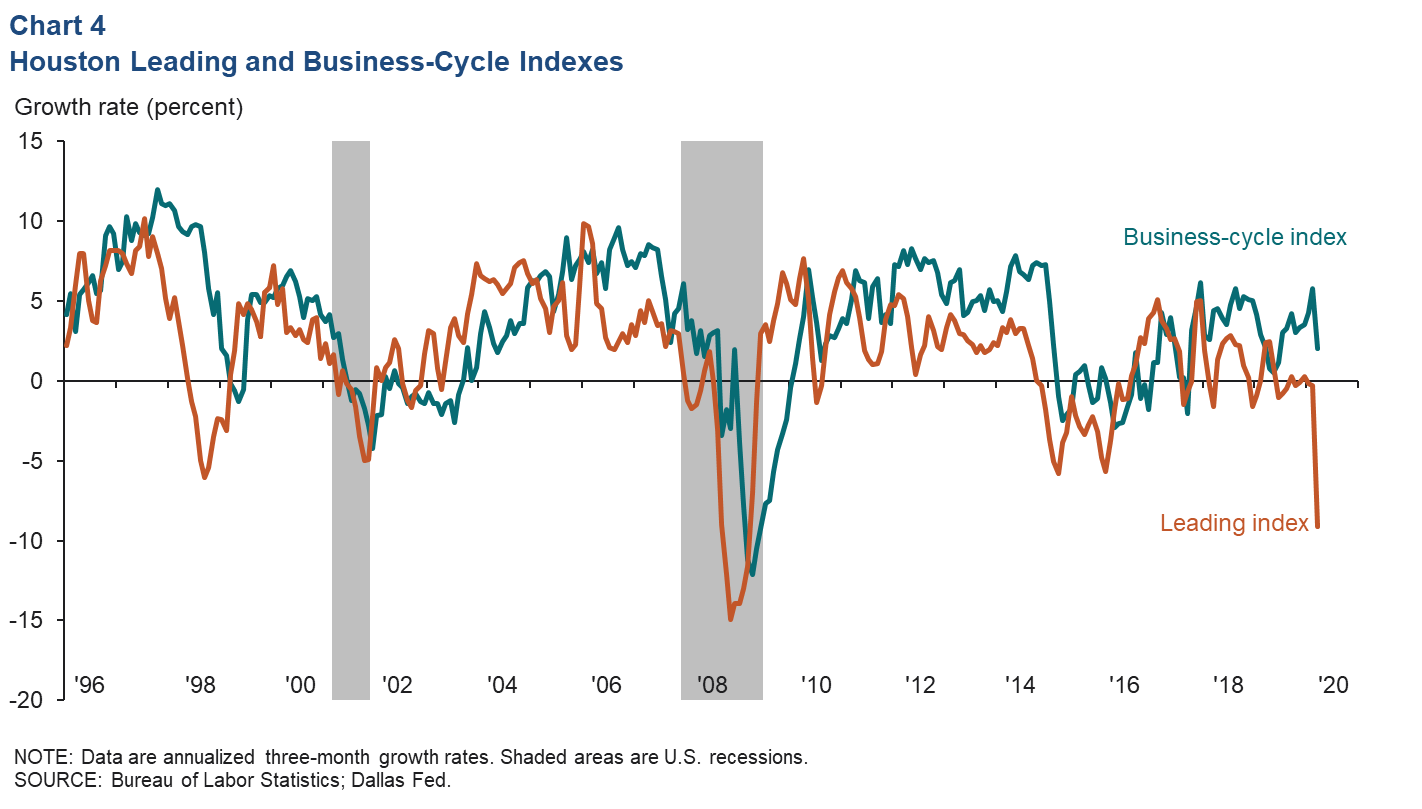
The Houston Business-Cycle Index slowed to a growth rate of 2.0 percent over the three months ending in March 2020, driven by the weak employment and unemployment data (Chart 4). In light of recent events, the index will likely be revised downward when wage and retail sales data—available with a lag—are incorporated. Leading indicators, an index of 10 series for Houston, declined by 9.1 percent over the three months ending in March. That’s the deepest three-month decline since March 2009, and it suggests that job growth over the next several months is likely to continue to contract.
Leading Index Components See Broad-Based Decline
The 9.1 percent annual drop in the leading index over the three months ending March 2020 was driven by March data. December 2019 to February 2020 saw a relatively modest drop of 0.7 percent, as improvements in home sales, manufacturing output and the national outlook were overwhelmed by weakness mostly stemming from the oil and gas sector (Chart 5).
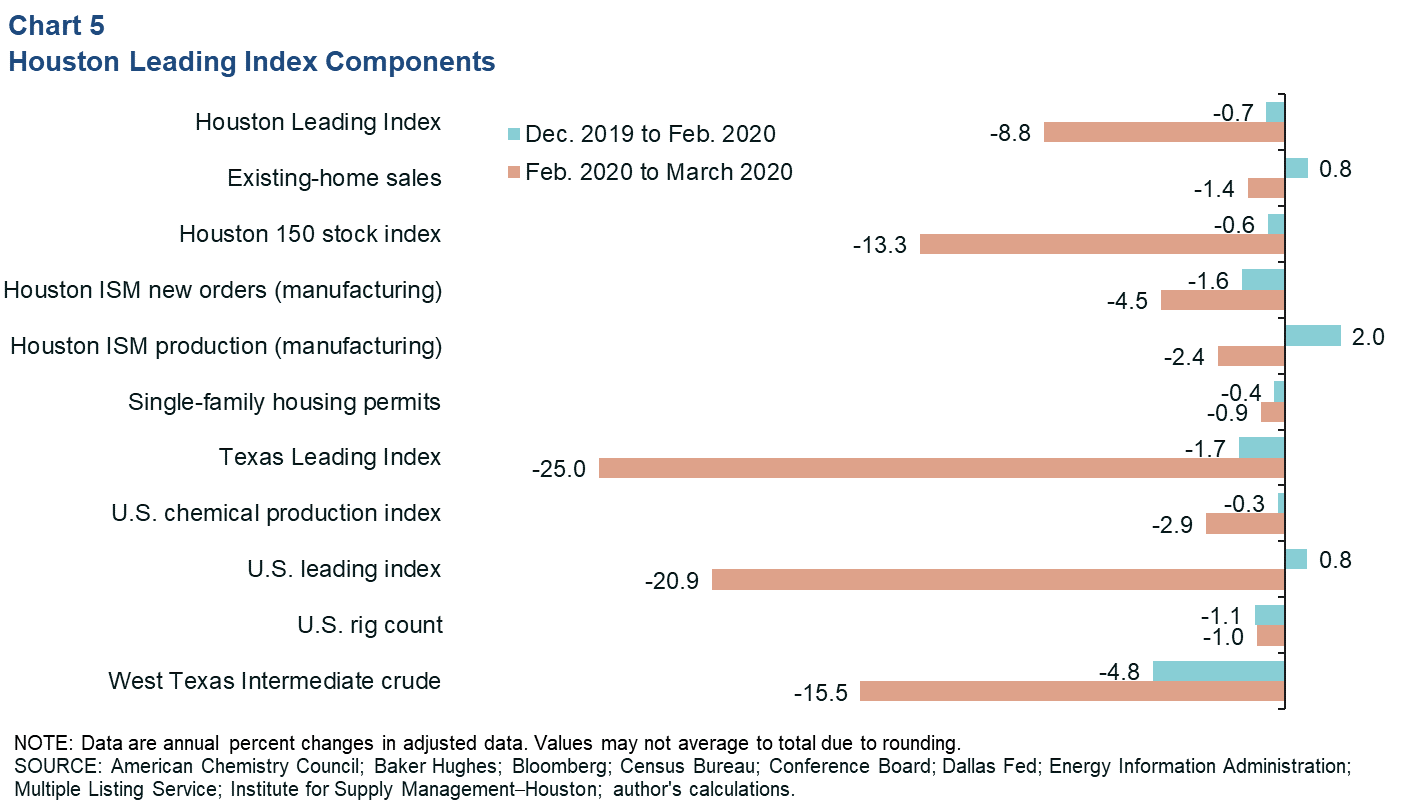
All components turned sharply negative from February to March, with the index dropping 8.8 percent. Leading indexes for the broader macroeconomies of the U.S. and Texas turned down aggressively, as did oil prices, the stock market and manufacturing data.
Existing-Home Sales
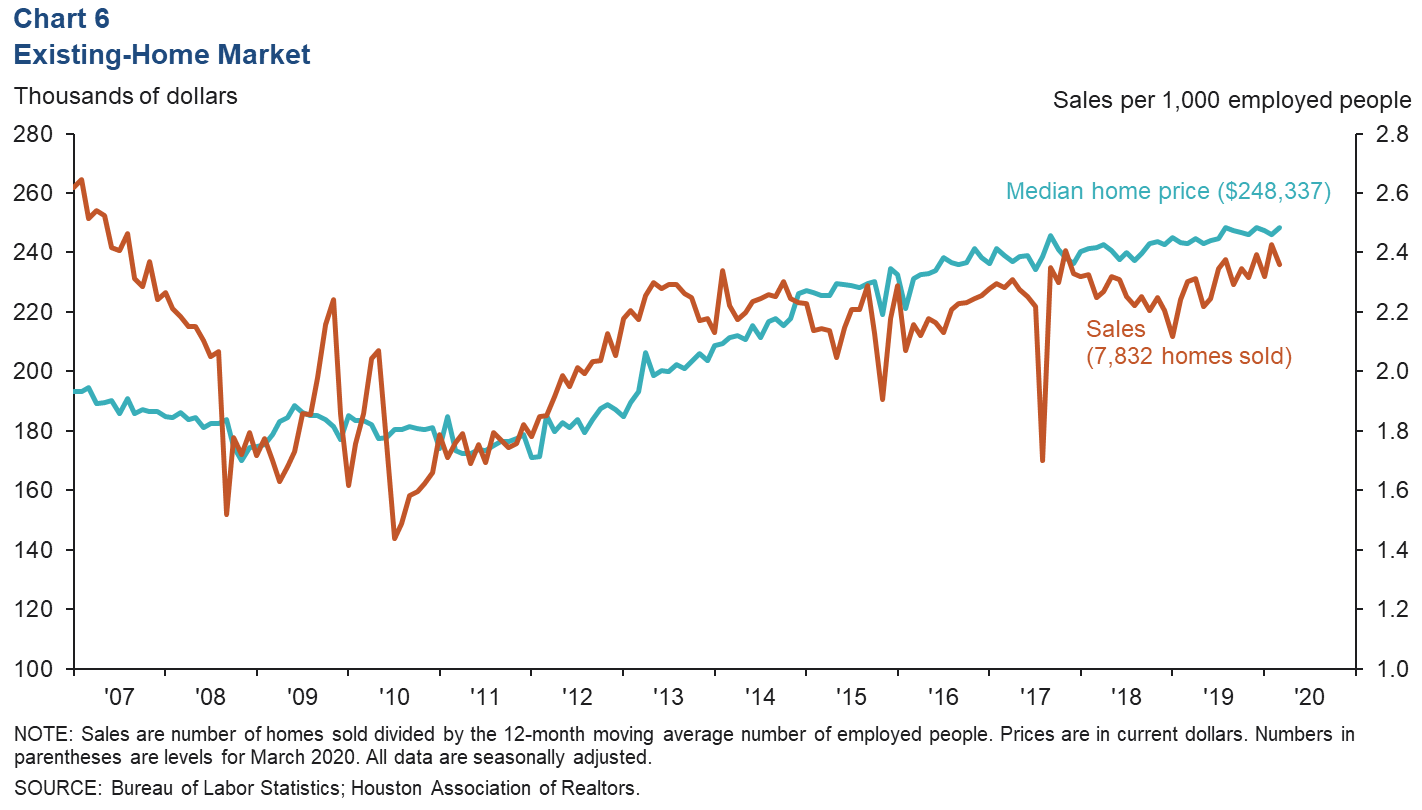
Home sales remained healthy in March, likely bolstered by low mortgage rates. Existing-home sales fell slightly to 7,832 in March, according to seasonally adjusted Multiple Listing Service data (Chart 6). This is a very healthy level of sales when compared with the past 10 years of data and adjusting for population. The months of inventory—number of homes listed for sale divided by the number of sales—held at 3.7 months. Historically, inventories at that level are supportive of rising area home prices. Median home prices have been on a modest, but fairly steady upward trend since the 2015–16 oil bust. In March, the median price of homes sold in Houston was $248,337, seasonally adjusted.
NOTE: Data may not match previously published numbers due to revisions.
About Houston Economic Indicators
Questions can be addressed to Jesse Thompson at jesse.thompson@dal.frb.org. Houston Economic Indicators is posted on the second Monday after monthly Houston-area employment data are released.