Texas Employment Forecast

April 17, 2020
Texas jobs declined 4.7 percent annualized in March. Since the data measure employment during the second week in March, social distancing efforts did not have a significant impact on the March data. Weekly claims for unemployment insurance suggest that the large impacts began in the second half of the month and will thus have a much greater impact on April jobs.
“In March, the Texas Leading Index declined at its steepest pace since the data series began in January 1981, suggesting large declines in jobs in the months ahead,” said Keith Phillips, Dallas Fed assistant vice president and senior economist. “Significant uncertainties remain about when social distancing will ease up and how this will take place. This uncertainty means it is very difficult to know the pattern of growth in the economy in the second half of the year.”
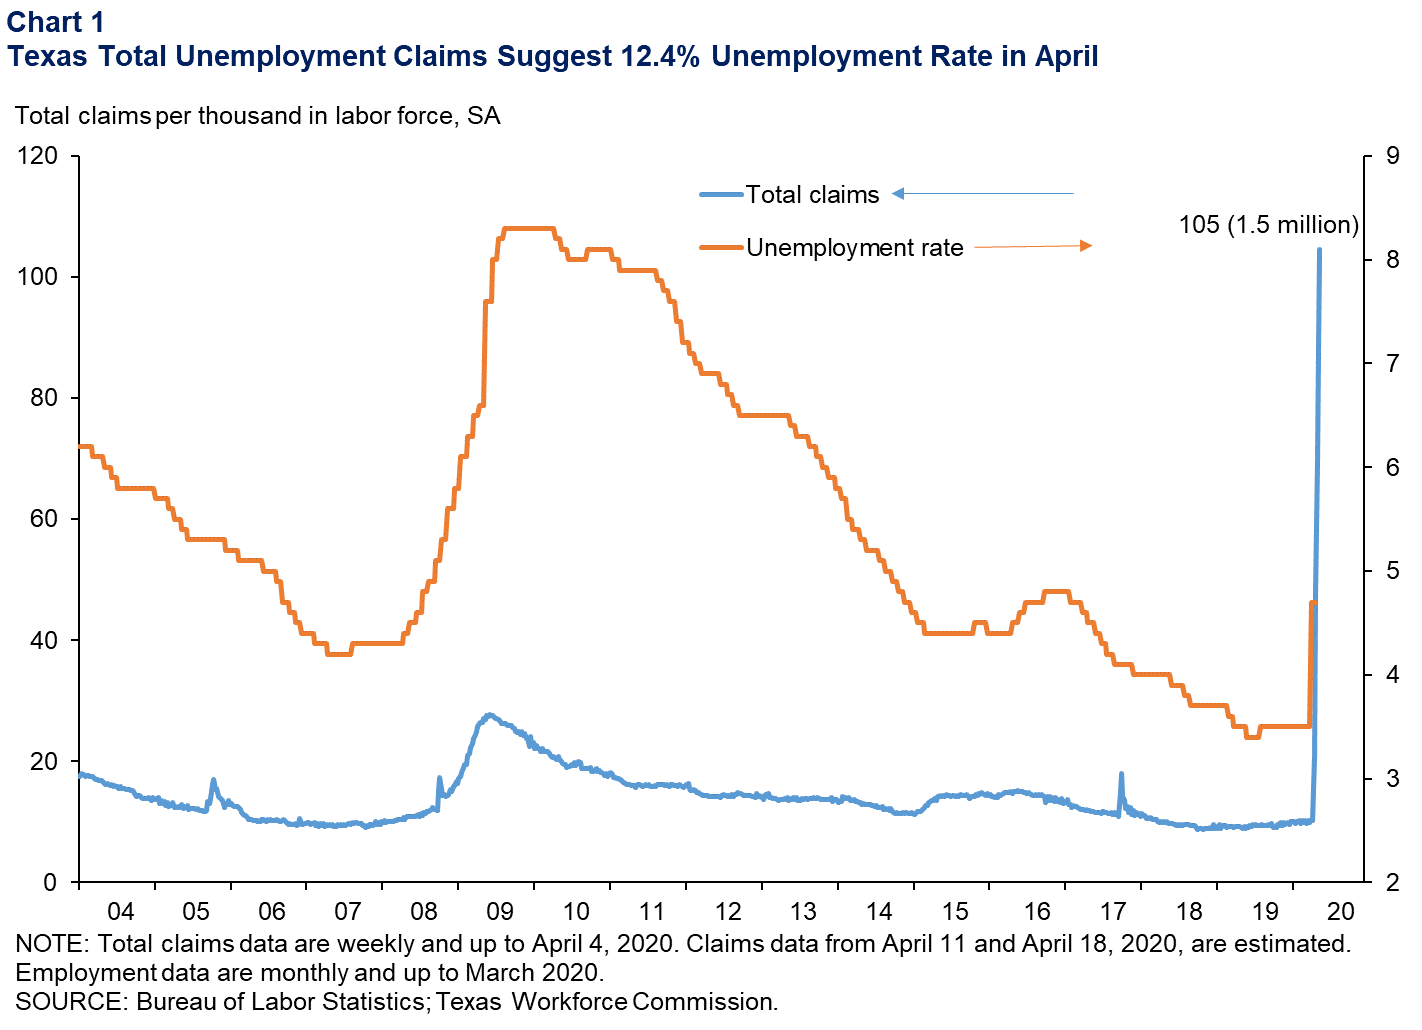
The Texas unemployment rate increased from 3.5 percent in February to 4.7 percent in March, but like the jobs data, did not fully reflect the impact of social distancing. Recent increases in weekly initial claims for unemployment insurance in Texas suggest large job losses from mid-March to mid-April. For the four weeks ending April 18, we estimate total active claims will be about 1.5 million (Chart 1).
“This historically large increase in claims suggests that the April unemployment rate may be near 12.4 percent, although several caveats exist,” Phillips said. “Since potential claimants have overwhelmed the Texas Workforce Commission’s phone lines, this likely has delayed the number of claims filed, and thus the unemployment rate may be higher than what the claims data suggest. It is also the case, however, that many unemployed may not be looking for work due to social distancing rules and may not be counted in the labor force, which would mean the standard measure of unemployment may be lower than what the claims data indicate.”
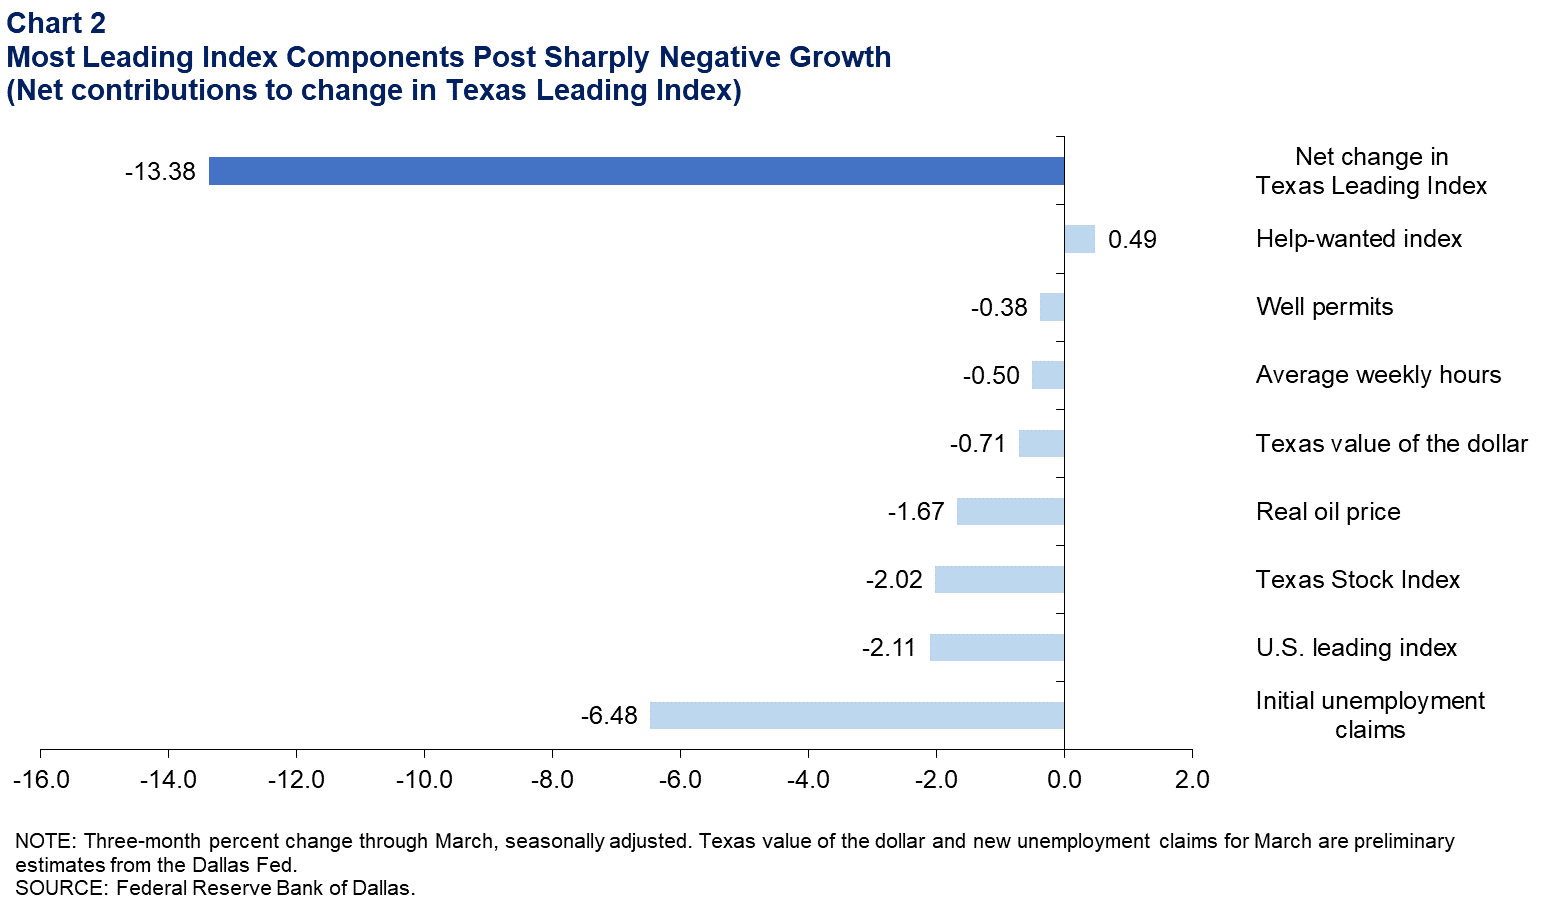
The Texas Leading Index suggests historic declines in the coming months. For the three months ending in March, all of the components declined with the exception of help-wanted advertising (Chart 2). Leading the negative contributions were the large jump in initial claims for unemployment insurance; and sharp declines in the U.S. leading index, stock prices of Texas-based companies and oil prices. The Texas value of the dollar increased, making goods produced here more expensive. Average weekly hours worked, like the jobs data, were for the second week in March and thus not reflective of the weakness in the second half of the month. Permits to drill oil and gas wells declined moderately.
Next release: May 22, 2020
Methodology
The Dallas Fed Texas Employment Forecast projects job growth for the calendar year and is estimated as the 12-month change in payroll employment from December to December. The forecast reported above is a point estimate with 80 percent confidence bands; in other words, the true forecast lies within the bands on Chart 1 with 80 percent probability.
The Dallas Fed Texas Employment Forecasting Model is based on a transfer function that utilizes past changes in state employment along with past changes in the Dallas Fed Texas Leading Index (TLI). Changes in the TLI have an impact on employment with a lead time of three months, and the effect dies out slowly over time. The regression coefficients on lagged changes in employment and the TLI are highly statistically significant, and the model as a whole has been accurate relative to other forecasters over the past two decades.
The forecasting model has been in use at the Dallas Fed since the early 1990s, and the employment forecast has been published in the Western Blue Chip Economic Forecast (WBCF) since 1994. Phillips and Lopez (2009) show that the model has been the most accurate in forecasting Texas job growth relative to other forecasters in the WBCF. In particular, the model had the lowest root mean squared error and has been the closest to the actual the most times (nine of the last 17 years) out of five forecasters that have consistently participated in the survey.
For more details about the model and its performance, see “An Evaluation of Real-Time Forecasting Performance Across 10 Western U.S. States,” by Keith R. Phillips and Joaquin Lopez, Journal of Economic and Social Measurement, vol. 34, no. 2–3, December 2009.
Contact Information
For more information about the Texas Employment Forecast, contact Keith Phillips at keith.r.phillips@dal.frb.org.