Energy Indicators

| Energy dashboard (December 2025) | |||
| WTI price avg. December 2025 |
WTI price change (Sep.-Dec.) |
Henry Hub price avg. December 2025 |
Henry Hub price change from 4 weeks prior (Sep.-Dec.) |
| $57.87/barrel | -3.7% | $4.26/MMBtu | 33.8% |
Global oil inventories are expected to rise over the next year as supply growth continues outpacing consumption. U.S. crude production is projected to remain stable, supported by continued efficiency gains. Oil and gas employment has fallen but is expected to stabilize. Softer oil prices have weighed on oil and gas investment, creating only a modest drag on overall economic growth.
Oil balances and U.S. production
Global market looks well supplied
According to a consensus of projections by major energy agencies, consultancies and investment banks, global oil inventories will further swell by about 1.9 million barrels per day (mb/d) in 2026 and 2027 (Chart 1). This is driven by rising production from non-OPEC countries amid modest—but increasing—global liquids consumption growth.
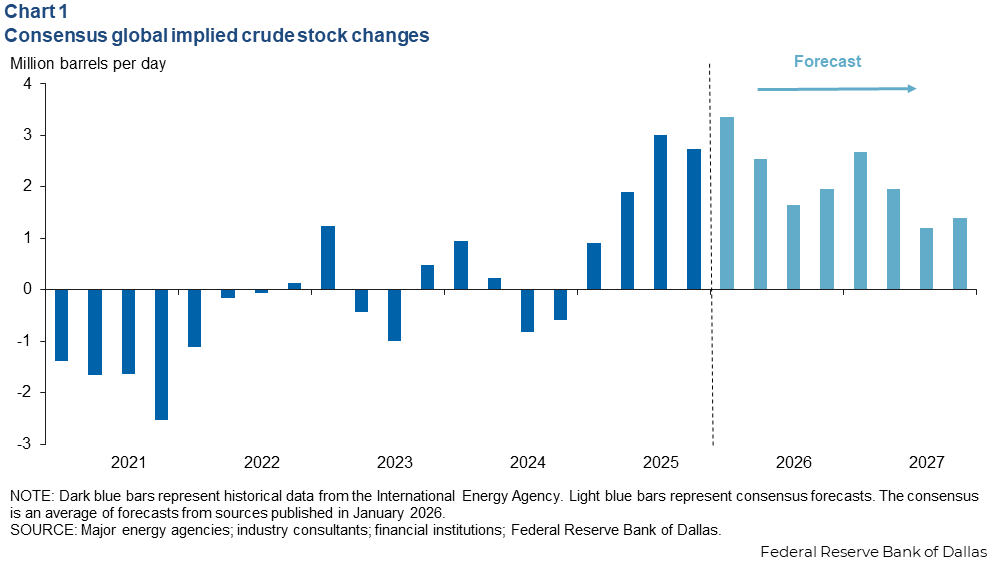
Historically, crude oil prices haven’t withstood such large surpluses and have ultimately declined sharply. Instead, the average price of West Texas Intermediate (WTI) crude has steadily drifted downward from $81 per barrel in July 2024 to $58 in December 2025.
While a significant portion of the surplus barrels are in transit, or floating storage, China has purchased large volumes of the “excess crude” for its strategic and commercial inventories. Those stocks likely rose at a robust pace over the past year—though estimates and projections vary. The number is not publicly reported, but is inferred from official data, satellite imagery and other sources. Many analysts have penciled in more such buying through 2027.
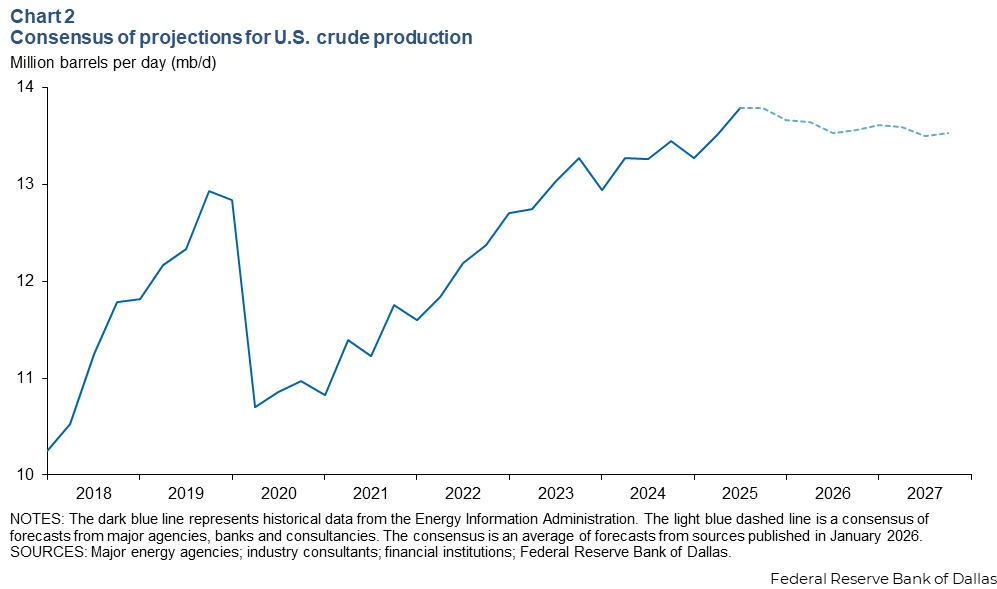
U.S. crude output expected to be nearly flat as Permian plateaus
As the price of WTI and the number of active drilling rigs (see below) eased in 2025, U.S. crude production rose nearly 0.4 mb/d to 13.8 mb/d. An average of several projections shows output slipping over the next two years. U.S. oil production at year-end 2026 is projected to be about 13.6 mb/d and at year-end 2027 closer to 13.5 mb/d, an overall decline of less than 0.3 mb/d (Chart 2).
Oilfield productivity, oil and gas jobs
Improvements in drilling efficiency have reduced the number of rigs needed to sustain production, especially in the Permian Basin. As of December 2025, the rig count in the Permian Basin was 248, well below the 2018 equivalent of 471, the number that would have been needed to put the same lengths of well pipe per day in the ground as in 2025 (Chart 3). While efficiency gains have been most notable in the Permian Basin, drilling efficiency improvements in other producing regions have also been large.
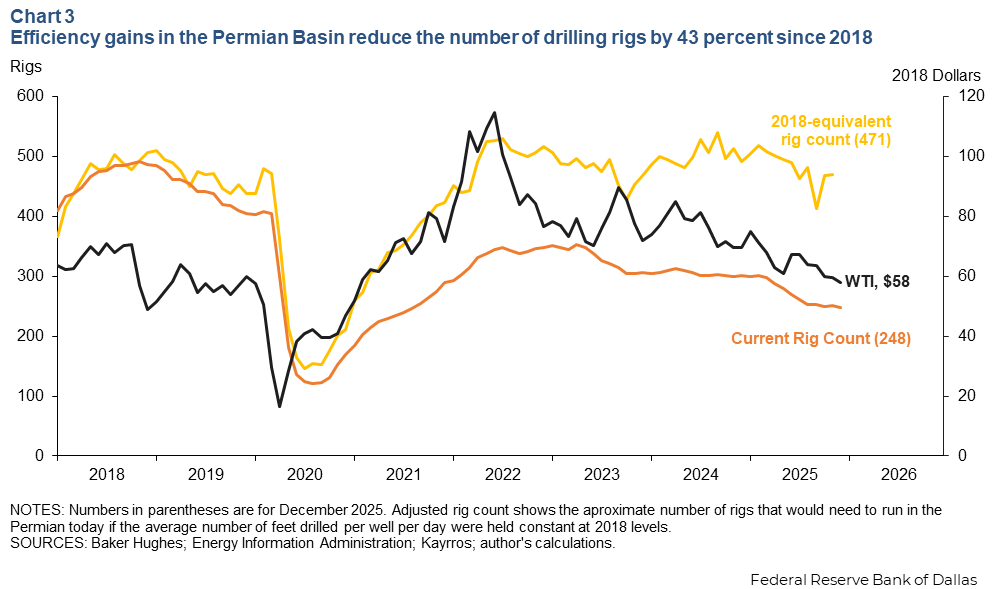
Steady gains in drilling and completion efficiency, well placement and other oilfield technologies continue to improve average cumulative production rates during new wells’ initial two years of operation, even after controlling for the length of the well. This is how domestic crude and condensate output rose to 13.8 mb/d in late 2025 despite low oil prices and shrinking rig counts, according to the Energy Information Administration. Combined with significant industry consolidation over the past three years, the hit to industry employment has been significant.
Are oil and gas payrolls stabilizing?
Oil and gas industry payroll growth in 2025 was downwardly revised in the Bureau of Labor Statistics (BLS) release of Feb. 11, 2026. As expected, employment declined in support activities (-11,200 jobs) and in oil and gas extraction (-4,400) as of December 2025 compared with 2024. Jobs in related sectors, such as the oil and gas field machinery manufacturing sector also decreased (-500), while pipeline transportation grew (3,000) (Chart 4).
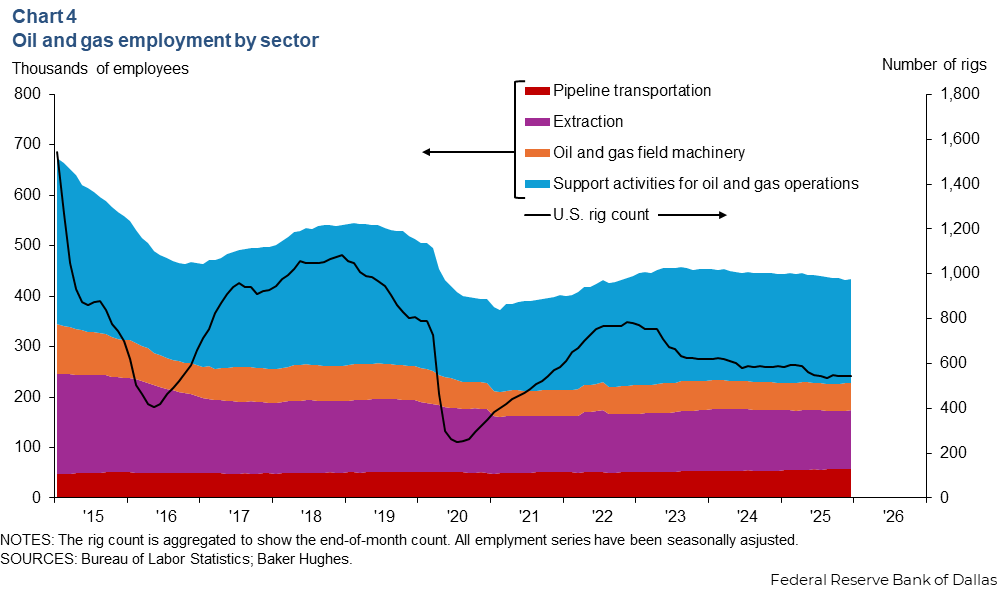
Altogether, these sectors shed 13,000 jobs over the 12 months ended in December, 4,000 more than initially estimated and in line with the preview of national data revisions announced for mining and logging last fall. This mirrors losses indicated in the Dallas Fed’s early benchmarking of Texas payrolls published in early January 2026. That analysis found an overcount of about 9,000 payroll jobs in the initial survey-based numbers. Texas is home to more than half of the industry’s national payroll. Official revisions to the BLS state and local payroll data typically occur in early March.
Not much employment change is expected in 2026. Responses from the fourth quarter 2025 Dallas Fed Energy Survey indicated that firms big and small largely expect employment to remain unchanged in 2026. While that survey result is contingent on how markets evolve this year, it would suggest that most of the job losses attributable to recent consolidation, productivity gains and low oil prices may have concluded.
Oil and gas industry investments, capital spending
Oil and gas private fixed investment fell in 2025
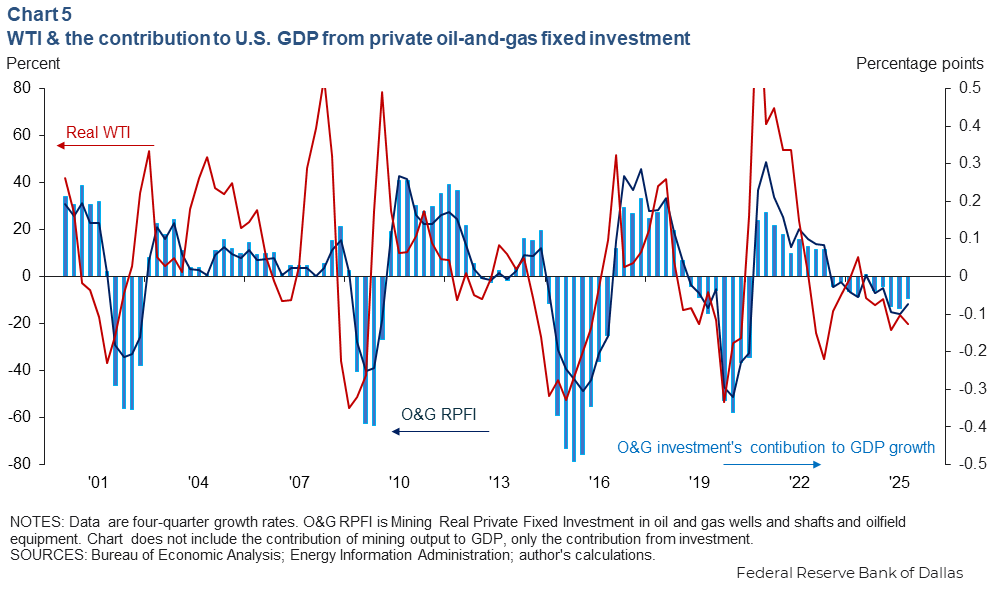
Real WTI prices fell 22.5 percent year over year in fourth quarter 2025, coinciding with an 11.6 percent drop in real oil and gas private fixed investment growth. The two indicators have fallen in nine out of the past 10 quarters relative to prior-year levels.
Looking at U.S. gross domestic product, oil and gas private investment declined 11.8 percent, yielding a modest drag of 0.06 percentage points on annual GDP growth in 2025 (Chart 5).
Oil and gas spending likely to fall further
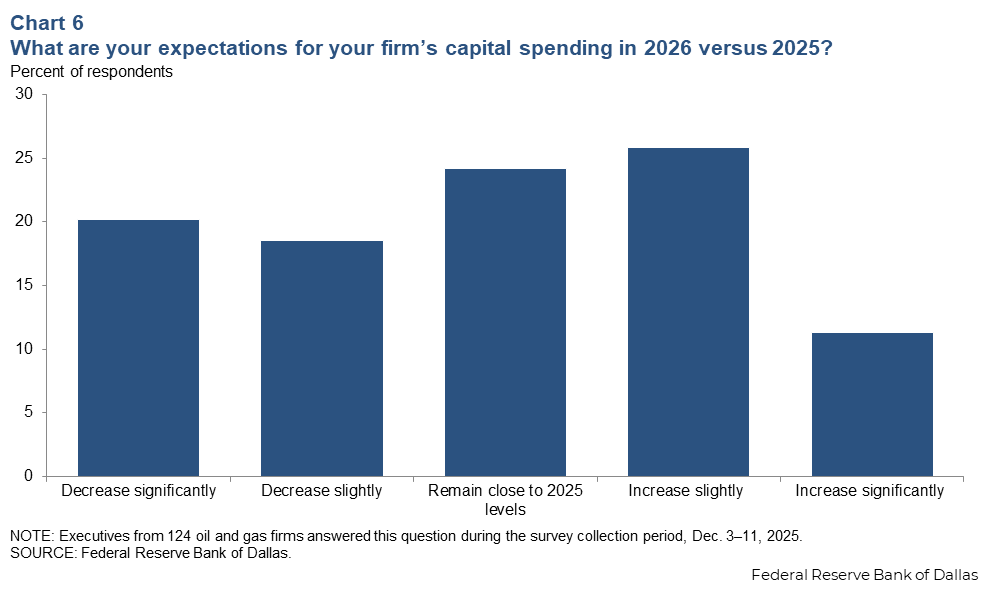
Executives’ responses regarding capital spending in 2026 varied in the fourth quarter 2025 Dallas Fed Energy Survey. Nearly 70 percent indicated either slight changes or no changes from 2025 capital spending. Another 20 percent anticipate a significant decrease, while an additional 11 percent expect a significant increase (Chart 6).
Industry, agency and investment bank projections vary for 2026 spending, incorporating several different global scenarios and oil price assumptions. Consistent with the Dallas Fed survey results, nominal oil and gas capital expenditures in the U,S, are broadly projected to fall by 4 percent to 6 percent from 2025 to 2026. However, increased international spending in places such as Canada, Guyana, West Africa, and Brazil is expected to partially offset the domestic drag on global production spending in 2026.
NOTE: Data may not match previously published numbers due to revisions.
About Energy Indicators
Questions can be addressed to Adefemi Abimbola or Jesse Thompson. Energy Indicators is published quarterly.