
Dallas Fed Energy Survey
Lingering pessimism, uncertainty further weigh on oil and gas activity
Special questions focus on capital spending in 2026, the oil price firms use for budgeting, employee headcount, the expected impact of artificial intelligence (AI) on well breakevens, lightweight proppant use in well completions, whether oil and gas support services firms are entering the power services market, and whether exploration and production firms plan to target wells with higher natural gas content.
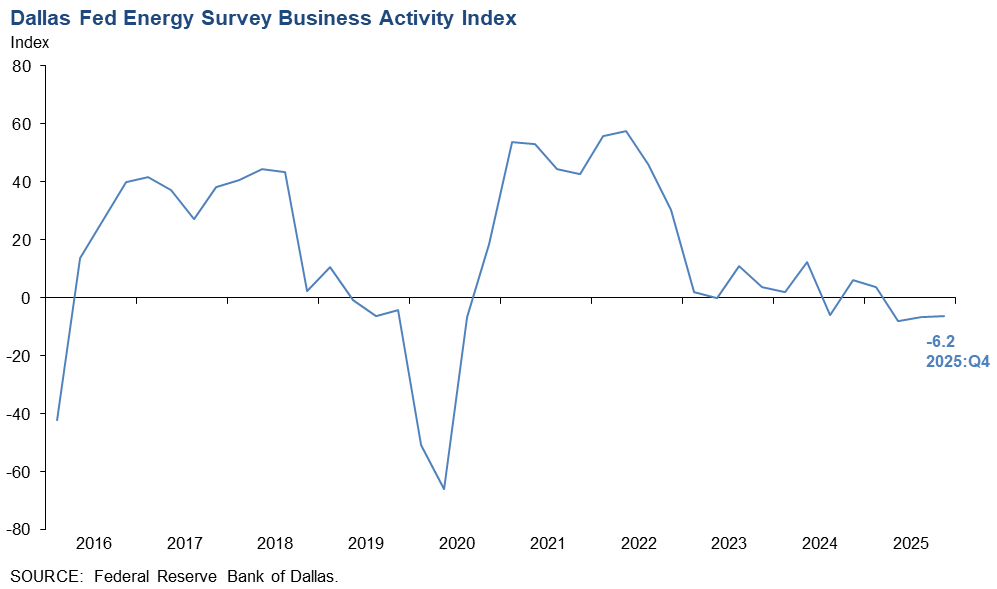
Activity in the oil and gas sector edged lower in fourth quarter 2025, according to oil and gas executives responding to the Dallas Fed Energy Survey. The business activity index, the survey’s broadest measure of the conditions energy firms face in the Eleventh District, remained negative, though relatively unchanged at -6.2 in the fourth quarter.
The company outlook index, while also still negative, improved slightly from -17.6 in the third quarter to -15.2, suggesting continuing pessimism among firms. Meanwhile, the outlook uncertainty index remained elevated and was relatively unchanged at 43.4.
Oil and gas production was little changed in the fourth quarter, according to executives at exploration and production firms. The oil production index remained negative, though it advanced from -8.6 in the third quarter to -3.4. The natural gas production index increased slightly from -3.2 to 0.
Costs increased at a slower pace when compared with the prior quarter. The input cost index for oilfield services firms declined from 34.8 to 24.4. Among exploration and production firms, the finding and development costs index remained positive but fell from 22.0 to 5.7. Also, the lease operating expenses index decreased slightly from 36.9 to 28.4.
Oilfield services firms reported modest deterioration in nearly all indicators. The equipment utilization index for oilfield services firms was relatively unchanged at -12.2. The operating margin index also remained negative and was relatively unchanged at -31.7, indicating margins compressed at a similar rate. Meanwhile, the prices received for services index declined slightly from -26.1 to -30.0.
Overall, demand for employees fell, and those on the job tended to work fewer hours. The aggregate employment index declined from -1.5 in the third quarter to -10.8 in the fourth quarter. Additionally, the aggregate employee hours index declined from -3.7 to -9.3. Meanwhile, the aggregate wages and benefits index remained positive but declined slightly from 11.5 to 6.2.
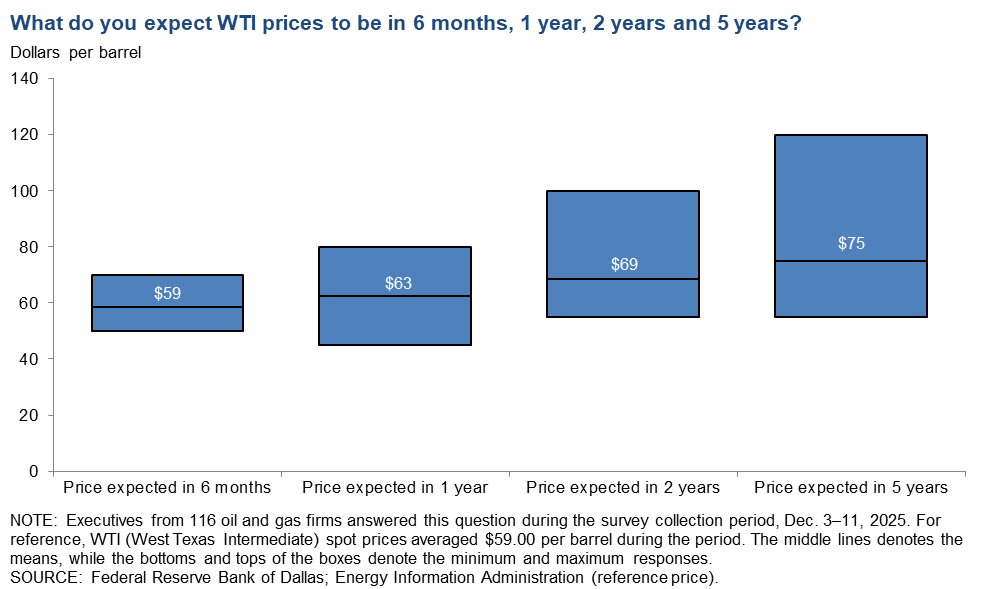
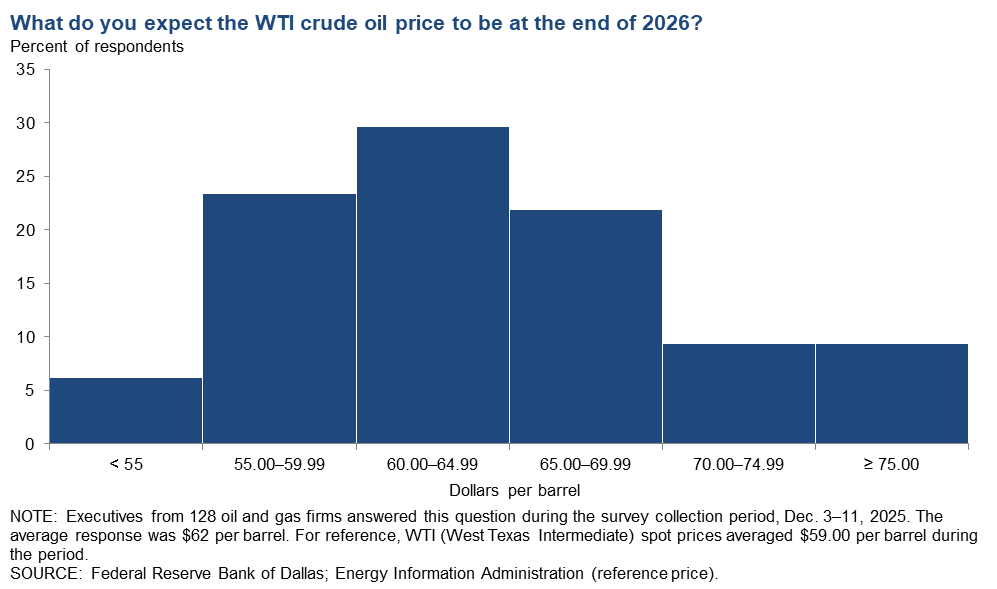
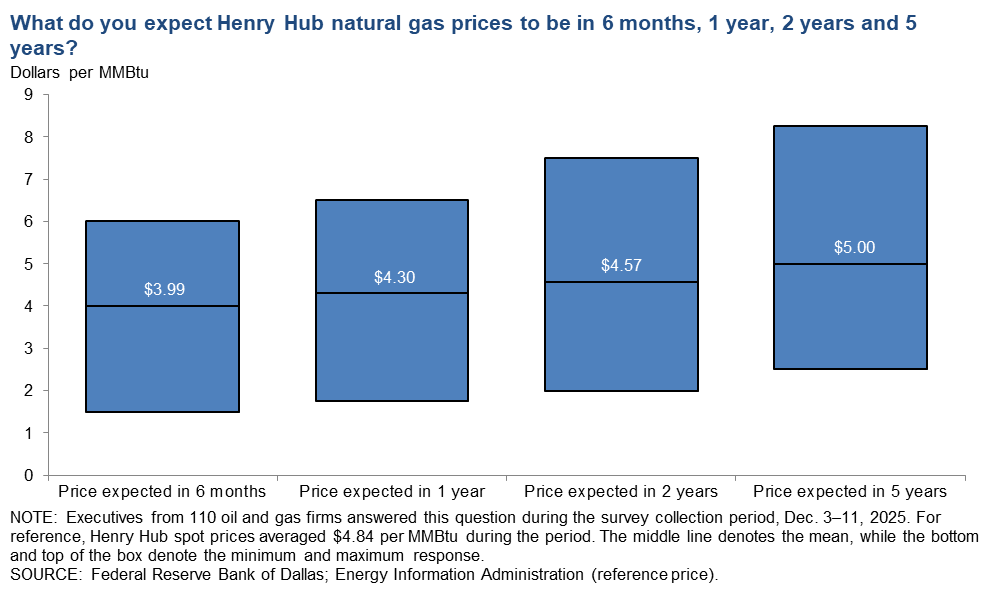
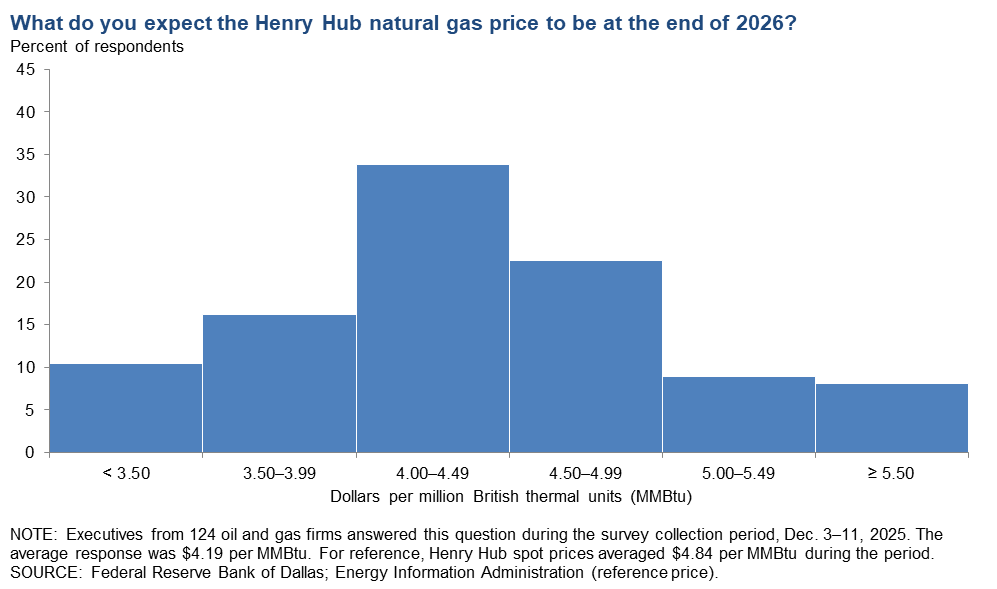
On average, respondents expect a West Texas Intermediate (WTI) oil price of $62 per barrel at year-end 2026; responses ranged from $50 to $82 per barrel. When asked about longer-term expectations, respondents on average said they expect a WTI oil price of $69 per barrel two years from now and $75 per barrel five years from now. Survey participants foresee a Henry Hub natural gas price of $4.19 per million British thermal units (MMBtu) at year-end 2026. When asked about longer-term expectations, respondents on average said they anticipate a Henry Hub gas price of $4.57 per MMBtu two years from now and $5.00 per MMBtu five years from now. For reference, WTI spot prices averaged $59.00 per barrel during the survey collection period, and Henry Hub spot prices averaged $4.84 per MMBtu.
Next release: March 25, 2026
Data were collected Dec. 3–11, and 131 energy firms responded. Of the respondents, 90 were exploration and production firms and 41 were oilfield services firms.
The Dallas Fed conducts the Dallas Fed Energy Survey quarterly to obtain a timely assessment of energy activity among oil and gas firms located or headquartered in the Eleventh District. The Eleventh District encompasses Texas, northern Louisiana and southern New Mexico. Firms are asked whether business activity, employment, capital expenditures and other indicators increased, decreased or remained unchanged compared with the prior quarter and with the same quarter a year ago. Survey responses are used to calculate an index for each indicator. Each index is calculated by subtracting the percentage of respondents reporting a decrease from the percentage reporting an increase. When the share of firms reporting an increase exceeds the share reporting a decrease, the index will be greater than zero, suggesting the indicator has increased over the previous quarter. If the share of firms reporting a decrease exceeds the share reporting an increase, the index will be below zero, suggesting the indicator has decreased over the previous quarter.
Price Forecasts
West Texas Intermediate Crude
| West Texas Intermediate crude oil price, year-end 2026 | ||||
| Indicator | Survey Average | Low Forecast | High Forecast | Price During Survey |
Current quarter | $62.41 | $50.00 | $82.30 | $59.00 |
Prior quarter | N/A | N/A | N/A | N/A |
| NOTE: Price during survey is an average of daily spot prices during the survey collection period. SOURCES: Federal Reserve Bank of Dallas; Energy Information Administration. | ||||
Henry Hub Natural Gas
| Henry Hub natural gas price, year-end 2026 | ||||
| Indicator | Survey Average | Low Forecast | High Forecast | Price During Survey |
Current quarter | $4.19 | $1.75 | $6.50 | $4.84 |
Prior quarter | N/A | N/A | N/A | N/A |
| NOTE: Price during survey is an average of daily spot prices during the survey collection period. SOURCES: Federal Reserve Bank of Dallas; Energy Information Administration. | ||||
Special Questions
Data were collected Dec. 3–11; 128 oil and gas firms responded to the special questions survey.
All firms
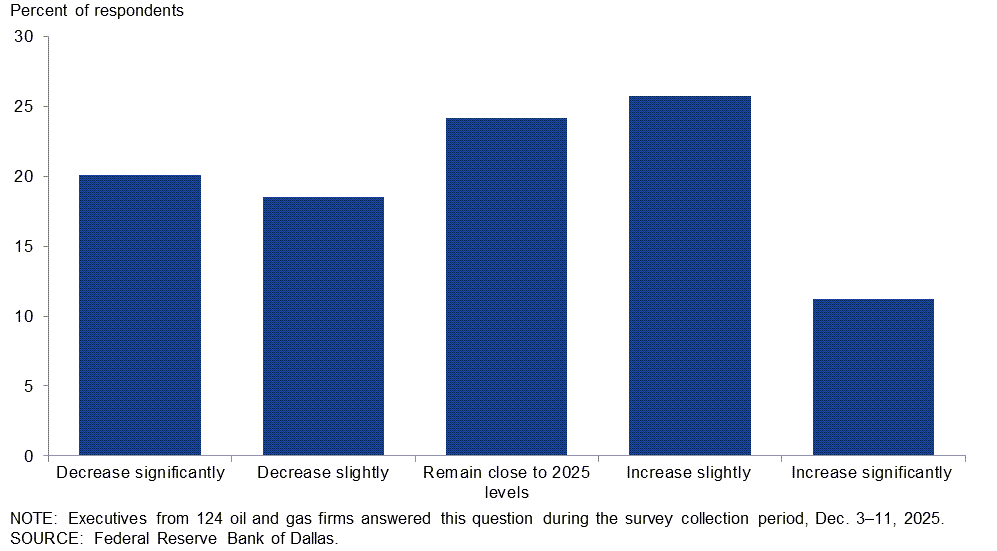
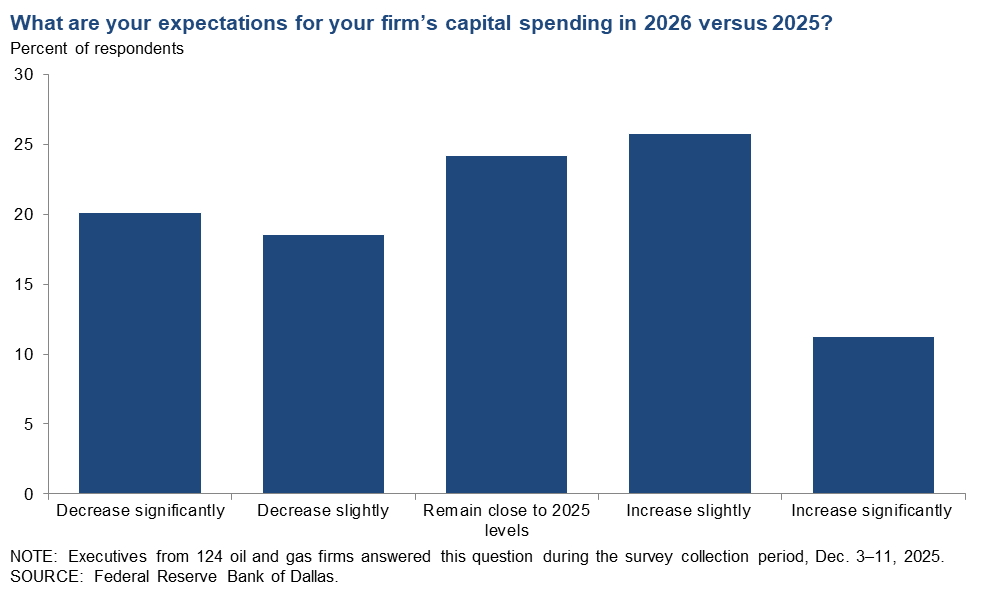
What are your expectations for your firm’s capital spending in 2026 versus 2025?
Reponses varied widely among executives. Nineteen percent of executives said they expect capital spending to decrease slightly, while an additional 20 percent anticipate a significant decrease. Twenty-four percent expect spending in 2026 to remain close to 2025 levels. Twenty-six percent of executives said they expect capital spending to increase slightly, while an additional 11 percent anticipate a significant increase.
Responses differed depending on the firm’s size and type. A breakdown of the data for large and small exploration and production (E&P) companies and oil and gas support services is in the table below. E&P firms were classified as small if they produced fewer than 10,000 barrels per day (b/d) or large if they produced 10,000 b/d or more. In the U.S., small E&P firms are greater in number, but large E&P firms make up the majority of production (more than 80 percent).
“Remain close to 2025 levels” was the most-selected response from executives at large E&P firms (35 percent), whereas the most-selected response from executives at small E&P firms was increase slightly (29 percent). More executives (48 percent) at oil and gas support services firms expect their firm’s capital spending in 2026 to decrease relative to the number of executives (29 percent) anticipating an increase. (See table for more details.)
| Response | Percent of respondents (among each group) | |||
| All firms | Large E&P | Small E&P | Services | |
| Increase significantly | 11 | 6 | 14 | 8 |
| Increase slightly | 26 | 24 | 29 | 21 |
| Remain close to 2025 levels | 24 | 35 | 22 | 24 |
| Decrease slightly | 19 | 24 | 14 | 24 |
| Decrease significantly | 20 | 12 | 20 | 24 |
| NOTES: Executives from 86 exploration and production firms and 38 oil and gas support services firms answered this question during the survey collection period, Dec. 3–11, 2025. Small E&P firms produced fewer than 10,000 barrels per day (b/d) in fourth quarter 2025, while large E&P firms produced 10,000 b/d or more. Responses came from 69 small firms and 17 large firms. Percentages may not sum to 100 due to rounding. SOURCE: Federal Reserve Bank of Dallas. |
||||
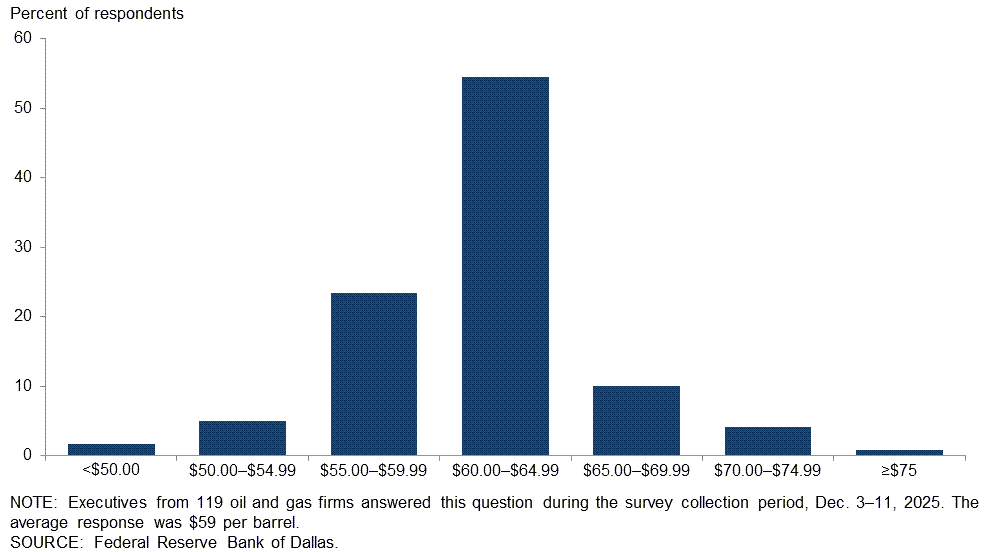
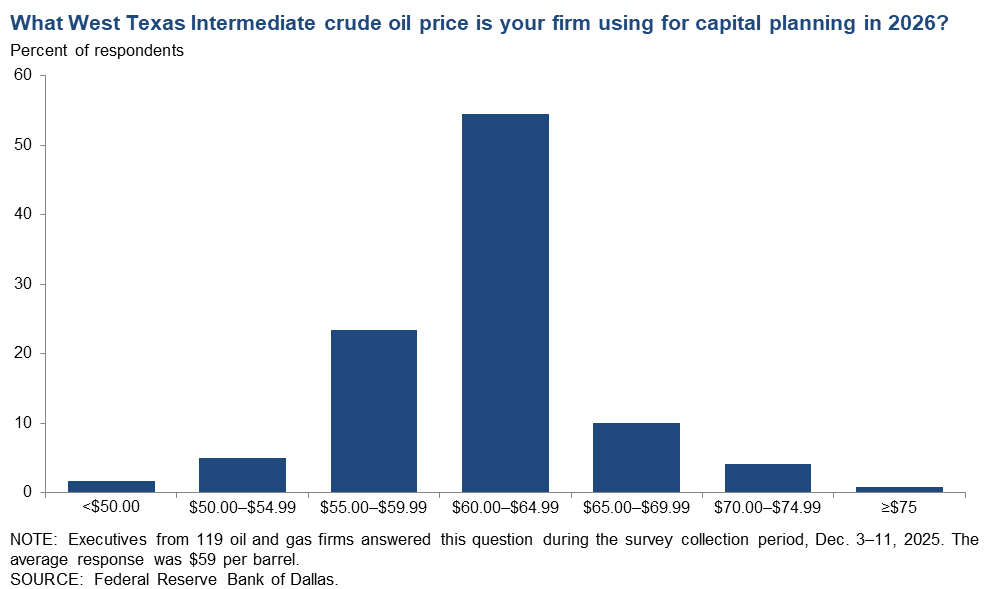
What West Texas Intermediate crude oil price is your firm using for capital planning in 2026?
For this special question, executives were asked to provide the WTI price they use for planning capital expenditures in 2026. The average response was $59 per barrel, with the median and the mode at $60 per barrel. The average price used is below the price used in the 2025 budget, $68.
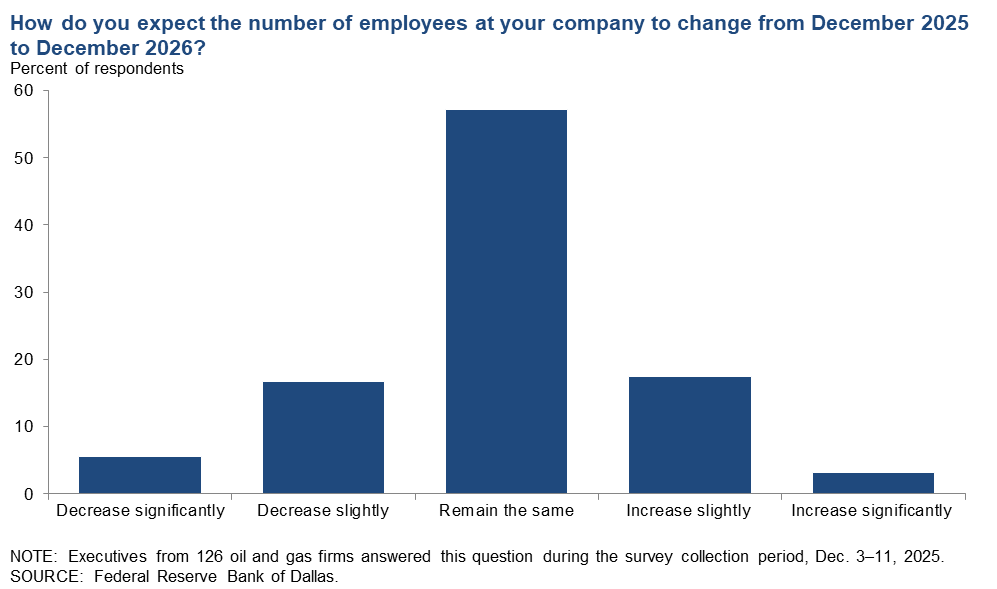
How do you expect the number of employees at your company to change from December 2025 to December 2026?
The largest group, 57 percent of executives, expect employment at their firms to remain the same from December 2025 to December 2026. Slightly more executives expect their firms’ employment to decrease relative to the number of executives anticipating an increase. (See table for more details.)
| Response | Percent of respondents (among each group) | ||
| All firms | E&P | Services | |
| Increase significantly | 3 | 3 | 3 |
| Increase slightly | 17 | 14 | 26 |
| Remain the same | 57 | 61 | 47 |
| Decrease slightly | 17 | 15 | 21 |
| Decrease significantly | 6 | 7 | 3 |
| NOTES: Executives from 88 exploration and production firms and 38 oil and gas support services firms answered this question during the survey collection period, Dec. 3–11, 2025. The “All” column reports the percentage out of the total 126 responses. Percentages may not sum to 100 due to rounding. SOURCE: Federal Reserve Bank of Dallas. |
|||
Exploration and production (E&P) firms
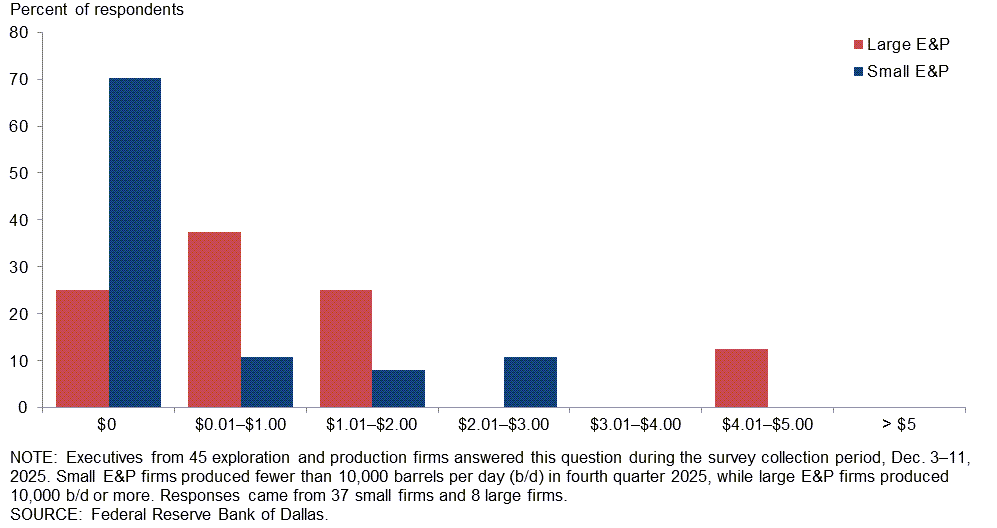
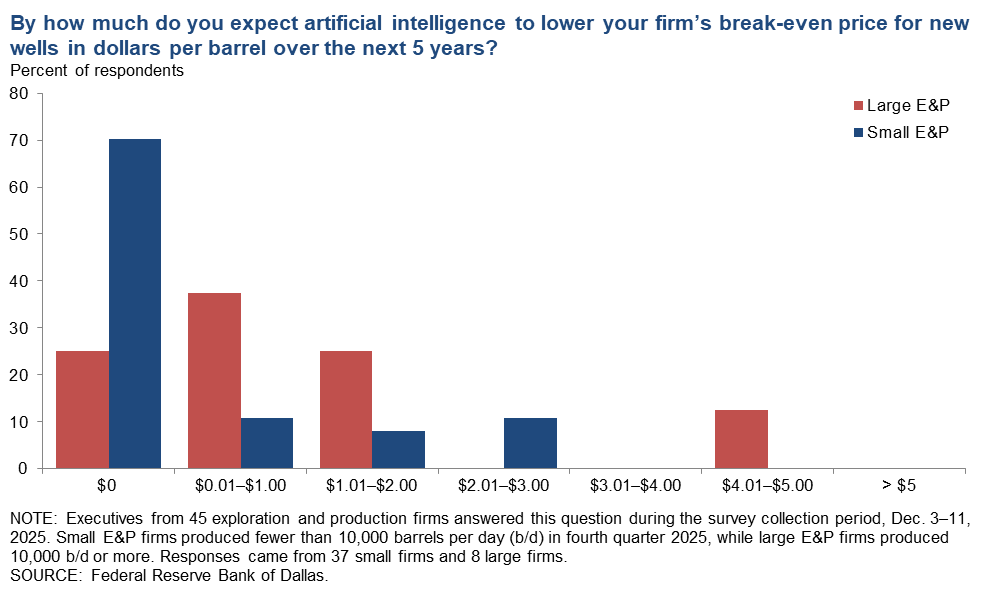
By how much do you expect artificial intelligence to lower your firm’s break-even price for new wells in dollars per barrel over the next 5 years?
Executives from small and large E&P firms have differing views on the potential impact of artificial intelligence (AI) on break-even prices. The majority of executives at large E&P firms expect artificial intelligence (AI) to provide some reduction to their firms’ break-even prices for new wells over the next five years. Thirty-eight percent of executives at large E&P firms anticipate reductions of $0.01–$1 per barrel, 25 percent expect $1.01–$2 per barrel and an additional 13 percent expect $4.01–$5 per barrel. However, the majority of executives at small E&P firms expect AI will not lower their firm’s break-even price. (See table for more details.)
| Response | Percent of respondents (among each group) | ||
| All E&P | Large E&P | Small E&P | |
| $0 | 62 | 25 | 70 |
| $0.01–$1.00 | 16 | 38 | 11 |
| $1.01–$2.00 | 11 | 25 | 8 |
| $2.01–$3.00 | 9 | 0 | 11 |
| $3.01–$4.00 | 0 | 0 | 0 |
| $4.01–$5.00 | 2 | 13 | 0 |
| >$5 | 0 | 0 | 0 |
| NOTES: Executives from 45 exploration and production firms answered this question during the survey collection period, Dec. 3–11, 2025. Small E&P firms produced fewer than 10,000 barrels per day (b/d) in fourth quarter 2025, while large E&P firms produced 10,000 b/d or more. Responses came from 37 small firms and 8 large firms. Percentages may not sum to 100 due to rounding. SOURCE: Federal Reserve Bank of Dallas. |
|||
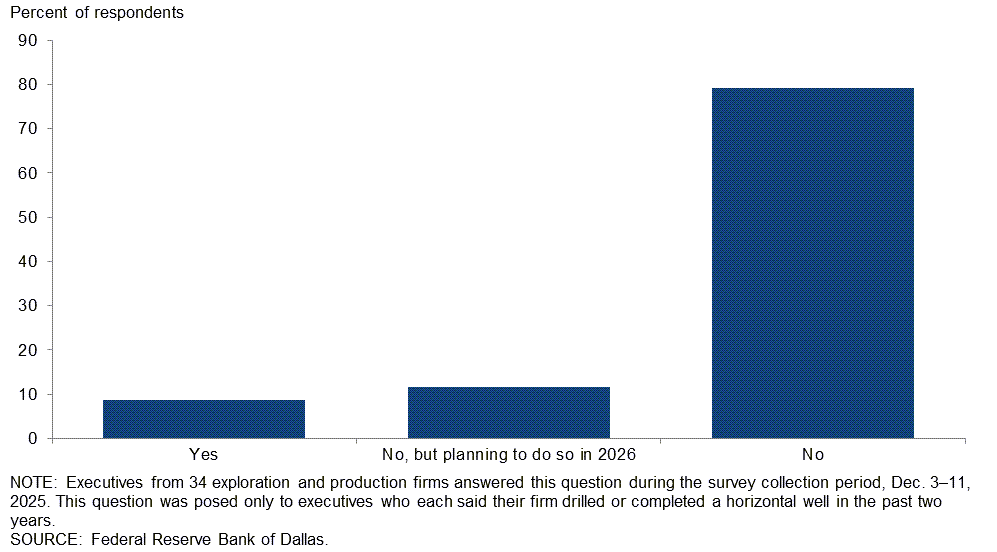
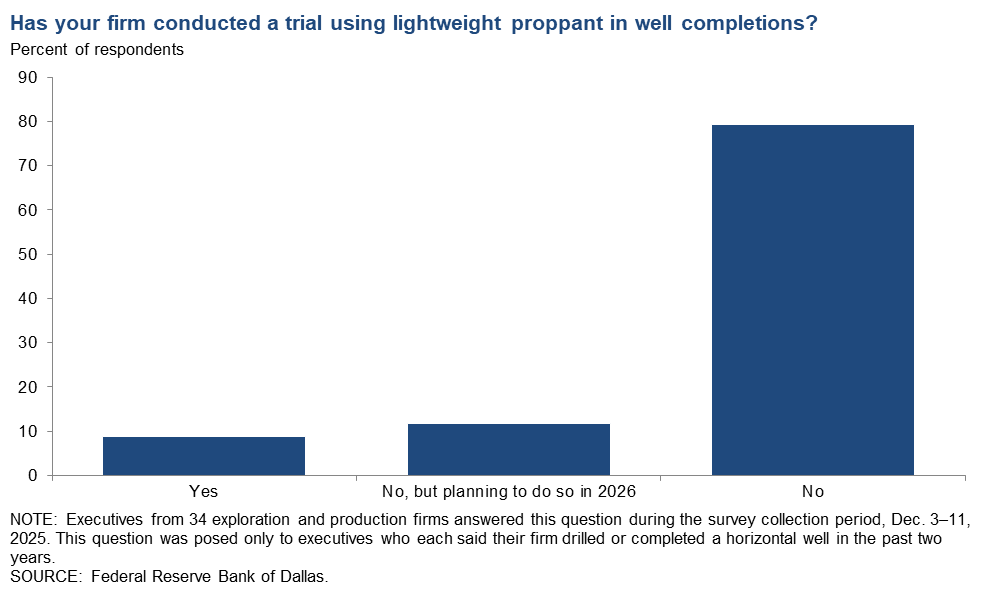
Has your firm conducted a trial using lightweight proppant in well completions?
This question was posed only to E&P executives who each said their firm drilled or completed a horizontal well in the past two years. Most executives (79 percent) report their firms haven’t conducted trials using lightweight proppant in well completions. Nine percent of executives said their firms have already conducted trials, with an additional 12 percent reporting their firms are planning to conduct trials in 2026.
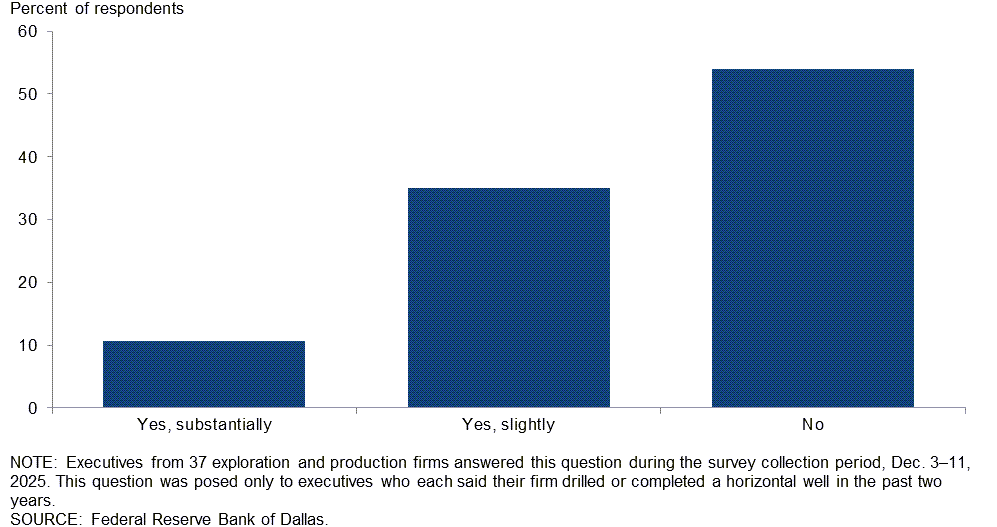
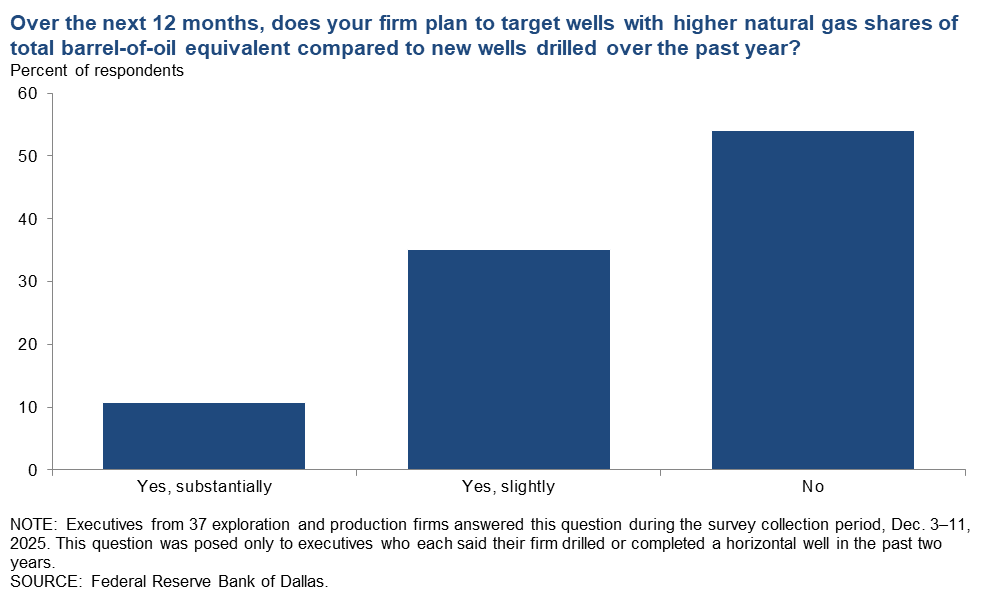
Over the next 12 months, does your firm plan to target wells with higher natural gas shares of total barrel-of-oil equivalent compared to new wells drilled over the past year?
This question was posed only to E&P executives who each said their firms drilled or completed horizontal wells in the past two years. Fifty-four percent of executives said their firms do not plan to target wells with higher natural gas shares in the coming 12 months. Thirty-five percent expect their firms to target wells with slightly higher natural gas content, and an additional 11 percent said they plan to target wells with substantially higher natural gas shares. More executives (52 percent) at small E&P firms expect their firms to target gassier wells in 2026 relative to the number of executives at large E&P firms (33 percent). (See table for more details.)
| Response | Percent of respondents (among each group) | ||
| All E&P | Large E&P | Small E&P | |
| Yes, substantially | 11 | 0 | 16 |
| Yes, slightly | 35 | 33 | 36 |
| No | 54 | 67 | 48 |
| NOTES: Executives from 37 exploration and production firms answered this question during the survey collection period, Dec. 3–11, 2025. Small E&P firms produced fewer than 10,000 barrels per day (b/d) in fourth quarter 2025, while large E&P firms produced 10,000 b/d or more. Responses came from 25 small firms and 12 large firms. Percentages may not sum to 100 due to rounding. This question was posed only to executives who each said their firm drilled or completed a horizontal well in the past two years. SOURCE: Federal Reserve Bank of Dallas. |
|||
Oil and gas support services firms
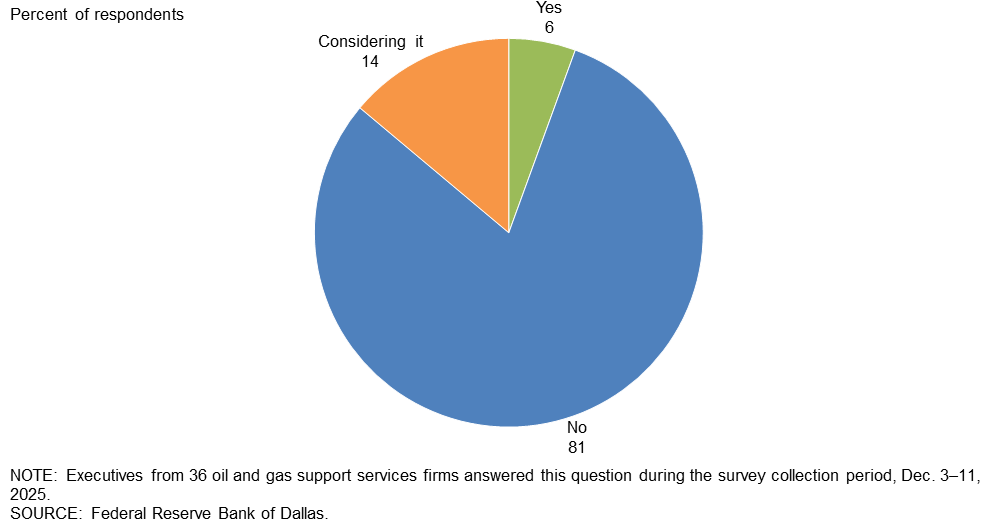
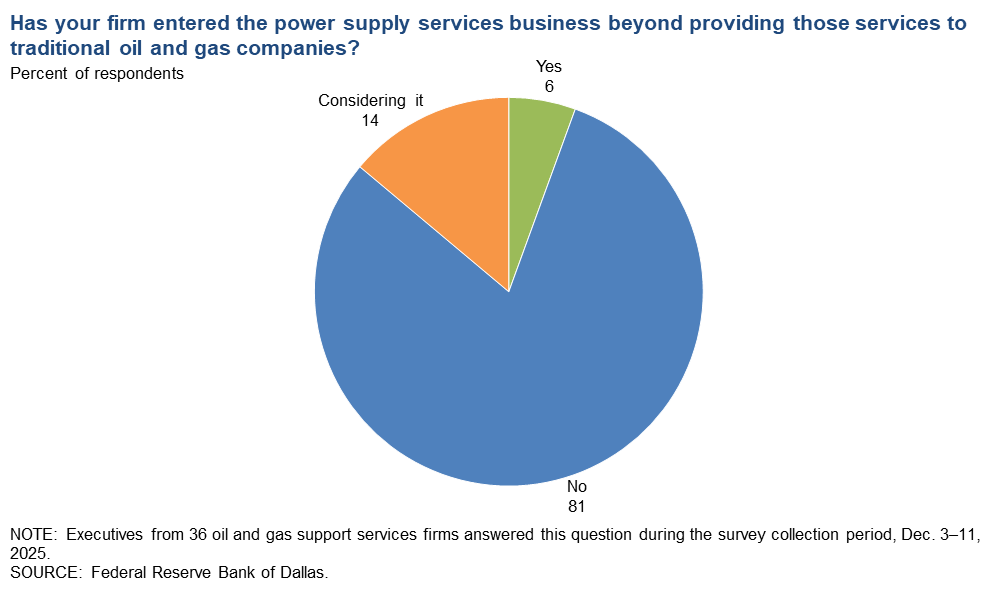
Has your firm entered the power supply services business beyond providing those services to traditional oil and gas companies?
The power supply services business typically entails providing and managing electrical power for businesses and industries. Most executives (81 percent) report their firms have not entered the power supply services business beyond providing those services to traditional oil and gas companies. Six percent of executives said their firms have entered the business, and an additional 14 percent report their firms are considering it. Percentages do not sum to 100 due to rounding.
Special Questions Comments
Exploration and production (E&P) firms
- The secondary zones in the Permian have 15 to 20 percent less reserves by our observation. Make no mistake, these are economic locations, but we view secondary zones as unable to keep up with global crude oil demand in the next five years. Hence why we are seeing larger independents make forays into Turkey, Argentina and the like.
- AI has helped reduce our effective well costs, not through a single measurable dollar impact, but through broad productivity gains across our office. Employees complete tasks more quickly, avoid overlooked items through AI reminders and use AI to review documents when time is limited. These incremental improvements make our operations more efficient and ultimately lower our aggregate cost of drilling a well.
- I have an uneasy feeling about the reason that China continues to stockpile crude oil to the tune of about a million barrels per day. Could it be a prelude to an invasion of Taiwan?
- The initial review shows that federal government policies may be helping in reducing the overall cost of production.
- If we see interest rate cuts, the administration’s economy will take off, and oil and gas consumption will drive up prices for oil and natural gas. New pipeline projects will improve takeaway from West Texas, and new LNG plants will help to drive natural gas prices upward. The Federal Reserve needs to do its part.
- Our plans for 2026 include a major drilling and delineation program, but we are currently being delayed by the state's bureaucracy roadblocks.
Oil and gas support services firms
- We have a renewable business utilizing solar generation and potentially batteries to supply specific community and industrial projects, mostly behind the meter and as a supplement to existing supply.
Additional Comments »
Historical data are available from first quarter 2016 to the most current release quarter.
Business Indicators: Quarter/Quarter
| Business Indicators: All Firms Current Quarter (versus previous quarter) | |||||
| Indicator | Current Index | Previous Index | % Reporting Increase | % Reporting No Change | % Reporting Decrease |
Level of Business Activity | –6.2 | –6.5 | 24.0 | 45.7 | 30.2 |
Capital Expenditures | –11.6 | –11.6 | 20.2 | 48.1 | 31.8 |
Supplier Delivery Time | 0.8 | –3.6 | 7.8 | 85.3 | 7.0 |
Employment | –10.8 | –1.5 | 10.0 | 69.2 | 20.8 |
Employee Hours | –9.3 | –3.7 | 11.5 | 67.7 | 20.8 |
Wages and Benefits | 6.2 | 11.5 | 18.5 | 69.2 | 12.3 |
| Indicator | Current Index | Previous Index | % Reporting Improved | % Reporting No Change | % Reporting Worsened |
Company Outlook | –15.2 | –17.6 | 21.2 | 42.4 | 36.4 |
| Indicator | Current Index | Previous Index | % Reporting Increase | % Reporting No Change | % Reporting Decrease |
Uncertainty | 43.4 | 44.6 | 55.0 | 33.3 | 11.6 |
| Business Indicators: E&P Firms Current Quarter (versus previous quarter) | |||||
| Indicator | Current Index | Previous Index | % Reporting Increase | % Reporting No Change | % Reporting Decrease |
Level of Business Activity | –5.6 | –3.2 | 20.5 | 53.4 | 26.1 |
Oil Production | –3.4 | –8.6 | 25.0 | 46.6 | 28.4 |
Natural Gas Wellhead Production | 0.0 | –3.2 | 23.0 | 54.0 | 23.0 |
Capital Expenditures | –15.9 | –5.3 | 15.9 | 52.3 | 31.8 |
Expected Level of Capital Expenditures Next Year | –13.9 | –9.8 | 23.3 | 39.5 | 37.2 |
Supplier Delivery Time | –2.3 | –3.3 | 4.5 | 88.6 | 6.8 |
Employment | –9.0 | 1.1 | 5.6 | 79.8 | 14.6 |
Employee Hours | –5.6 | –3.2 | 7.9 | 78.7 | 13.5 |
Wages and Benefits | 7.9 | 8.6 | 18.0 | 71.9 | 10.1 |
Finding and Development Costs | 5.7 | 22.0 | 20.5 | 64.8 | 14.8 |
Lease Operating Expenses | 28.4 | 36.9 | 34.1 | 60.2 | 5.7 |
| Indicator | Current Index | Previous Index | % Reporting Improved | % Reporting No Change | % Reporting Worsened |
Company Outlook | –15.2 | –20.0 | 19.0 | 46.8 | 34.2 |
| Indicator | Current Index | Previous Index | % Reporting Increase | % Reporting No Change | % Reporting Decrease |
Uncertainty | 41.6 | 39.8 | 52.8 | 36.0 | 11.2 |
| Business Indicators: O&G Support Services Firms Current Quarter (versus previous quarter) | |||||
| Indicator | Current Index | Previous Index | % Reporting Increase | % Reporting No Change | % Reporting Decrease |
Level of Business Activity | –7.3 | –13.0 | 31.7 | 29.3 | 39.0 |
Utilization of Equipment | –12.2 | –13.0 | 26.8 | 34.1 | 39.0 |
Capital Expenditures | –2.4 | –24.4 | 29.3 | 39.0 | 31.7 |
Supplier Delivery Time | 7.3 | –4.3 | 14.6 | 78.0 | 7.3 |
Lag Time in Delivery of Firm's Services | 9.7 | –6.7 | 14.6 | 80.5 | 4.9 |
Employment | –14.6 | –6.5 | 19.5 | 46.3 | 34.1 |
Employment Hours | –17.1 | –4.3 | 19.5 | 43.9 | 36.6 |
Wages and Benefits | 2.4 | 17.4 | 19.5 | 63.4 | 17.1 |
Input Costs | 24.4 | 34.8 | 29.3 | 65.9 | 4.9 |
Prices Received for Services | –30.0 | –26.1 | 7.5 | 55.0 | 37.5 |
Operating Margin | –31.7 | –31.8 | 12.2 | 43.9 | 43.9 |
| Indicator | Current Index | Previous Index | % Reporting Improved | % Reporting No Change | % Reporting Worsened |
Company Outlook | –15.4 | –13.3 | 25.6 | 33.3 | 41.0 |
| Indicator | Current Index | Previous Index | % Reporting Increase | % Reporting No Change | % Reporting Decrease |
Uncertainty | 47.5 | 54.4 | 60.0 | 27.5 | 12.5 |
Business Indicators: Year/Year
| Business Indicators: All Firms Current Quarter (versus same quarter a year ago) | |||||
| Indicator | Current Index | Previous Index | % Reporting Increase | % Reporting No Change | % Reporting Decrease |
Level of Business Activity | –18.7 | –22.7 | 27.6 | 26.0 | 46.3 |
Capital Expenditures | –10.8 | –11.3 | 28.9 | 31.4 | 39.7 |
Supplier Delivery Time | 1.6 | 0.7 | 12.3 | 77.0 | 10.7 |
Employment | –11.3 | –5.3 | 14.5 | 59.7 | 25.8 |
Employee Hours | –12.9 | 0.8 | 11.3 | 64.5 | 24.2 |
Wages and Benefits | 22.8 | 36.1 | 35.0 | 52.8 | 12.2 |
| Indicator | Current Index | Previous Index | % Reporting Improved | % Reporting No Change | % Reporting Worsened |
Company Outlook | –28.8 | –28.9 | 20.7 | 29.7 | 49.5 |
| Business Indicators: E&P Firms Current Quarter (versus same quarter a year ago) | |||||
| Indicator | Current Index | Previous Index | % Reporting Increase | % Reporting No Change | % Reporting Decrease |
Level of Business Activity | –19.7 | –16.8 | 25.6 | 29.1 | 45.3 |
Oil Production | –3.5 | –9.0 | 30.2 | 36.0 | 33.7 |
Natural Gas Wellhead Production | –5.9 | –4.6 | 28.2 | 37.6 | 34.1 |
Capital Expenditures | –10.4 | –11.2 | 29.1 | 31.4 | 39.5 |
Expected Level of Capital Expenditures Next Year | –16.9 | –16.1 | 26.5 | 30.1 | 43.4 |
Supplier Delivery Time | 1.2 | 3.4 | 9.3 | 82.6 | 8.1 |
Employment | –3.4 | 1.1 | 13.8 | 69.0 | 17.2 |
Employee Hours | –4.6 | 3.4 | 11.5 | 72.4 | 16.1 |
Wages and Benefits | 25.3 | 39.3 | 34.5 | 56.3 | 9.2 |
Finding and Development Costs | 5.8 | 29.5 | 26.7 | 52.3 | 20.9 |
Lease Operating Expenses | 32.2 | 51.1 | 42.9 | 46.4 | 10.7 |
| Indicator | Current Index | Previous Index | % Reporting Improved | % Reporting No Change | % Reporting Worsened |
Company Outlook | –26.3 | –26.6 | 21.1 | 31.6 | 47.4 |
| Business Indicators: O&G Support Services Firms Current Quarter (versus same quarter a year ago) | |||||
| Indicator | Current Index | Previous Index | % Reporting Increase | % Reporting No Change | % Reporting Decrease |
Level of Business Activity | –16.2 | –34.8 | 32.4 | 18.9 | 48.6 |
Utilization of Equipment | –27.8 | –23.3 | 22.2 | 27.8 | 50.0 |
Capital Expenditures | –11.4 | –11.7 | 28.6 | 31.4 | 40.0 |
Supplier Delivery Time | 2.7 | –4.6 | 19.4 | 63.9 | 16.7 |
Lag Time in Delivery of Firm's Services | 8.3 | 0.0 | 13.9 | 80.6 | 5.6 |
Employment | –29.7 | –18.6 | 16.2 | 37.8 | 45.9 |
Employment Hours | –32.4 | –4.6 | 10.8 | 45.9 | 43.2 |
Wages and Benefits | 16.7 | 29.2 | 36.1 | 44.4 | 19.4 |
Input Costs | 44.5 | 47.6 | 52.8 | 38.9 | 8.3 |
Prices Received for Services | –29.7 | –28.6 | 13.5 | 43.2 | 43.2 |
Operating Margin | –34.3 | –45.2 | 17.1 | 31.4 | 51.4 |
| Indicator | Current Index | Previous Index | % Reporting Improved | % Reporting No Change | % Reporting Worsened |
Company Outlook | –34.3 | –33.4 | 20.0 | 25.7 | 54.3 |
Activity Chart
Comments from Survey Respondents
Survey participants are given the opportunity to submit comments on current issues that may be affecting their businesses. Some comments have been edited for grammar and clarity. Comments from the Special Questions survey can be found below the special questions.
Exploration and production (E&P) firms
- Decreasing oil prices are making many of our firm’s wells noneconomic.
- There are a variety of issues affecting our business. First, elevated uncertainty stemming from government policies and geopolitics. Second, near-term global oil market dynamics.
- Capital efficiencies and returns drive our investment decisions; if economic conditions worsen, drilling and completion activities will cease in 2026.
- Natural gas is becoming an expense to operators. Last month, we paid our gas purchaser to take our gas because prices fell below contract price, and we paid the difference to the purchaser. Never in my 50 years in the oilfield has this ever happened. The result is, natural gas can be an expense to the production process with huge downsides to our predicted economics for profits on oil and gas developments.
- There is no way that the U.S oil production data is correct.
- We are bullish on 2026. The One Big Beautiful Bill Act tax breaks, lower interest rates and rising natural gas demand from LNG exports and data centers are set to strengthen our company’s outlook.
- The level of regulation is increasing because there is less human input to rules and regulations.
- The consensus view of lower oil prices hurts lenders and investors. The drumbeat that gasoline and crude oil prices are too high and inflationary fails to address the very small impact on consumers as well as the reality of the last 20 years’ real prices. Despite all of this, actual industry costs continue in one direction: up.
- While the recent improvement in natural gas prices is appreciated, I am increasingly concerned about the growing imbalance between energy demand and generation capacity. The rapid expansion of AI and data center infrastructure is driving significant economic growth, but it is also creating substantial additional power demand that current generation plans do not appear prepared to meet. If utilities are unable to scale supply accordingly, households may face much higher electricity and heating costs in the coming years. Such increases, potentially two to three times current levels, would place pressure on consumer budgets and could reduce overall economic growth. Balancing the benefits of AI driven productivity with the need for affordable and reliable energy should be a priority.
- If the administration succeeds in ending the Ukraine conflict and Russian sanctions are lifted, oil markets will likely be oversupplied in 2026. However, if Russian sanctions continue, along with reduced oil volumes from Iran and Venezuela, markets may approach a balanced position. This leads us to forecast oil prices between $45 and $60 per barrel for most of 2026. Returns on capital expenditures are only sufficient if costs to drill and complete wells remain low. Our company now runs one drilling rig, compared to three rigs earlier in 2025. Our projected drilling schedule for the next several years contemplates one drilling rig of activity.
- The supply-demand issues for natural gas are finally heading into a bull phase. Liquefied natural gas (LNG) and the expected demand on electric grids are coming. The administration’s policies to bring in foreign investments will increase energy demand. More people working means more energy demand. The administration’s trade policy is forcing balancing, and many countries have to buy LNG to offset their trade deficits with America.
- Increased artificial intelligence utilization has resulted in a correlative need for large data centers. Additional energy will be needed to power the data centers. It appears likely, therefore, that the price of natural gas will increase. All of this will likely cause construction costs to rise as increased infrastructure build-outs occur. Higher natural gas prices will likely cause elevated drilling and completion activity. Higher labor and material costs due to this increased activity would not be surprising. Tariffs on imported goods and services needed for this increased activity will also likely continue to drive costs higher.
- California's regulatory bureaucracy is effectively killing the oil and gas operators and, in that process, has created significant energy security issues for the western United States. The ongoing state issues have blocked financing and partner interests from even considering investments in the state, whose bureaucracy is strangling independents, majors, pipeline companies and refineries. This situation needs significant attention and potential intervention.
- My belief is that the administration is coordinating with Saudi Arabia to either talk about or add additional barrels to the market, which could create leverage over Russian negotiations and also suppress oil price inflationary impacts through the upcoming 2026 midterm election.
- The increase in natural gas prices is positively affecting our business.
- Until the midterm elections next November are over, the price of crude oil will stay artificially depressed.
- I believe the glut in the global oil market is overstated and, if applicable, temporary. In any event, if the number of wells drilled declines to any significant degree as some commentators suggest, there will not be a glut, and [there] likely [will be] a decline in U.S. oil production given the obvious rate of depletion of existing wells. I see a constant base of demand for crude at the current level for next year and demand for natural gas increasing for the foreseeable future to meet the concurrent increase in energy generation now occurring. I believe that there will not be any dramatic change in the consumption of crude and [that there will be] an increase in the demand for natural gas.
- The higher natural gas prices we are seeing now are probably due more to the increased concentration in the Marcellus–Utica and coordination among the intrastate pipes and marketers in Texas.
Oil and gas support services firms
- We continue to monitor with concern how geopolitical events and tariffs are impacting our supply chain and operating environments.
- Steel tariffs are causing significant increases in well costs.
- Mergers and acquisitions seem to have slowed, and the rig count seems to have settled down after the completion of streamlining operations from mergers. Activity appears more or less consistent from the third quarter of 2025 to the fourth quarter for us, with not much new popping in the fourth quarter. There is chatter about activity picking up in 2026, but currently it feels like operators are waiting to see how oil prices trend, with a large amount of uncertainty coming from the global geopolitical stage. It seems there is a growing comfort with non-Permian plays between operators feeling like Permian acreage is expensive and gas prices supporting more Haynesville activity. With Permian heavy operations, we're exploring out-of-basin work and waiting to see what Permian operators do next.
- OPEC is back in the driver’s seat. Clients are concerned about a potentially large oil glut in first and second quarters of 2026.
- The activity level is still slowing.
- The prospect of a Russian-Ukrainian deal that potentially could let Russia re-enter the market is creating a negative overhang, particularly on LNG exports.
- The licensing of seismic data normally peaks in the fourth quarter, and this year it is meeting that expectation.
Questions regarding the Dallas Fed Energy Survey can be addressed to Michael Plante at Michael.Plante@dal.frb.org or Kunal Patel at Kunal.Patel@dal.frb.org.
Sign up for our email alert to be automatically notified as soon as the latest Dallas Fed Energy Survey is released on the web. For additional energy-related academic research and market analysis, please visit the Dallas Fed’s Center for Energy and the Economy.