Permian Basin
The Permian Basin is one of the nation's oldest oil and gas producing regions. After a long period of decline, the Basin has seen a major revival over the past decade thanks to the introduction of horizontal drilling and hydraulic fracturing. Using the tabs below, learn more about the region's century-long history and explore how changes in production have affected labor markets and business activity.
| Highlights |
|---|
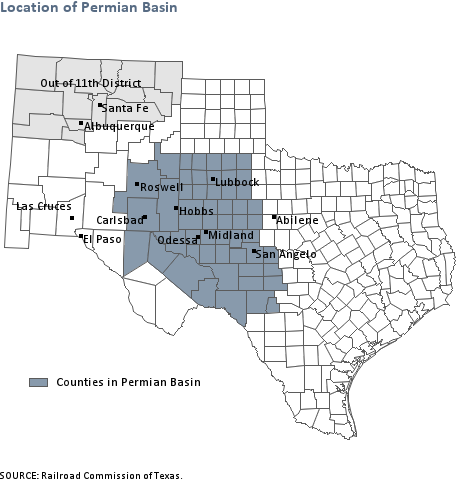
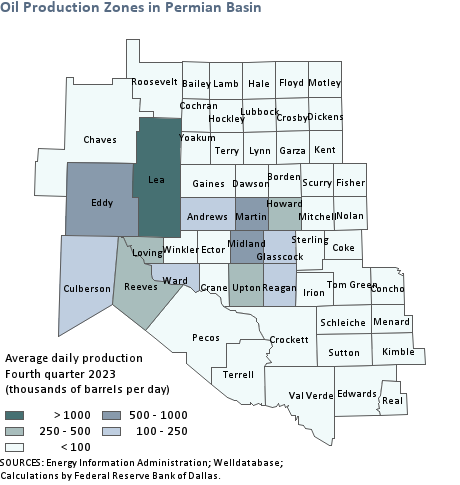
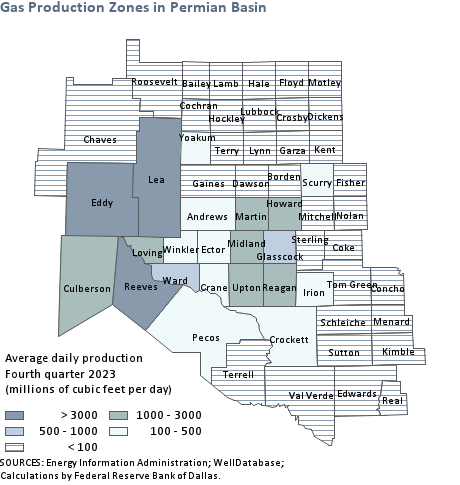
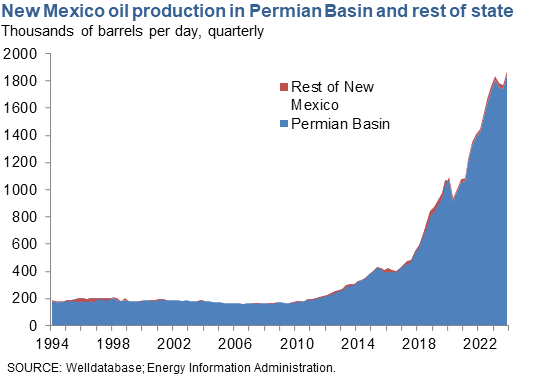
The Permian Basin covers 55 counties in West Texas and southeast New Mexico. The region has been producing for nearly a century and still contains large resources of oil and natural gas. During fourth quarter 2024, the top three counties in terms of crude oil production for the Permian Basin were Lea County (1.2 million barrels per day (mb/d)), Eddy (0.9 mb/d) and Martin (0.7 mb/d). Eddy county is by the region's largest producer of natural gas, with production averaging 4.9 billion cubic feet per day in fourth quarter 2024. Both Lea and Eddy county are in New Mexico. [1] Major cities in the Permian Basin are Midland, Odessa, and Hobbs. |
Notes
- For more information on the computation of county-level production, see Energy Data Explanatory Notes and Resources.
The Permian Basin’s long history is characterized by ups and downs. W.H. Abrams drilled the first well in 1920, but it produced only 10 barrels of oil per day. Although many experts considered the region a “petroleum graveyard,” Texon Energy tried again in August 1921. It spudded a well in Reagan County, near Big Lake, Texas. Its cable-driven drill descended less than 5 feet per day, so progress was slow. After several months without success, a particularly nervous investor sprinkled rose petals over the site and christened the well Santa Rita in honor of the Patron Saint of the Impossible. His commitment paid off after nearly two years of drilling when oil burst out of Santa Rita No. 1 in May 1923. The well produced for nearly 70 years before it was capped in 1990.
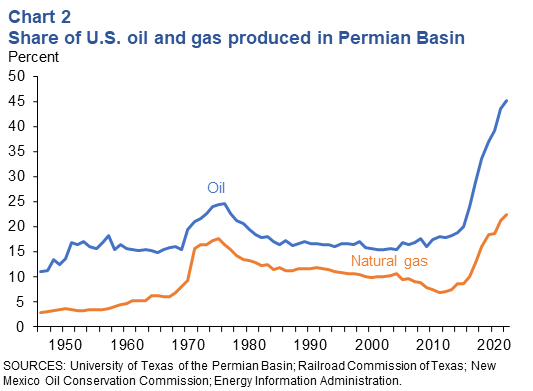
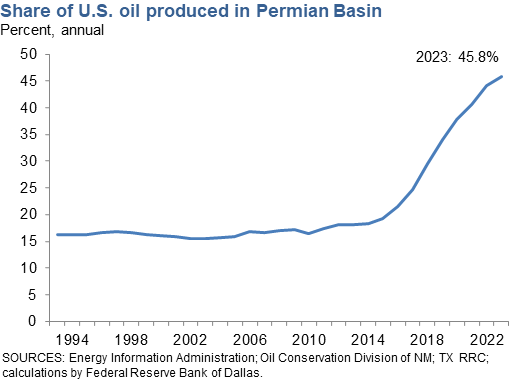
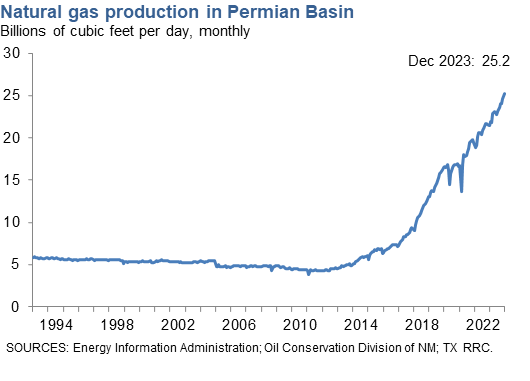
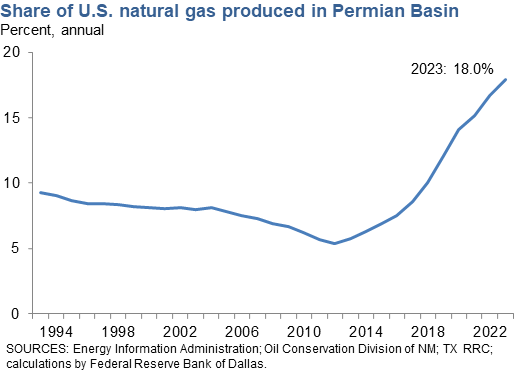
The Santa Rita discovery prompted many investors to explore the Permian Basin, which is noted for its size and diversity. It covers over 75,000 square miles in West Texas and southeast New Mexico, consisting of several layers of rock that contain vast reserves of oil and natural gas. In the three decades following Santa Rita, discoveries of these resources led to large and steady increases in oil and gas production. Oil production peaked at nearly 2 million barrels per day in the early 1970s and gas production soared to almost 10 billion cubic feet per day (Chart 1). During this boom, the Permian Basin accounted for over 20 percent of U.S. oil supply and 15 percent of U.S. natural gas supply (Chart 2).
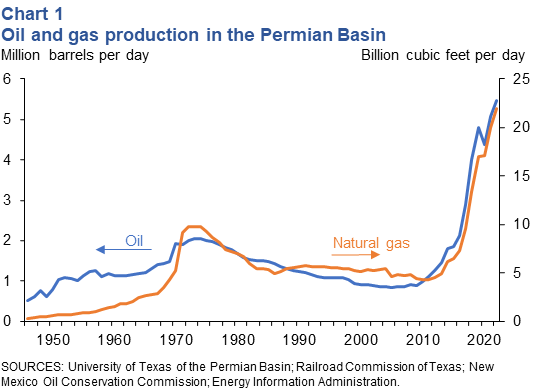
Shortly after hitting its peak, though, production began declining in the Basin and continued to do so for several decades. By the mid-2000s, oil production had declined by almost 60 percent from its high point in the early 1970s. This trend would likely have continued into the present day were it not for the introduction of horizontal drilling and hydraulic fracturing in the early 2010s, which has led to a major revival of the Basin over the past decade.
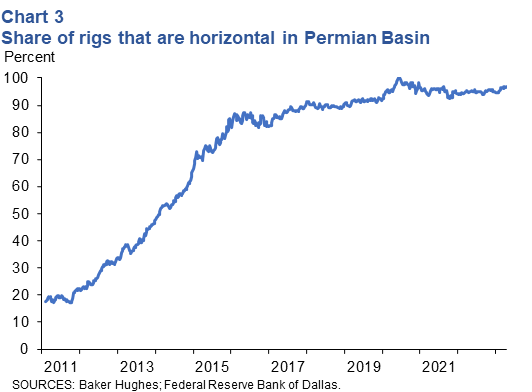
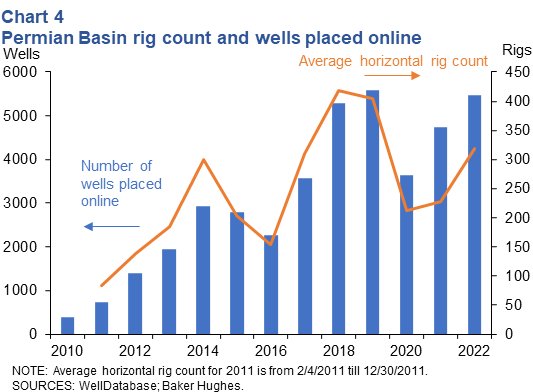
Horizontal wells require more capital expenditures than traditional vertical wells, but they generally produce much more oil and gas. A growing number of operators decided to apply these techniques in the Basin and by the end of 2014, the share of rigs dedicated to horizontal drilling exceeded 65 percent (Chart 3). This went hand in hand with a significant increase in the number of rigs operating in the area and the number of wells placed online (Chart 4), as well as a turnaround in crude oil production (Chart 1). The share of rigs dedicated to horizontal drilling has continued rising over time, reaching 90 percent in 2018 and 95 percent in 2022.
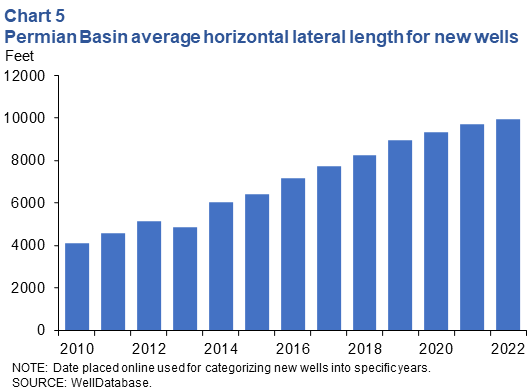
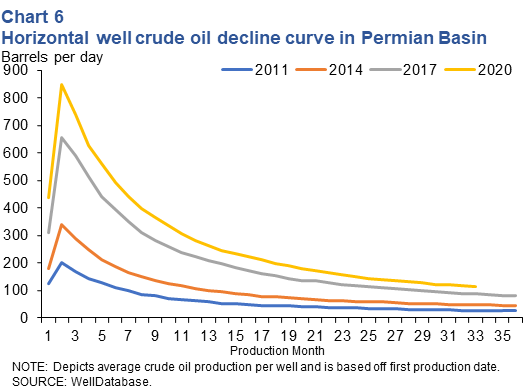
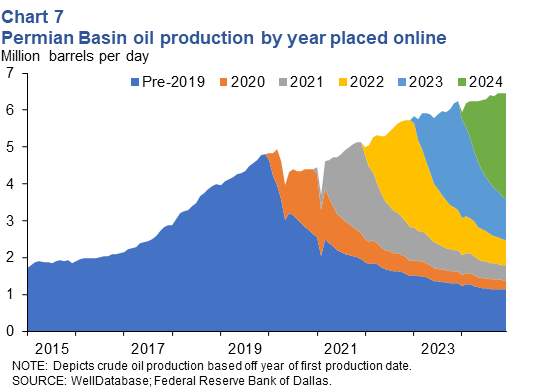
Over time, companies have found a variety of ways to improve upon the original processes used to drill and complete horizontal wells. For example, advances such as pad drilling, 24/7 operations and simul-frac have helped service companies reduce drilling and completion times significantly. Companies have also found ways to increase the lateral length - the distance the well goes horizontally. This length has increased from roughly 4,000 feet in 2010 to near 10,000 feet in 2022 (Chart 5). As a result of these and other improvements, companies were able to vastly improve production rates for new horizontal wells over time (Chart 6).
Although the boom was spurred in part by technological advances, drilling activity has remained sensitive to the price of oil. In particular, the first phase of the boom in the Permian Basin was supported by a period of relatively high crude oil prices and investor interest in the industry. At the end of 2014, though, the price of oil fell precipitously. This led to a wave of bankruptcies in the industry and a sharp cutback in drilling activity both in and outside the Permian. Spurred by lower prices and a greater push by investors to achieve profitability, companies that survived the bust directed drilling activity towards their most productive assets and made efforts to cut costs and increase productivity.
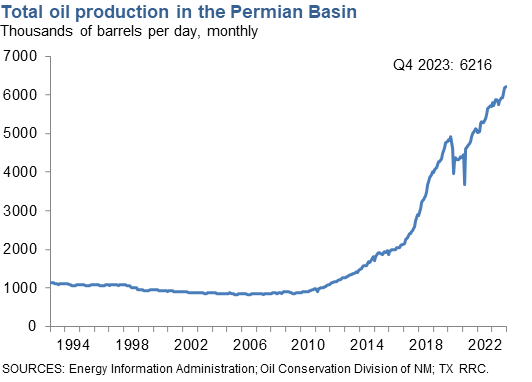
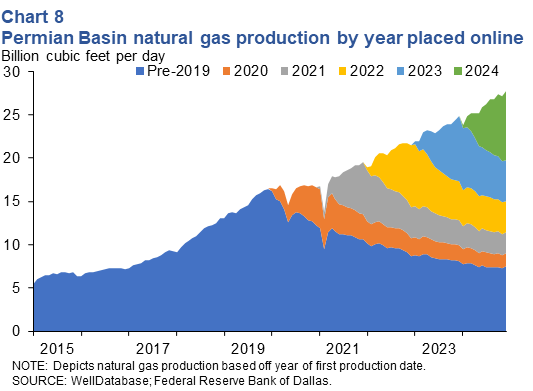
These efforts were particularly fruitful in the Permian. Drilling activity began recovering in 2016, as did production, which reached 2 million barrels per day at the end of the year. Production continued rising and by the end of 2019 reached 4.8 million barrels per day. The coronavirus pandemic, which dramatically reduced the world's demand for oil, put an end to that trend in 2020 but production started growing again the following year. By late 2024, crude oil production had grown to 6.5 million barrels per day. If it were a country, the Permian Basin would be one of the largest producers of oil in the world. And while the area receives much attention for its oil production, it has also become a major producer of natural gas and of natural gas liquids.
Sources
- Santa Rita taps Permian Basin, American Oil & Gas Historical Society.
- Drilling Productivity Report, U.S. Energy Information Administration.
| Highlights |
|---|
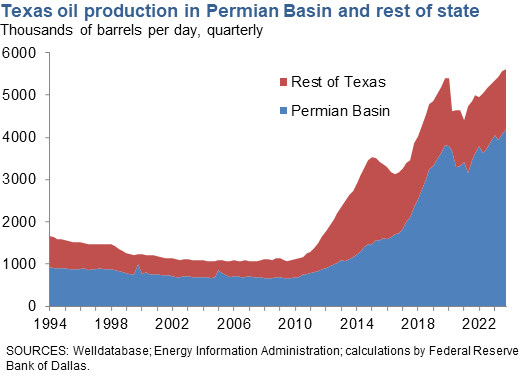
After many years of decline, oil production in the Permian Basin began climbing at the start of 2010. Since then, production increases have averaged 14 percent per year. The share of U.S. oil produced in the Permian Basin has also increased since 2010. In 2024, the Permian Basin accounted for 47 percent of U.S. oil, up from 18 percent in 2013. The Texas counties in the Permian Basin produce over 4.4 million barrels per day in fourth quarter 2024. In New Mexico, the four counties in the Permian Basin dominate oil production, accounting for over 90 percent of state supply.[1] |
| Oil Production Fourth quarter 2024 |
||
|---|---|---|
| Barrels per day (millions) |
Year/year change (percent) |
|
| Texas | ||
| Permian counties | 4.4 | 2 |
| Rest of Texas | 1.4 | 5 |
| New Mexico | ||
| Permian counties | 2.1 | 12 |
| Rest of New Mexico | 0.02 | –8 |
| SOURCES: Energy Information Administration; Railroad Commission of Texas; WellDatabase; Oil Conservation Division of New Mexico; calculations by Federal Reserve Bank of Dallas | ||
Notes
- For more information on the computation of state-level production, see Energy Data Explantory Notes and Resources.
| Highlights |
|---|
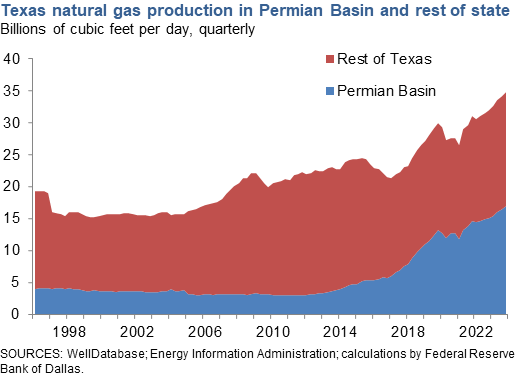
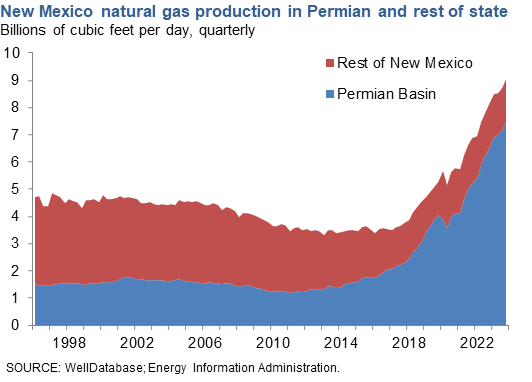
Since mid-2011, natural gas production in the region has increased, rising over 500 percent. The share of U.S. natural gas produced in the Permian Basin has also ticked up since 2011. In 2024, the region accounted for 21 percent of U.S. production, up from 6 percent in 2011. The Texas counties in the Permian Basin produce the majority of the region's natural gas, and these counties have recorded strong natural production increases from 2012-2024. Production in fourth quarter 2024 was over 500 percent higher than production in first quarter 2011.[1] Similar to the Texas Permian counties, the New Mexico counties in the Permian Basin have experienced growth in natural gas production. Production in fourth quarter 2023 was over 600 percent higher than production in first quarter 2011.[1] |
| Natural Gas Production Fourth quarter 2024 |
||
|---|---|---|
| Cubic feet per day (billions) |
Year/year change (percent) |
|
| Texas | ||
| Permian counties | 17 | 6 |
| Rest of Texas | 16 | 6 |
| New Mexico | ||
| Permian counties | 9 | 18 |
| Rest of New Mexico | 2 | 5 |
| SOURCES: Energy Information Administration; Railroad Commission of Texas; WellDatabase; Oil Conservation Division of New Mexico; calculations by Federal Reserve Bank of Dallas | ||
 ">
">
Notes
- For more information on the computation of state-level production, see Energy Data Explantory Notes and Resources.
| Highlights |
|---|
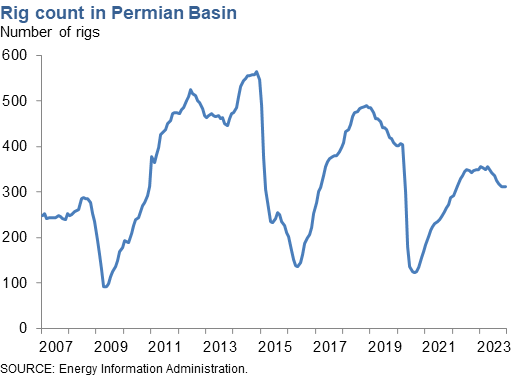
The rig count in the Permian Basin increased steadily from mid-2009 to mid-2012. In May 2009, just 92 rigs operated in the Permian Basin; by June 2012, there were 525 active rigs in the region. The rig count declined in the second half of 2012, leveling off in 2013 at around 465 rigs. The Permian rig count increased steadily for most of 2014, reaching the peak of 565 in October 2014 before falling oil prices began to drive the rig count down. The rig count has partially recovered in the Permian since then, although improvements in productivity has allowed companies to drill more with fewer rigs. |
| Rig Count December 2025 |
||
|---|---|---|
| Number of rigs | Year/year change (percent) |
|
| Permian Basin | 248 | –18 |
| SOURCE: Baker Hughes. | ||
| Highlights |
|---|
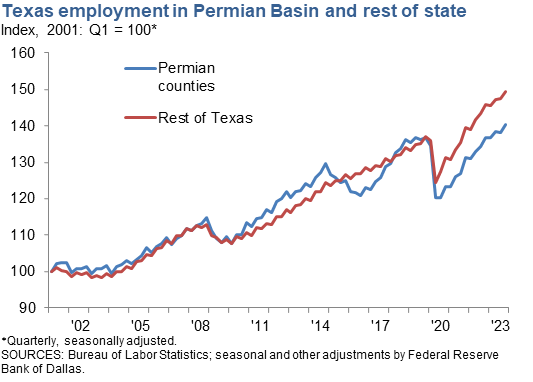
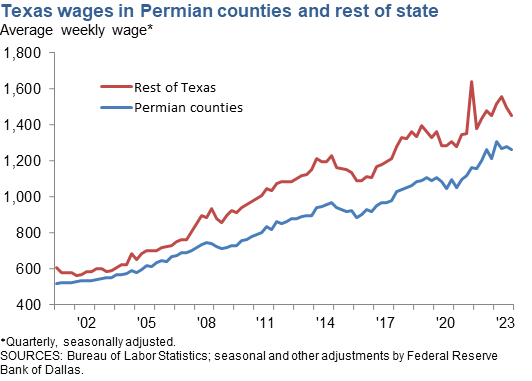
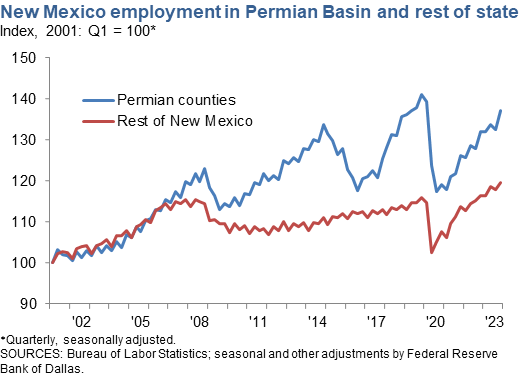
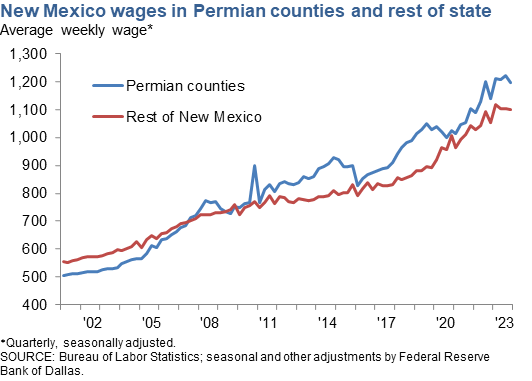
The Texas Permian counties enjoyed strong employment growth through the end of 2014. In first quarter 2015, falling oil prices led employment in these counties to fall for the first time since 2009. Since 2014, the price of oil has influenced employment growth or declines in Texas Permian counties. Meanwhile, the rest of Texas has generally seen steady growth outside the coronavirus pandemic. Wages in the Texas Permian counties remain lower than in the rest of the state. In New Mexico, the differences in employment growth between the Permian counties and the rest of the state are particularly stark. Employment in the Permian counties has fully recovered from the recession in 2008. The rest of New Mexico had remained below prerecession levels until it recovered in fourth quarter 2019. Average weekly wages in the New Mexico Permian counties have also grown strongly in the last decade, allowing wages in the region to surpass those in the rest of the state. |
| Employment Fourth quarter 2024 |
||
|---|---|---|
| Employment (thousands) |
Year/year change (percent) |
|
| Texas | ||
| Permian counties | 555 | 1.8 |
| Rest of Texas | 13,462 | 1.7 |
| New Mexico | ||
| Permian counties | 94 | 2.2 |
| Rest of New Mexico | 778 | 1.1 |
| SOURCE: Bureau of Labor Statistics. | ||
| Wages Fourth quarter 2024 |
||
|---|---|---|
| Average weekly wage (dollars) | Year/year change (percent) |
|
| Texas | ||
| Permian counties | $1,341 | 4.3 |
| Rest of Texas | $1,544 | 4.9 |
| New Mexico | ||
| Permian counties | $1,269 | 4.4 |
| Rest of New Mexico | $1,178 | 5.5 |
| SOURCE: Bureau of Labor Statistics. | ||
- Energy Data Explanatory Notes and Resources
Describes the methodology used to compute production state-level production in the Permian Basin. - Permian Basin Economic Indicators
- Break-even prices for the Permian Basin
- New Mexico fuels U.S. crude oil output, funding for local programs
- Anticipated federal restrictions would slow Permian Basin production
- Looking Back: Shale Oil Boom Gave Permian Basin a Second Life, Jesse Thompson, Southwest Economy, First Quarter 2022.
- Spotlight: Oil Patch Productivity Rises; Jobs Vanish, Garrett Golding and Sean Howard, Southwest Economy, Second Quarter 2021.
- Spotlight: Permian’s Shale-Era Oil Production Rises Even as Rig Count Falls, Emma Marshall and Jesse Thompson, Southwest Economy, First Quarter 2020.