
Permian Basin’s shale-era oil production rises even as rig count falls
A change in the number of active drilling rigs is no longer the reliable predictor for near-term oil production growth that it once was.
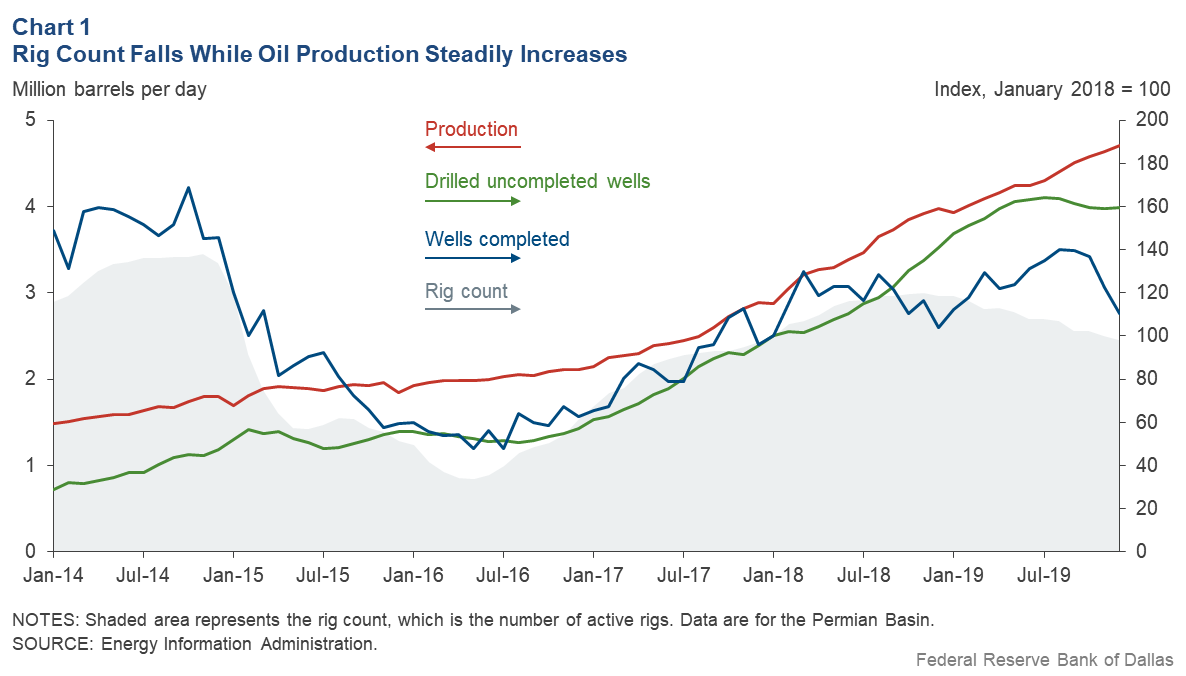
Nowhere is this clearer than in the Permian Basin of West Texas and eastern New Mexico—by far the nation’s largest shale oil production region. There, the number of rigs drilling for oil fell from 484 in August 2018 to 402 in December 2019, an almost 17 percent decline. Despite this, crude oil production increased 29 percent during the period (Chart 1).
This interplay will likely become a key part of the sector’s response to the sudden, sharp oil price decline in March.
Changing Production Pattern
Benchmark West Texas Intermediate crude oil priced in Cushing, Oklahoma—a hub for oil storage and pricing—dropped from $70 a barrel in August 2018 to a low of $45 per barrel at year-end 2018. Consistent with historical patterns, drilling activity started to decline a few months after oil prices began to fall.
Experience suggests this pattern would diminish production growth within six to eight months. However, Permian production grew by 0.7 million barrels per day in 2019. Energy firms accomplished this by completing more wells drilled earlier, drilling horizontally and increasing the total length of wells.
As firms were laying down rigs, the number of drilled but uncompleted wells (DUCs) rose 35 percent—to 3,600 wells—from August 2018 to December 2019, according to Energy Information Administration (EIA) estimates.[1]
Producers have worked through this inventory by completing the wells. The number of wells completed—those that have gone through hydraulic fracturing and been brought into production—increased from 445 to 485 per month in 2019. The number peaked at 555 last August, despite decreased drilling. Conversion of DUCs from past operations into producing wells accounts for the production gain.
Changing Well Composition
Since 2014, the composition of wells drilled has changed. The share of rigs drilling horizontally rose from 50 percent to 90 percent from 2014 to 2019—leaving only 26 rigs drilling vertically, previously the conventional means of drilling.
A horizontal well coupled with hydraulic fracturing gives producers access to more oil per foot of pipe because the driller can follow underground layers of shale rock.
Moreover, the length of wells also increased—the average lateral well length was 6,000 feet in 2016 but increased to approximately 8,500 feet in second quarter 2019.[2]
These longer sections of horizontal pipe—and rising volumes of sand to prop open the fractures through which oil and gas flow—tend to increase well production.
More Oil, Fewer Rigs
Production per rig has risen rapidly over the past several years due to changes in the number and mix of completed wells. In 2014, the EIA estimated that the average amount of oil produced per rig was 130 barrels per day. Last year, the amount per rig averaged 800 barrels per day.
The previous production gains demonstrate how productivity and technology advances in U.S. shale have shifted the implications of a changing rig count. The recent collapse of energy prices implies that drilling activity may be poised for another significant drop, yielding a decline in future production.
Notes
- Firms in Texas dispute these data. See the Dallas Fed Energy Survey, Third Quarter, 2019.
- “Permian Well Performance—More Complicated than It Appears,” Rystad Energy Shale Newsletter, October 2019, accessed Feb. 3, 2020.
About the Authors
Southwest Economy is published quarterly by the Federal Reserve Bank of Dallas. The views expressed are those of the authors and should not be attributed to the Federal Reserve Bank of Dallas or the Federal Reserve System.
Articles may be reprinted on the condition that the source is credited to the Federal Reserve Bank of Dallas.
Full publication is available online: https://www.dallasfed.org/research/swe/2020/swe2001.