Austin Economic Indicators

Austin economic growth remained robust in December. The Austin Business-Cycle Index accelerated as job growth remained above trend and the unemployment rate held at a very low level. Most indicators suggest that the regional real estate market picked up toward the end of last year, although multifamily activity appeared to cool after surging in the second quarter.
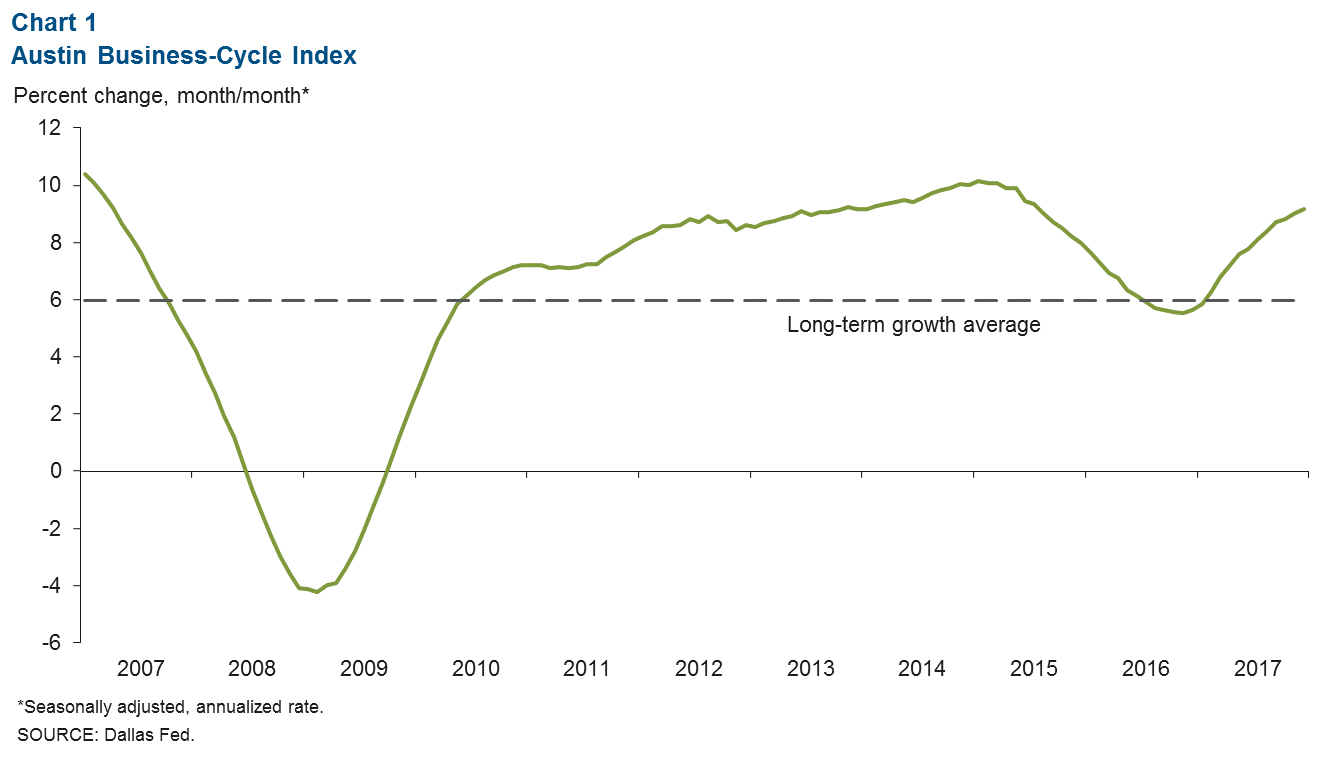
Business-Cycle Index
The Austin Business-Cycle Index grew at a 9.2 percent annualized pace in December, well above its long-term average of 6 percent (Chart 1). Recent strength in employment growth and a gradual decline in the unemployment rate throughout 2017 propelled growth in the index.
Labor Market
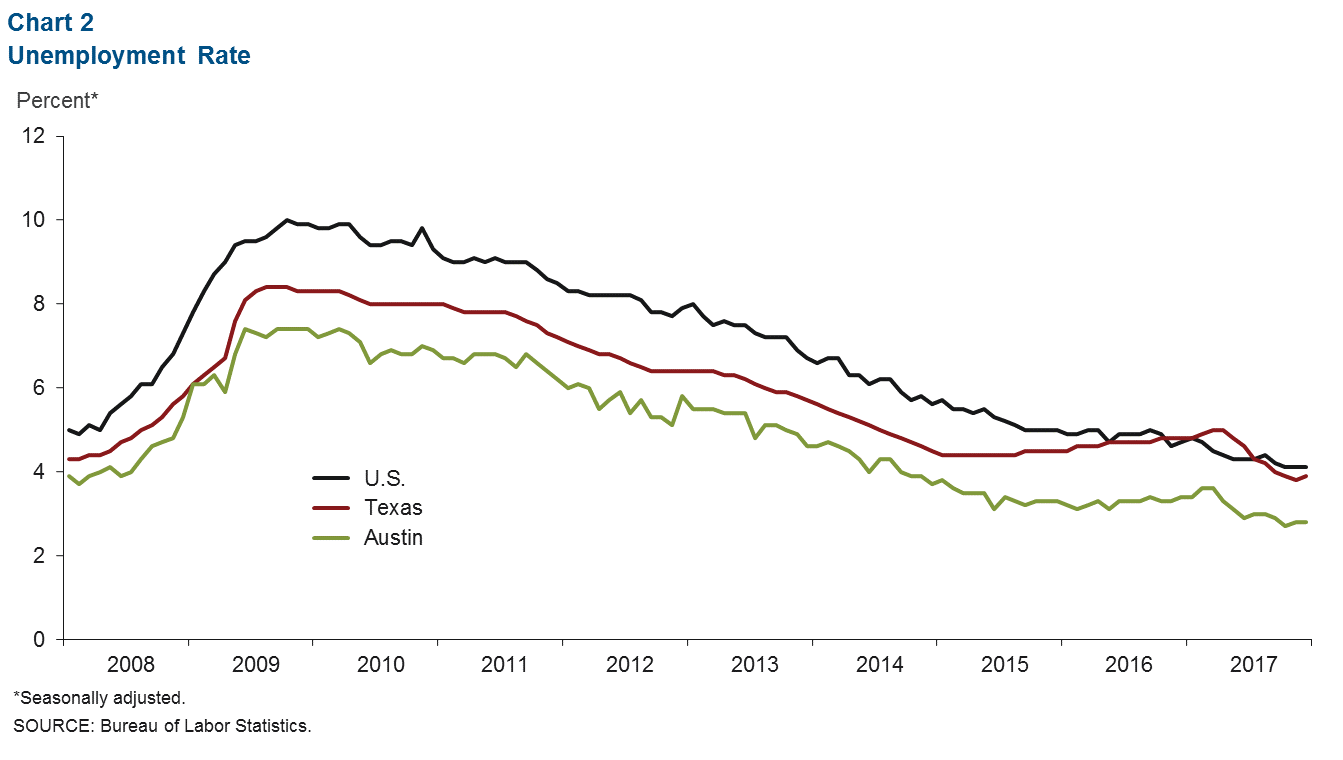
Unemployment Rate Near Multi-Decade Low
The Austin unemployment rate held steady at 2.8 percent in December 2017 (Chart 2). This is well below the state and national jobless rates of 3.9 and 4.1 percent, respectively, and is indicative of a very tight labor market. Nevertheless, the regional labor force expanded in December at an annualized 8.5 percent in Austin, and growth for all of 2017 was 3.2 percent, which was second only to San Antonio among the large Texas metros.
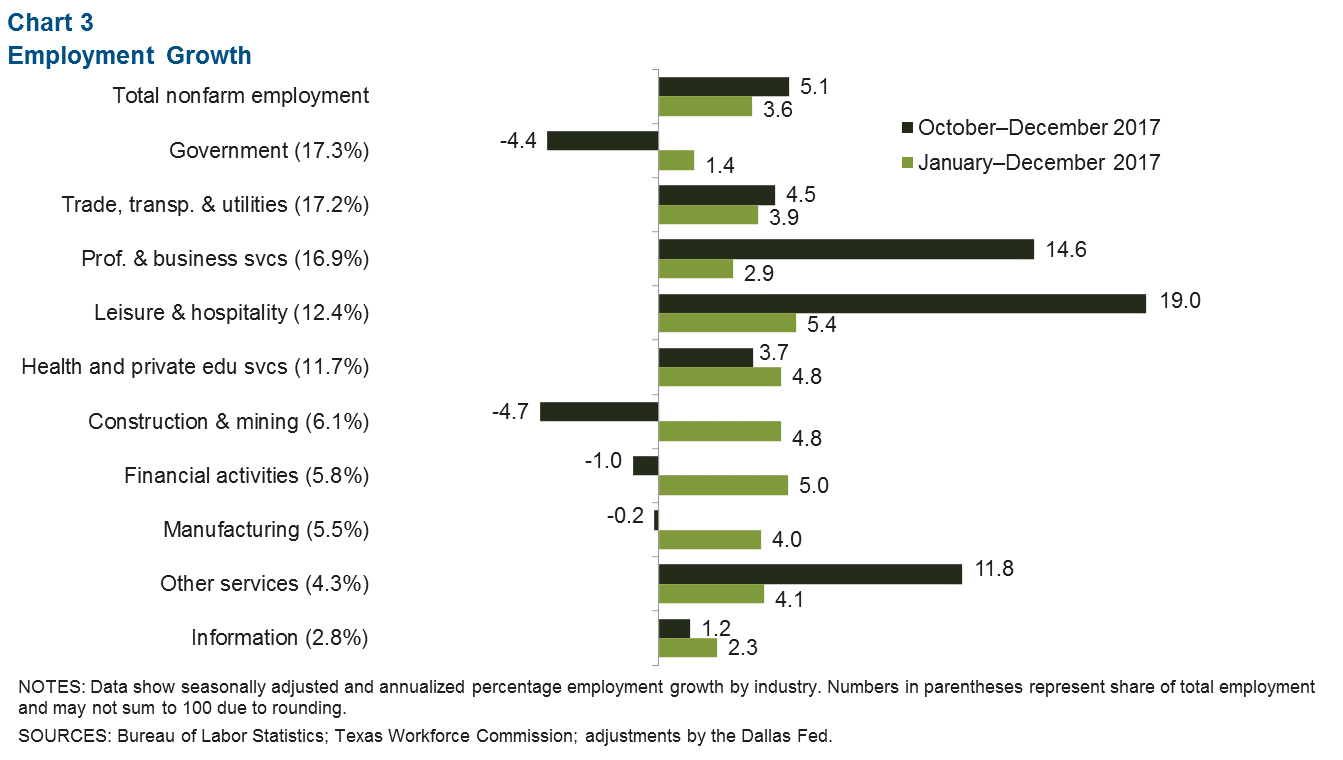
Job Growth Accelerating
Jobs in Austin grew at a 5.1 percent annualized rate over fourth quarter 2017 (Chart 3). Growth was led by a strong surge in leisure and hospitality hiring, much of this in food services. Professional and business services hiring was also strong, particularly for temporary workers, which may be an indicator of stronger full-time hiring in the near future. Trade, transportation and utilities saw a moderate 4.5 percent increase, in part due to a recovery in retail hiring. Meanwhile, federal government employment declined sharply, accounting for weakness in public-sector jobs, and construction saw a moderate decline despite the continued hiring for specialty-trade contractors.
Hourly Earnings Increased
Private-sector hourly wages rose in Austin, as the three-month average increased to $28.63 (Chart 4). Austin average wages continue to remain well above the state and national averages. Despite the recent pickup, however, 2017 wage growth in Austin—at 2.3 percent year over year—was below the state’s 3.0 percent increase.

Real Estate
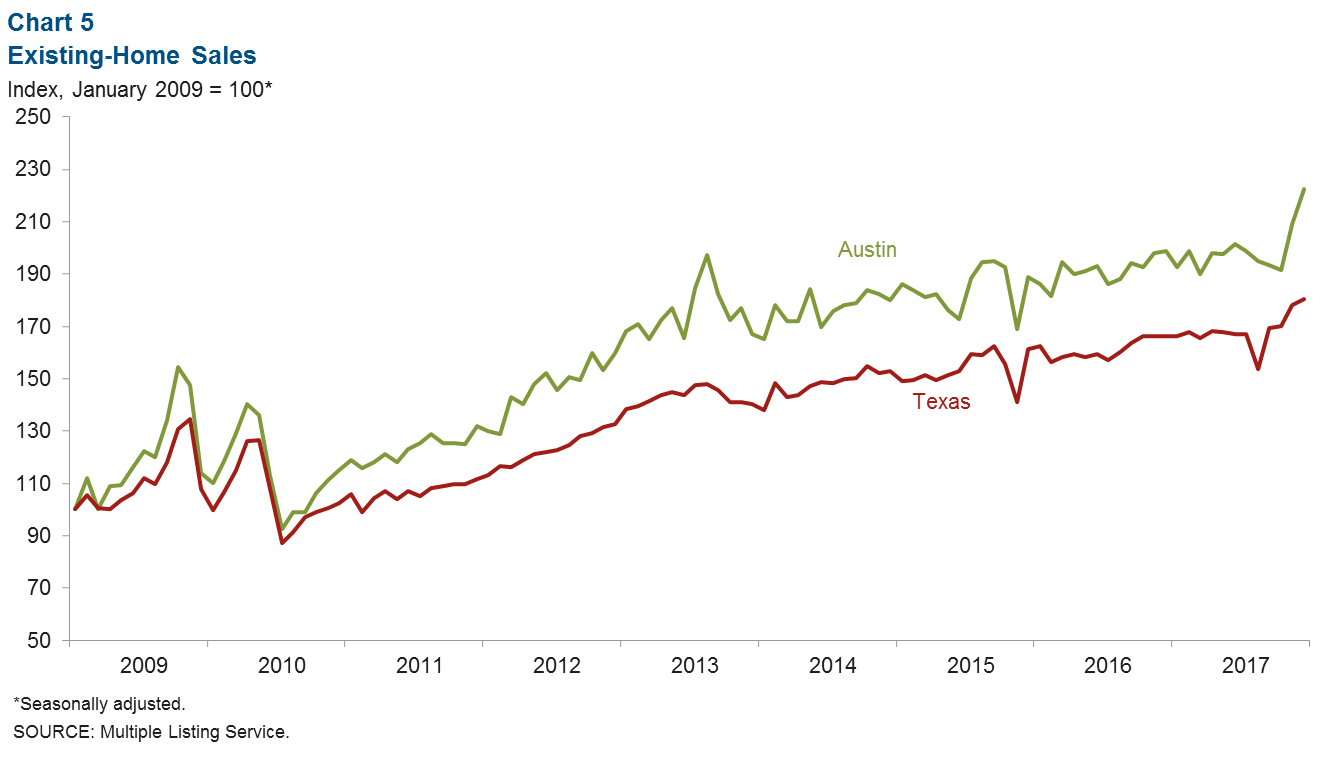
Home Sales Reach Record High
Home sales in Austin surged in December 2017, rising to a new high of 3,163 (Chart 5). However, total sales for the year were up just 4.1 percent compared with 2016, slightly below the 4.5 percent increase in the state average. The median home price in December also reached a record high of $308,104, a 5.3 percent increase from the prior year. December home inventories remained at a lean 2.6 months’ supply, indicating strong activity in Austin’s residential real estate markets.
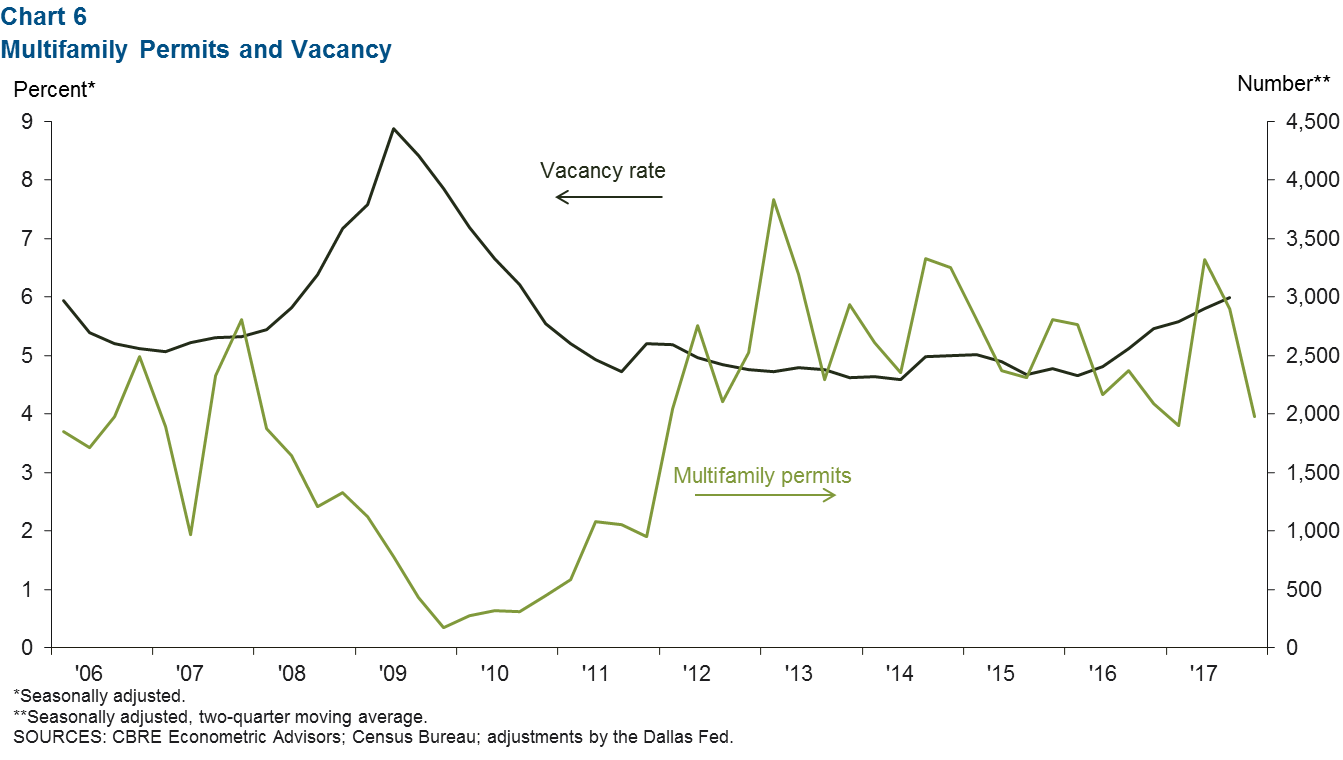
Multifamily Activity Moderating
The vacancy rate for multifamily units has crept up in Austin, rising from a low in mid-2016 to a seasonally adjusted 6.0 percent in third quarter 2017 (Chart 6). This is slightly above the 5.6 percent average since 1994. Meanwhile, permits for new multifamily construction dipped in the second half of last year after surging in the second quarter.
NOTE: Data may not match previously published numbers due to revisions.
About Austin Economic Indicators
Questions can be addressed to Christopher Slijk at christopher.slijk@dal.frb.org. Austin Economic Indicators is released on the first Thursday of every month.