Austin Economic Indicators

The Austin economy grew at a strong pace in November. The Austin Business-Cycle Index expanded and remained above its long-term trend. Employment growth by sector was mixed, with the health and education services sector continuing its surge and financial activities declining. Hourly wages were unchanged, while home construction permits weakened and housing affordability improved.
Business-Cycle Index
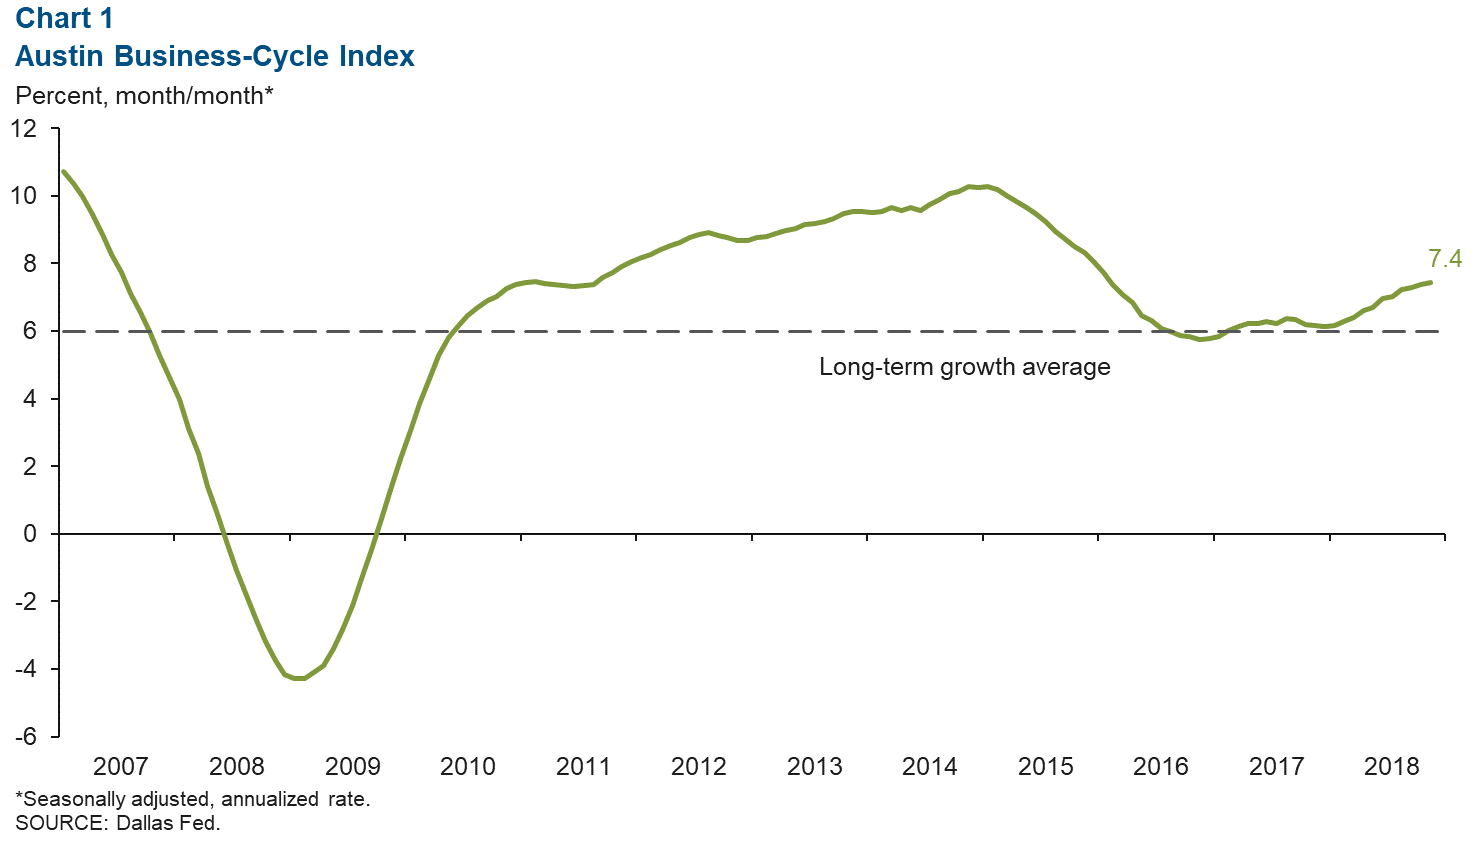
The Austin Business-Cycle Index expanded at a 7.4 percent annualized rate in November, well above the long-run average of 6.0 percent (Chart 1). Jobs declined in November, while the unemployment rate lingered at a low 2.8 percent.
Labor Market
Unemployment Rate Remains Low
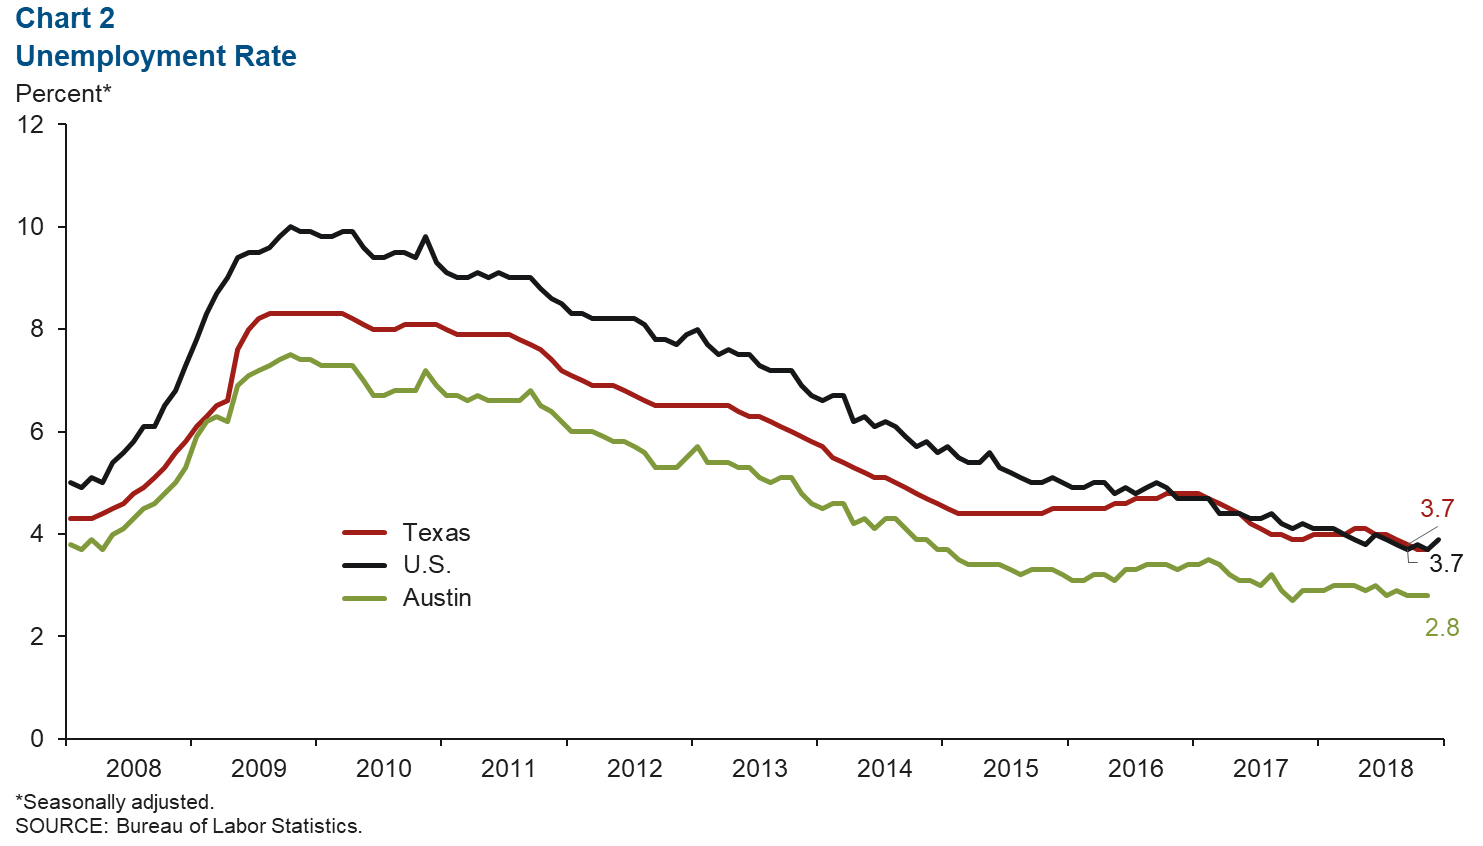
Austin’s unemployment rate of 2.8 percent was well below the state and national rates, both of which stood at 3.7 percent in November (Chart 2). (The U.S. rate rose to 3.9 percent in December.) The metro’s labor force has expanded an annualized 3.3 percent year to date, compared with the state’s 2.2 percent growth.
Employment Accelerates Through November
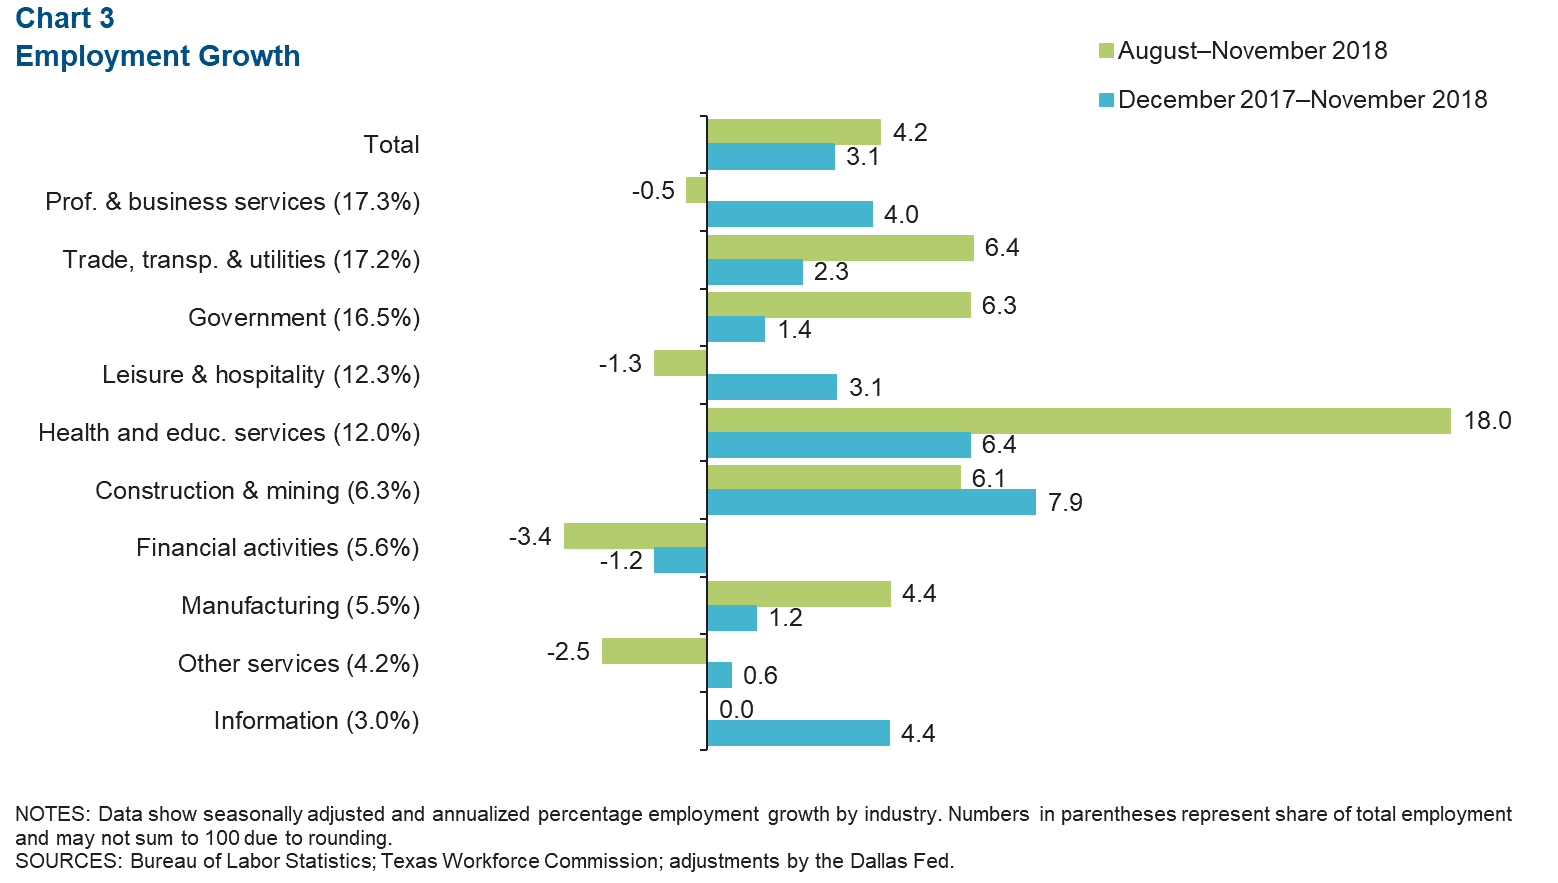
Austin employment expanded at a strong annualized rate of 4.2 percent from August to November (Chart 3). Performance by sector was mixed. Growth was primarily led by health and education services, which accelerated at a blazing annualized rate of 18 percent and created an additional 5,200 positions. Professional and business services and leisure and hospitality experienced small contractions after growing earlier in the year. Financial activities continued to decline and shed approximately 530 jobs during the three-month period.
Hourly Wages Steady
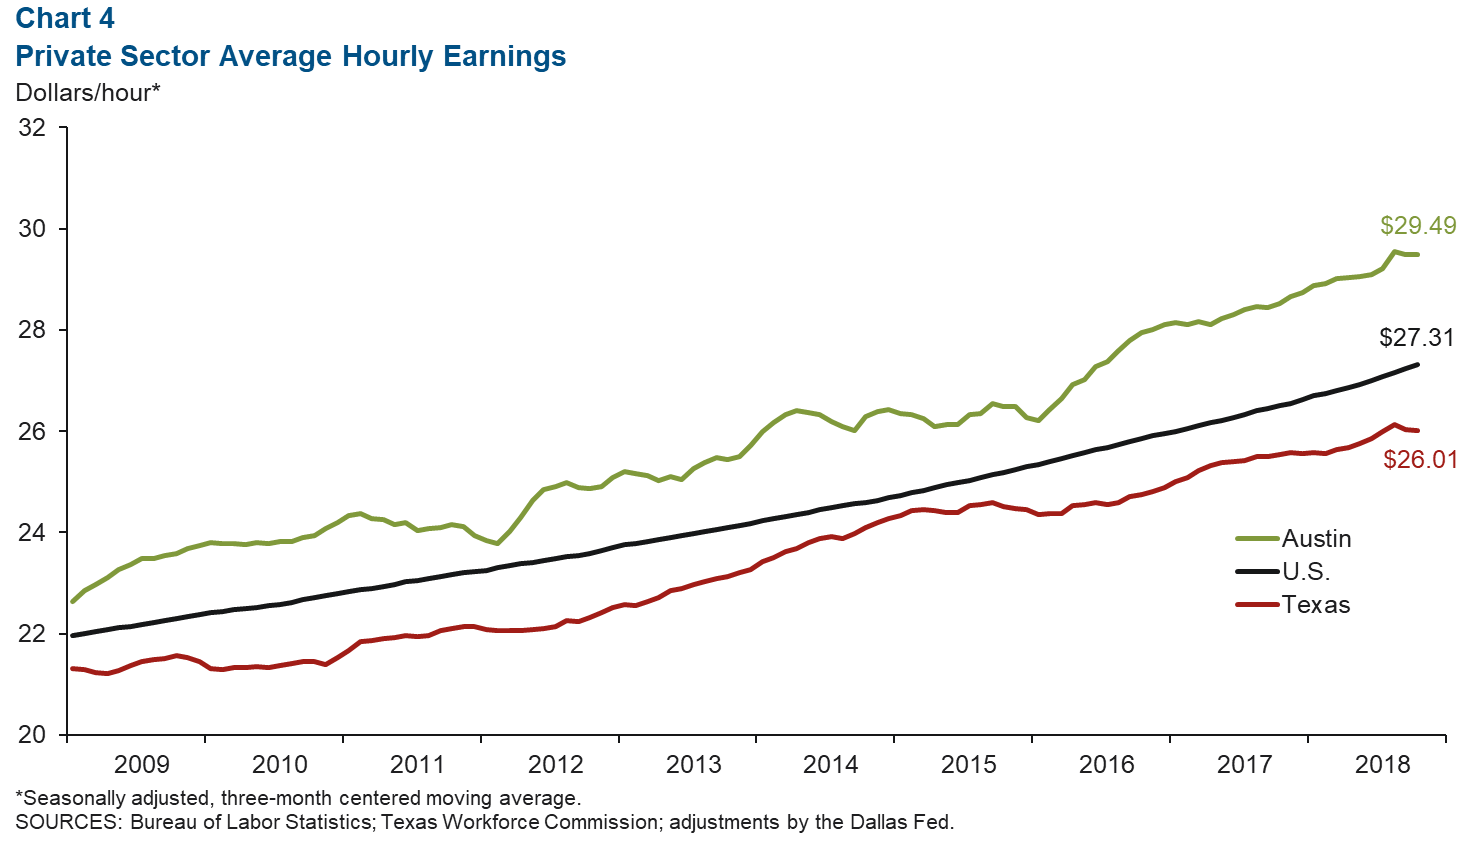
Austin’s three-month centered moving average for private sector hourly wages was unchanged in November from the previous month and stayed above the state and national averages (Chart 4). Year over year, Austin wages grew at a steady 2.9 percent rate in November, compared with 3.1 percent for the U.S. and 1.8 percent for Texas.
Real Estate
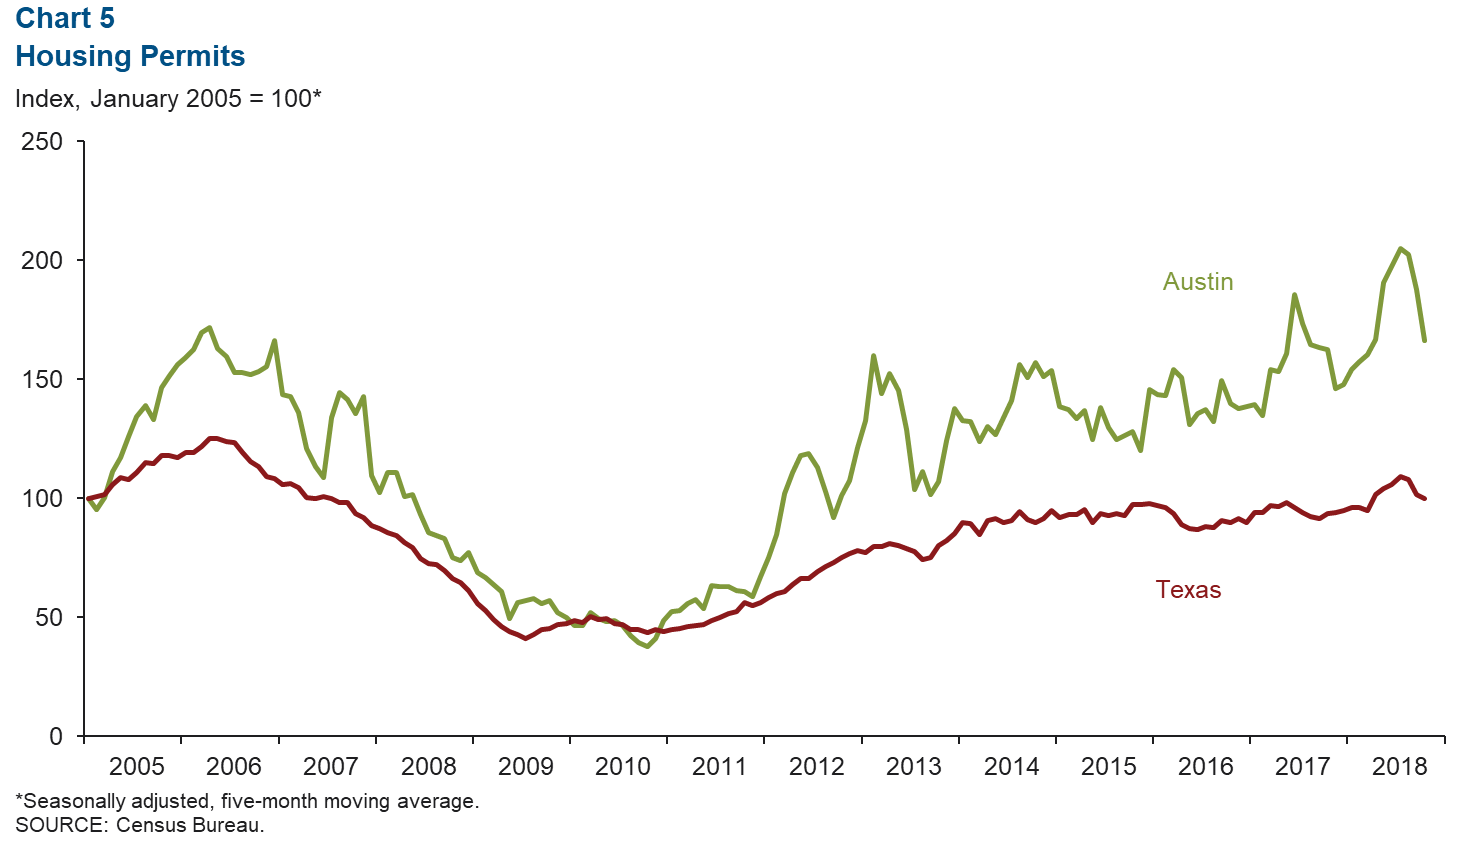
Housing Permits Decline
Total home construction permits for Austin dropped a hefty 11.5 percent in October, while Texas permits fell 1.9 percent (Chart 5). In the first 10 months of 2018, Austin permits increased 10.4 percent year over year, while Texas permits rose 6.2 percent. Home inventories in November were at 2.8 months’ supply, which is significantly below the six months considered a balanced market.
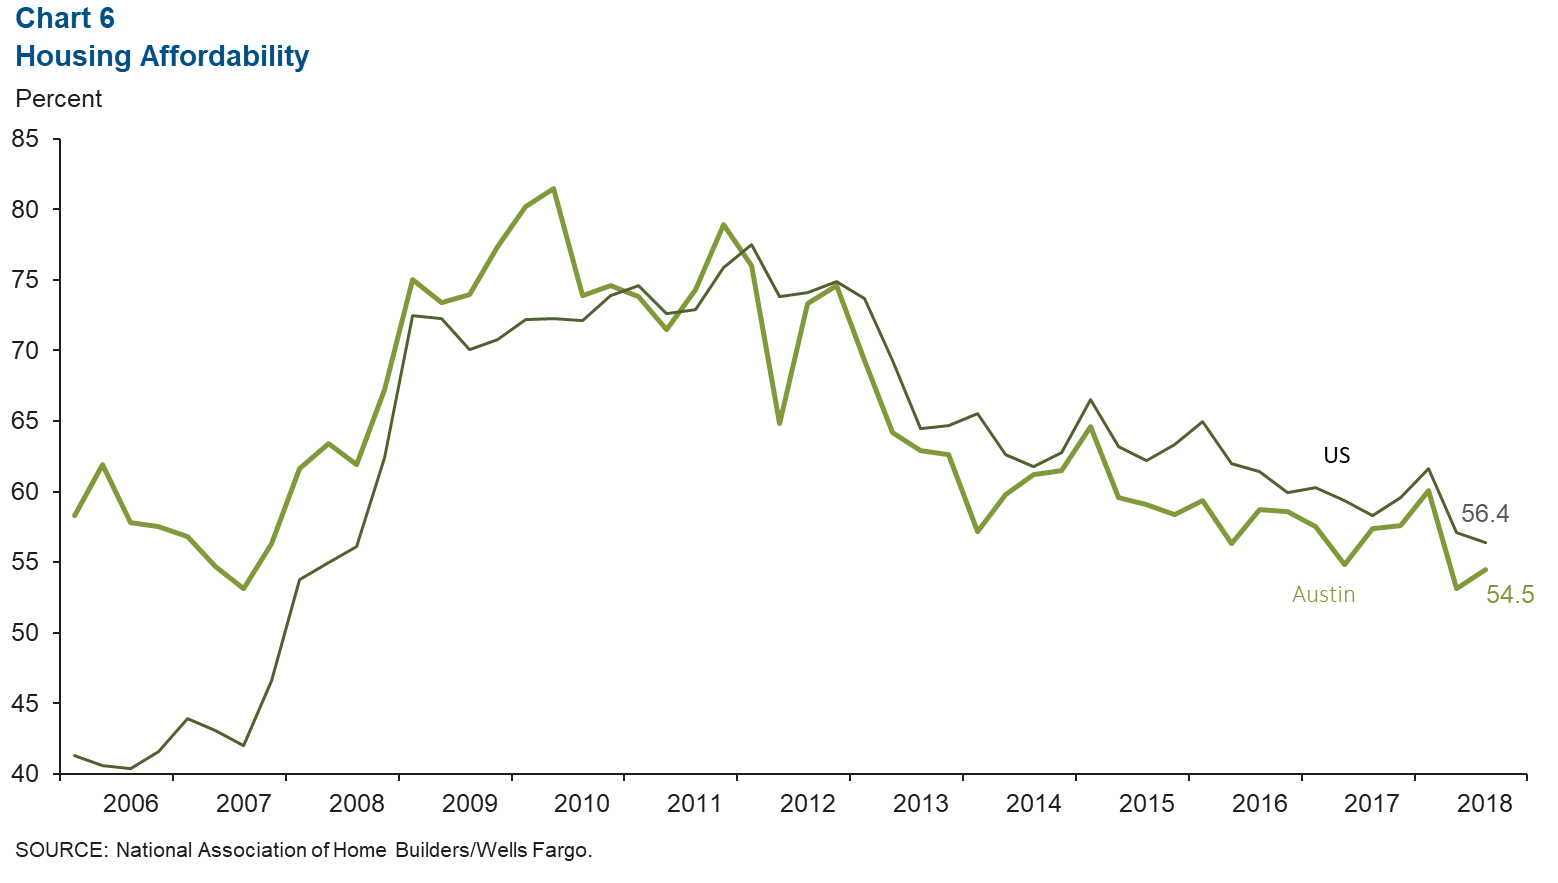
Housing Affordability Improves
Home affordability in the Austin metro area ticked up as the percentage of homes sold that the median-income household could afford increased from 53.1 percent in the second quarter to 54.5 percent in the third (Chart 6). At the national level, affordability decreased from 57.1 percent to 56.4 percent over the same period but remains slightly higher than in Austin. As of November, the median home price in Austin was $308,153, above the state and national figures.
NOTE: Data may not match previously published numbers due to revisions.
About Austin Economic Indicators
Questions can be addressed to Chris Slijk at christopher.slijk@dal.frb.org. Austin Economic Indicators is released on the first Thursday of every month.