Austin Economic Indicators

October 4, 2019
The Austin economy posted a strong performance in August. The Austin Business-Cycle Index expanded at a solid pace, and most job sectors experienced payroll gains, although health and private education services continued to decline. Hourly wages climbed in August. Housing construction permits continued to increase, and home sales grew.
Business-Cycle Index
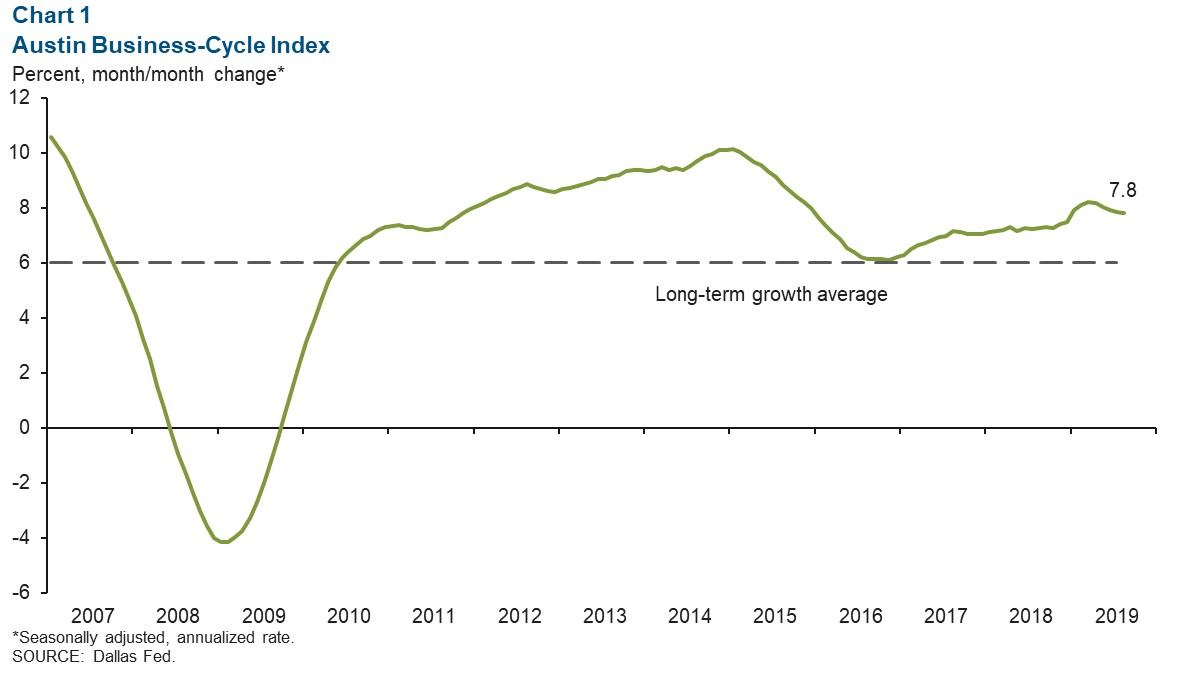
The Austin Business-Cycle Index expanded at a 7.8 percent annualized rate from July to August (Chart 1). Strength in the index so far this year can be attributed to lower unemployment rates and stronger job growth, indicating robust expansion in the metro’s economy.
Labor Market
Tight Labor Market Persists
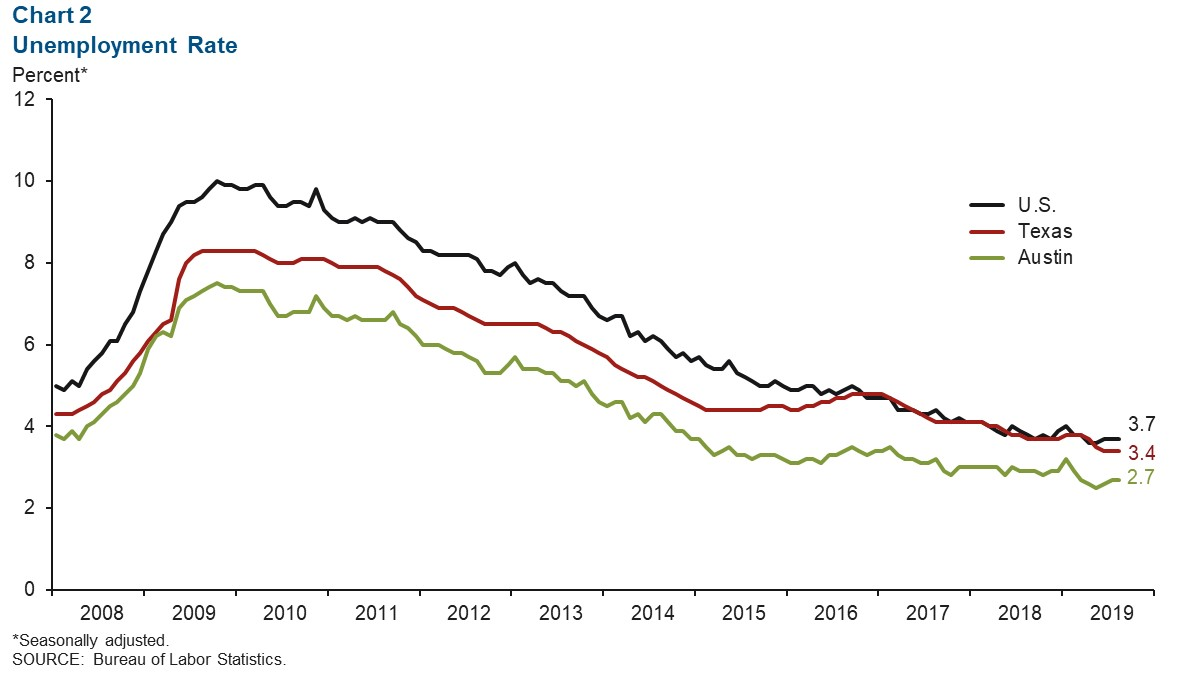
Austin’s unemployment rate remained at 2.7 percent in August, and unemployment rates for the U.S. (3.7 percent) and Texas (3.4 percent) were unchanged from the prior two months (Chart 2). This year through August, the metro’s labor force grew an annualized 1.4 percent, far behind the 3.6 percent and 2.7 percent expansion in 2017 and 2018, respectively.
Most Industries Add Jobs
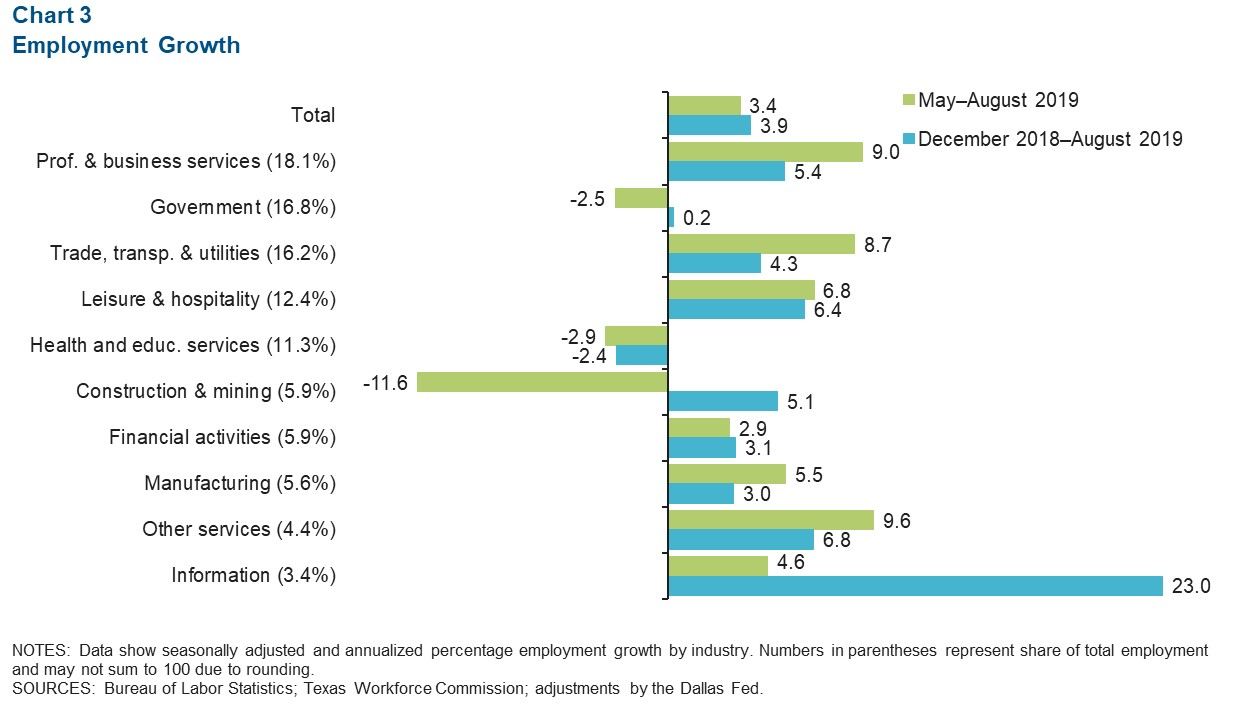
Jobs were added at a 3.4 percent annualized rate in Austin during the three months ending in August (Chart 3). Growth was generally positive across industries. Professional and business services grew 9.0 percent, adding approximately 4,300 net jobs. Trade, transportation and utilities (8.7 percent; 3,800 net jobs) and leisure and hospitality (6.8 percent; 2,250 net jobs) also expanded at a healthy pace. Payrolls within government (-2.5 percent; -1,125 jobs) and construction and mining (-11.6 percent; -2,000 jobs) contracted in the three months through August after growing earlier in the year. Health and private education services jobs continued to decline.
Average Hourly Wages Climb
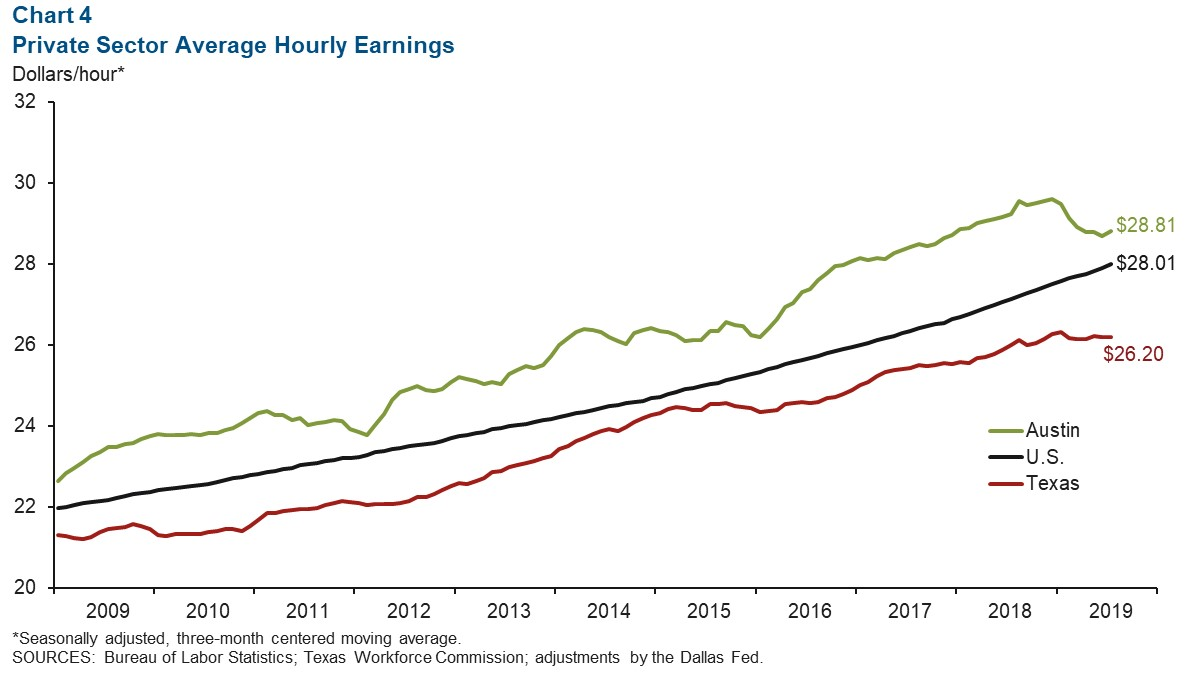
The three-month moving average of private sector hourly wages for the metro area climbed to $28.81 in August (Chart 4). Wages decreased 1.1 percent year over year in Austin, while they were relatively flat at 0.6 percent in the state and up 3.2 percent in the nation.
Real Estate
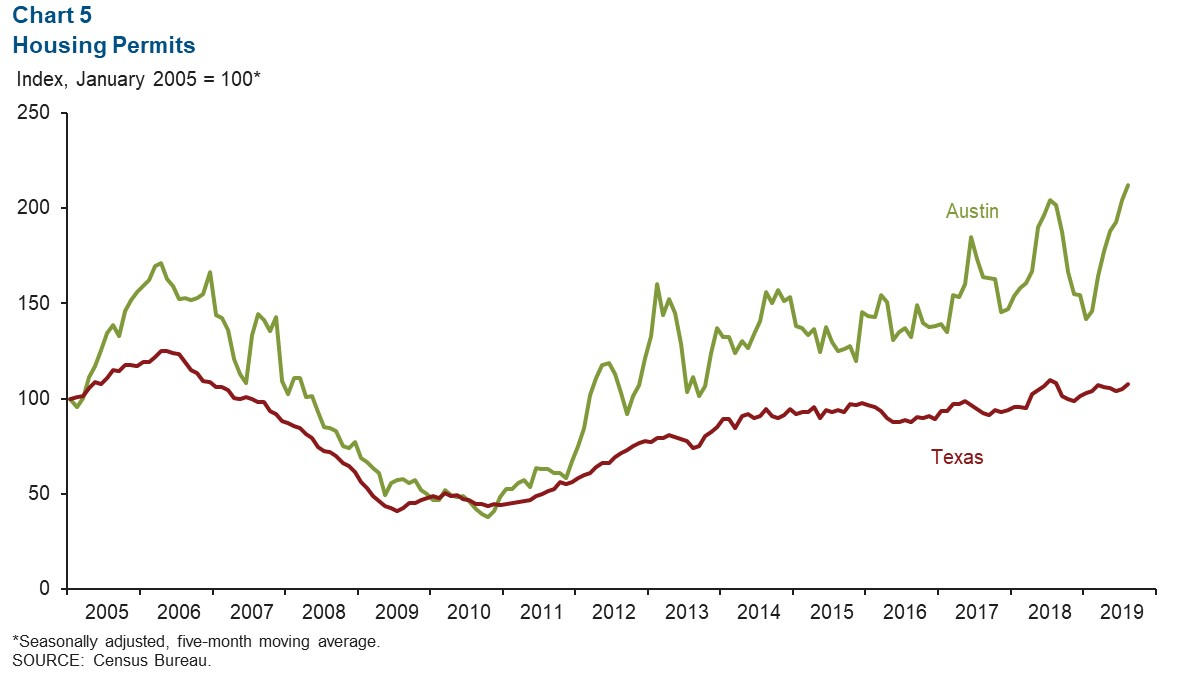
Home Construction Permits on the Rise
The five-month moving average for total housing construction permits (single family and multifamily) swelled 3.9 percent from July to August in Austin, compared with an increase of 2.9 percent in Texas (Chart 5). From December 2018 to August 2019, permits surged 37.3 percent in the metro, indicating further strength in residential building activity. The growth is significantly stronger than at the state level, where total home construction permits increased 6.5 percent during the same period.
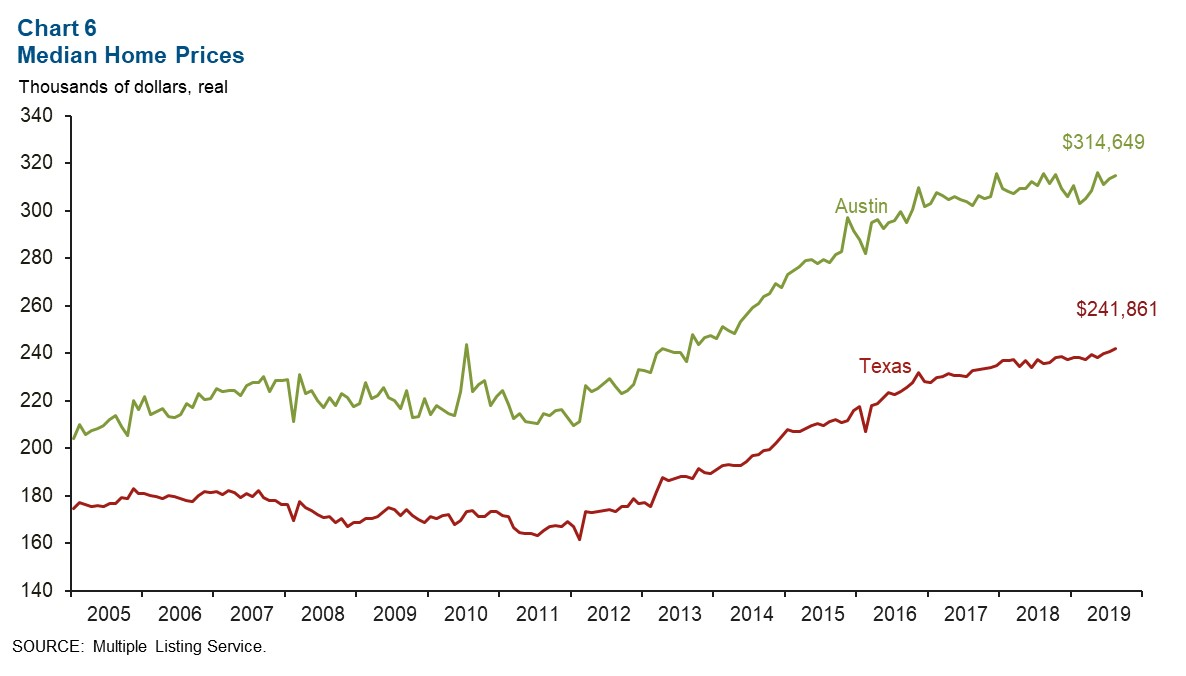
Metro Home Sales Activity Healthy
The median-home price in Austin ticked up to $314,649 in August, but prices were down 0.4 percent year over year (Chart 6). At the state level, the median-home price increased to $241,861 in August and was up 2.7 percent relative to a year prior. Existing-home sales in the metro increased a steady 2.0 percent from July to August and sales volumes were 7.2 percent higher than the monthly average in 2018. Sales in the state also grew at 2.0 percent in August and were 6.6 percent higher than the monthly average last year. Inventory in Austin edged down to 2.3 months in August, far below the six months considered a balanced market.
NOTE: Data may not match previously published numbers due to revisions.
About Austin Economic Indicators
Questions can be addressed to Judy Teng at judy.teng@dal.frb.org. Austin Economic Indicators is released on the first Thursday of every month.