Austin Economic Indicators

March 20, 2020
Note: Most of the data included in this release precede the coronavirus (COVID-19) outbreak in the U.S.
The Austin economy expanded at a healthy pace in January, with the Austin Business-Cycle Index increasing well above trend. The unemployment rate remained below the state and national averages, and recent job growth was steady. Housing affordability increased, while recent home sales activity weakened. Total housing permits in the metro continued to increase. Overall, data suggest the economy was strong in the months before the impact of the coronavirus.
Business-Cycle Index
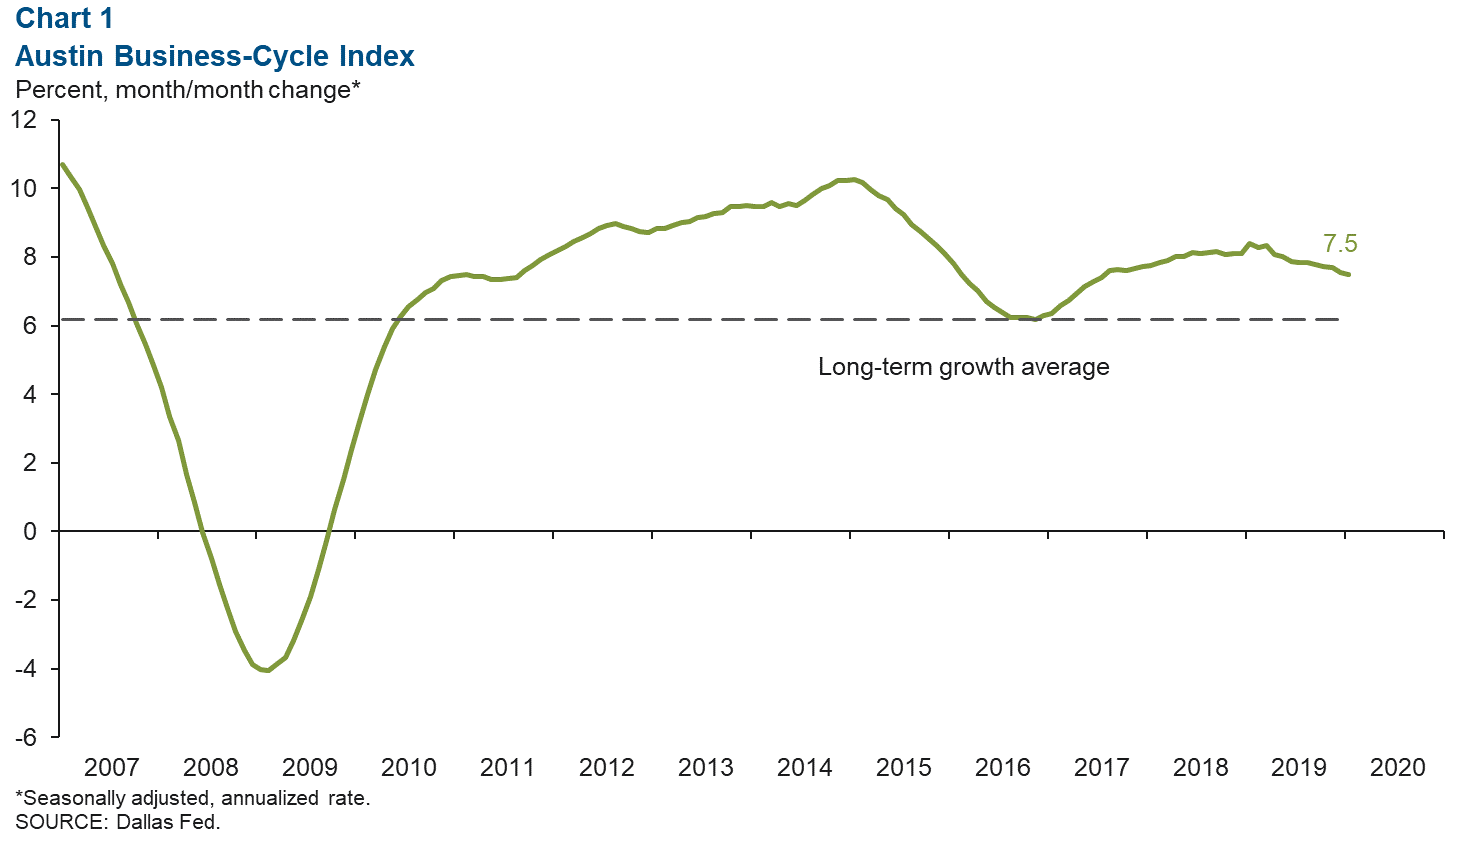
The Austin Business-Cycle Index grew 7.5 percent in January, well above its long-term average of 6.2 percent (Chart 1). Recent strength in the index is due to steady job growth, suggesting healthy economic performance in the metro.
Labor Market
Unemployment Rate Ticks Up
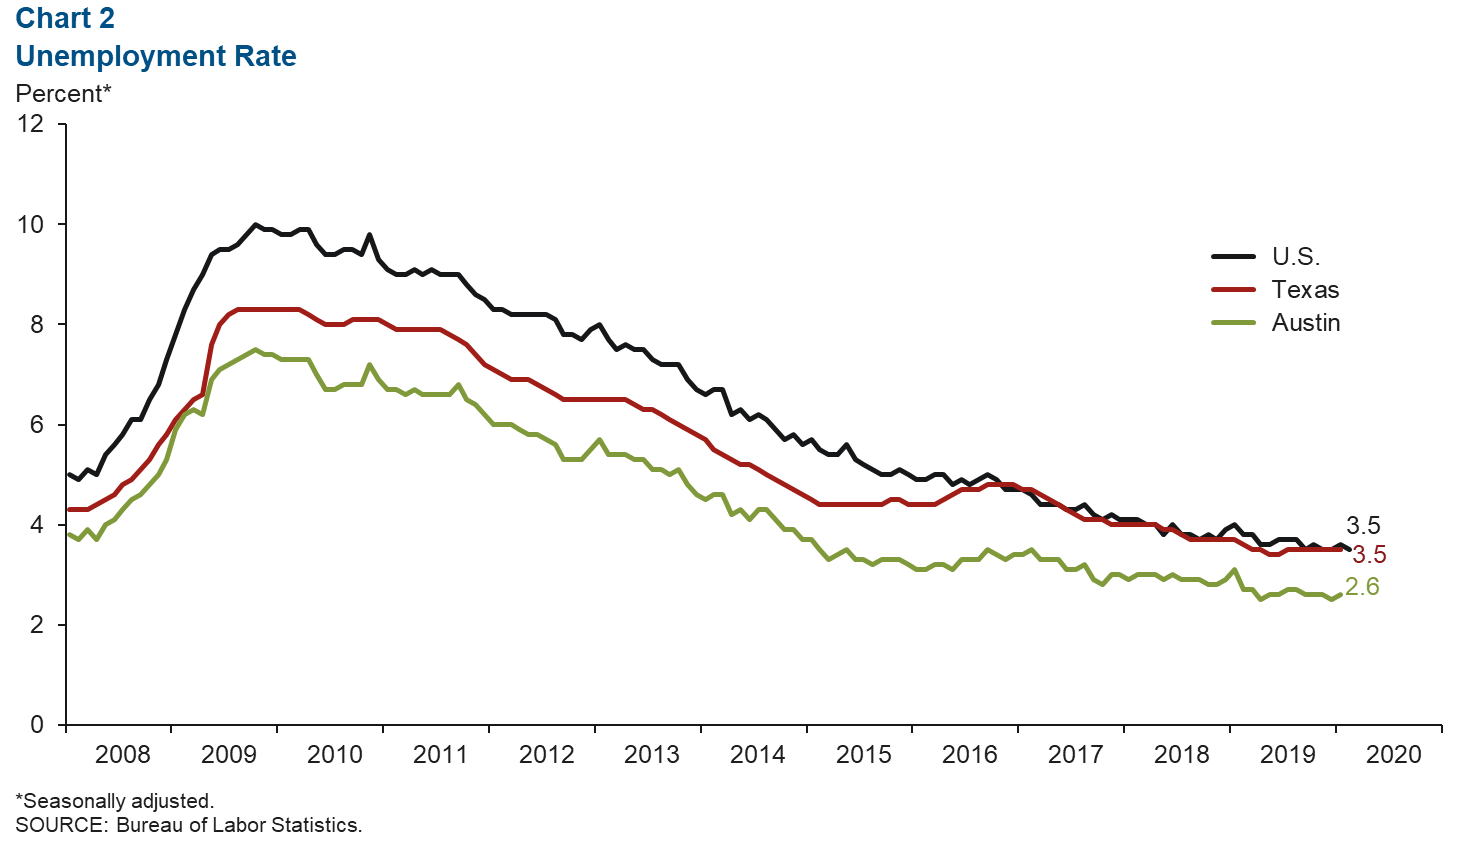
Austin’s unemployment rate rose to 2.6 percent in January, while the state’s rate lingered at 3.5 percent for the seventh consecutive month (Chart 2). In February, the jobless rate for the nation fell to 3.5 percent from 3.6 percent in January. The labor force grew 3.1 percent in 2019, a slowdown compared with 2018 (3.8 percent) and 2017 (3.5 percent).
Job Growth Strong in 2019
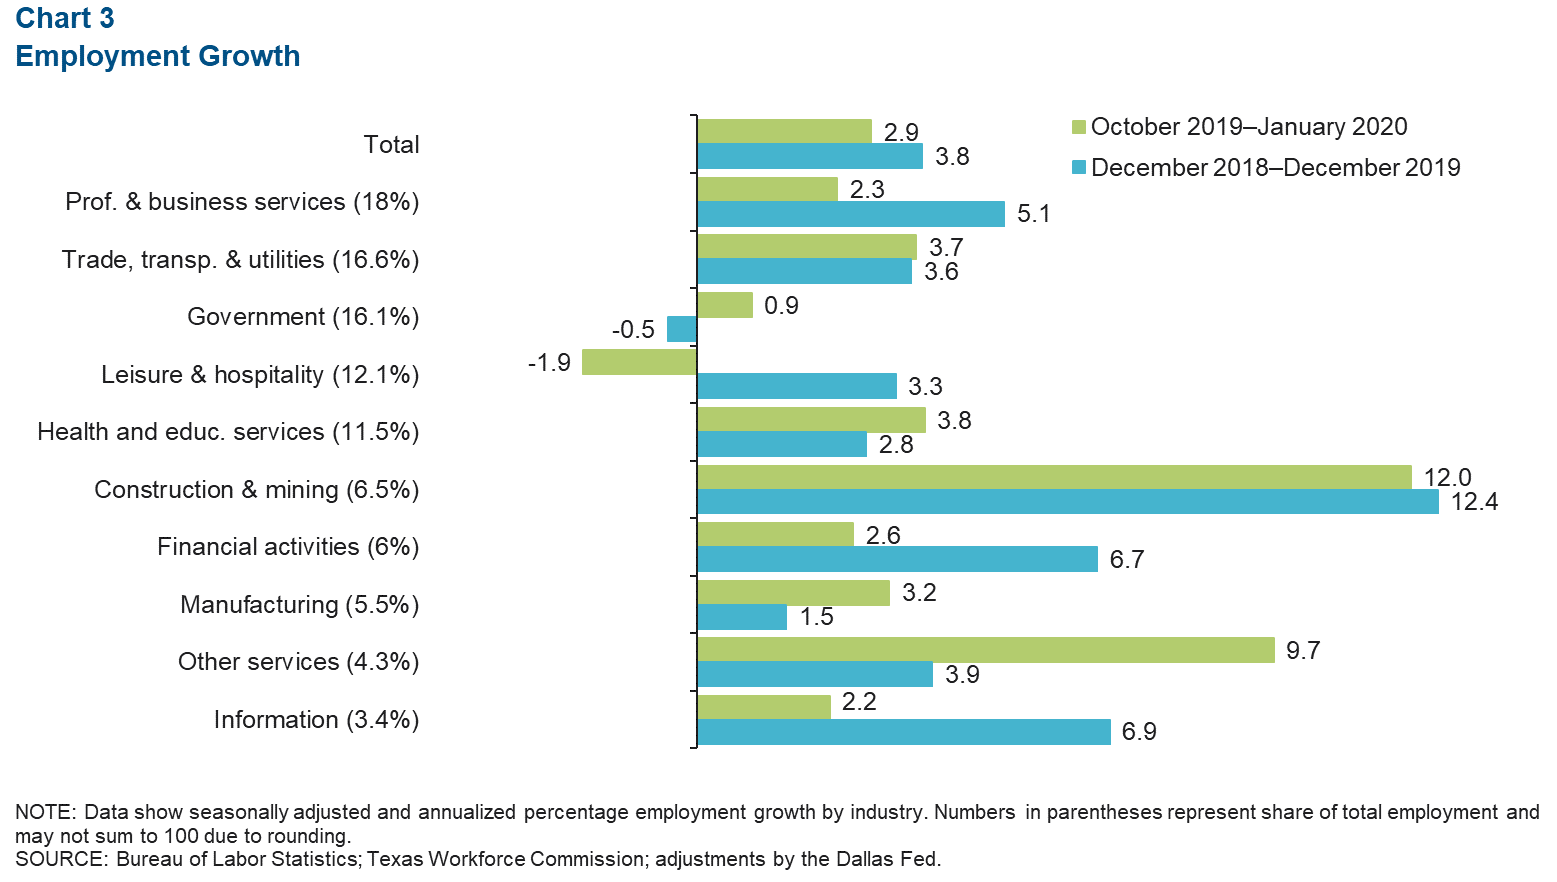
Austin payrolls grew at a steady rate of 2.9 percent annualized, or a net 8,150 jobs, in the three months ending in January and at a strong 3.8 percent in 2019 (Chart 3). Recent industry growth was led by the construction and mining sector, which added 2,000 jobs (12.0 percent). Other industries that experienced healthy gains were trade, transportation and utilities (3.7 percent, or 1,700 jobs), health and educational services (3.8 percent, or 1,220 jobs), other services (9.7 percent, or 1,120 jobs) and manufacturing (3.2 percent, or 500 jobs). Leisure and hospitality shed jobs (-1.9 percent, or -670 jobs). The annual benchmark saw an upward revision in job expansion for 2019 from 3.5 to 3.8 percent, where growth was mostly positive across all broad industry groups.
Real Estate
Housing Affordability Rises
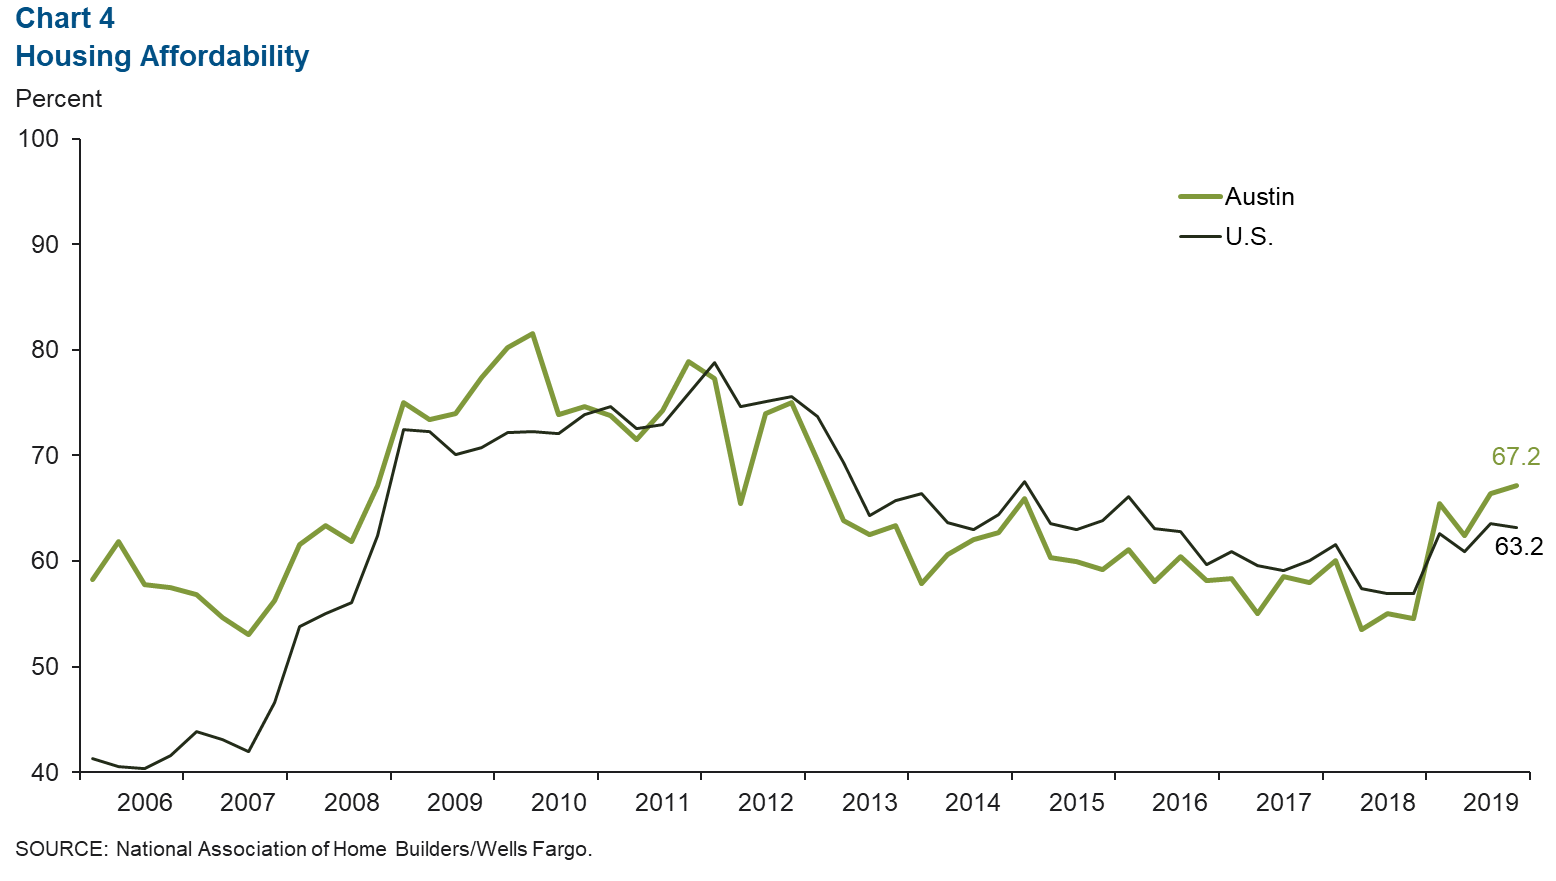
Austin housing affordability, defined as the percentage of homes sold that the median-income household can afford, increased from 66.4 percent in third quarter 2019 to 67.2 percent in the fourth quarter (Chart 4). The nation’s affordability ticked down slightly to 63.2 percent. Generally, housing affordability in Texas major metros has climbed since second quarter 2018, due in part to the decline in mortgage rates.
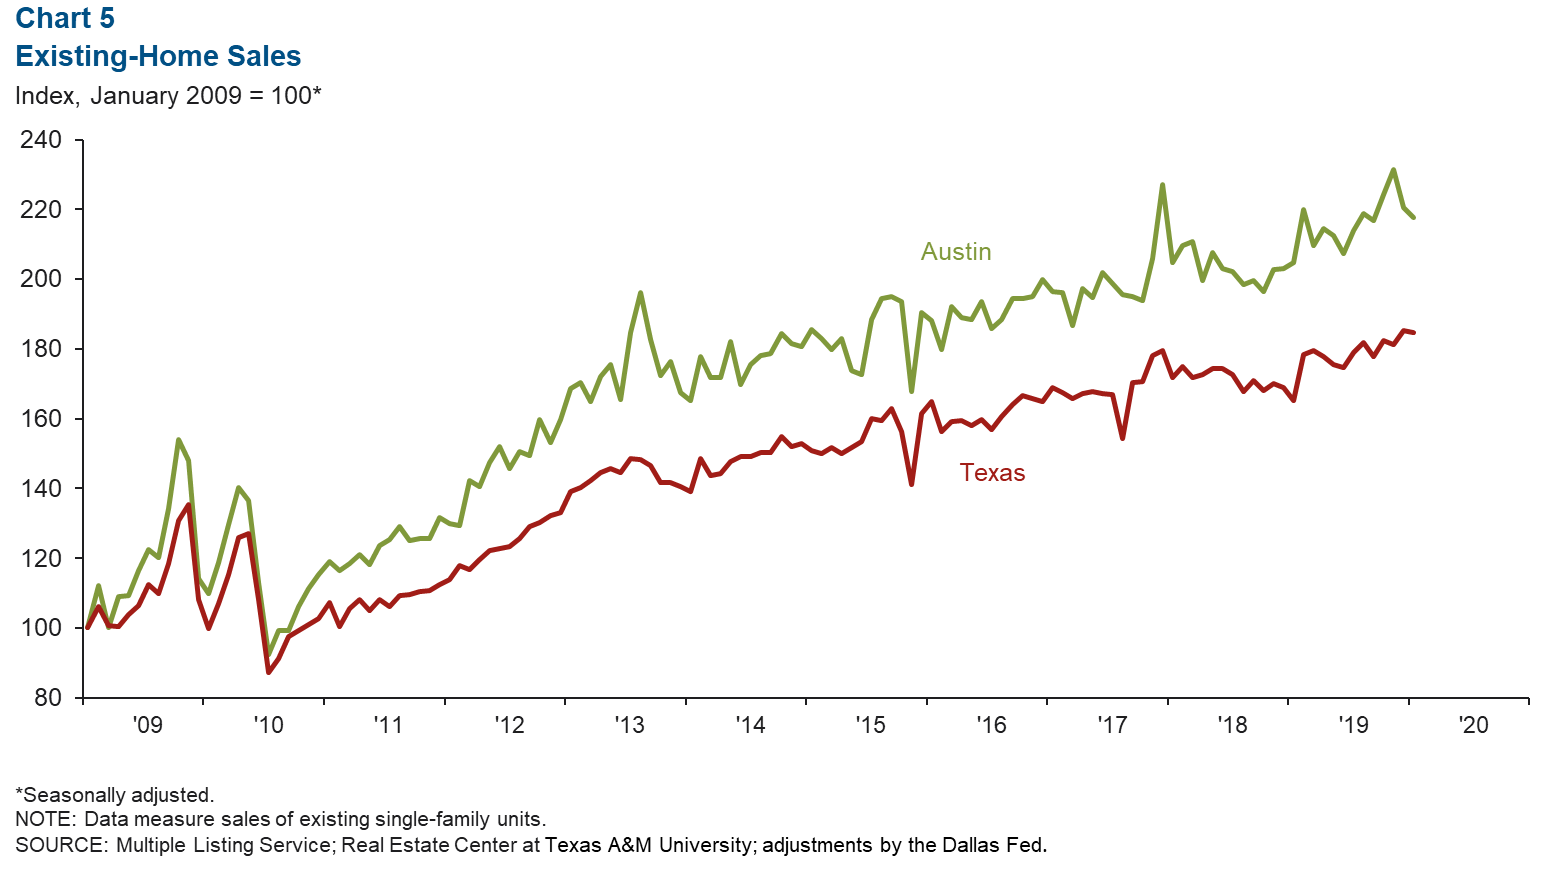
2019 Existing-Home Sales Activity Strong
Existing-home sales fell 1.2 percent in Austin in January and 0.4 percent in Texas (Chart 5). However, Austin home sales increased 6.4 percent in 2019, compared with 2018—well above Texas’ growth of 3.9 percent. Austin homes inventory fell to two months in January, the lowest since March 2014, and significantly below the six months considered to be a balanced market.
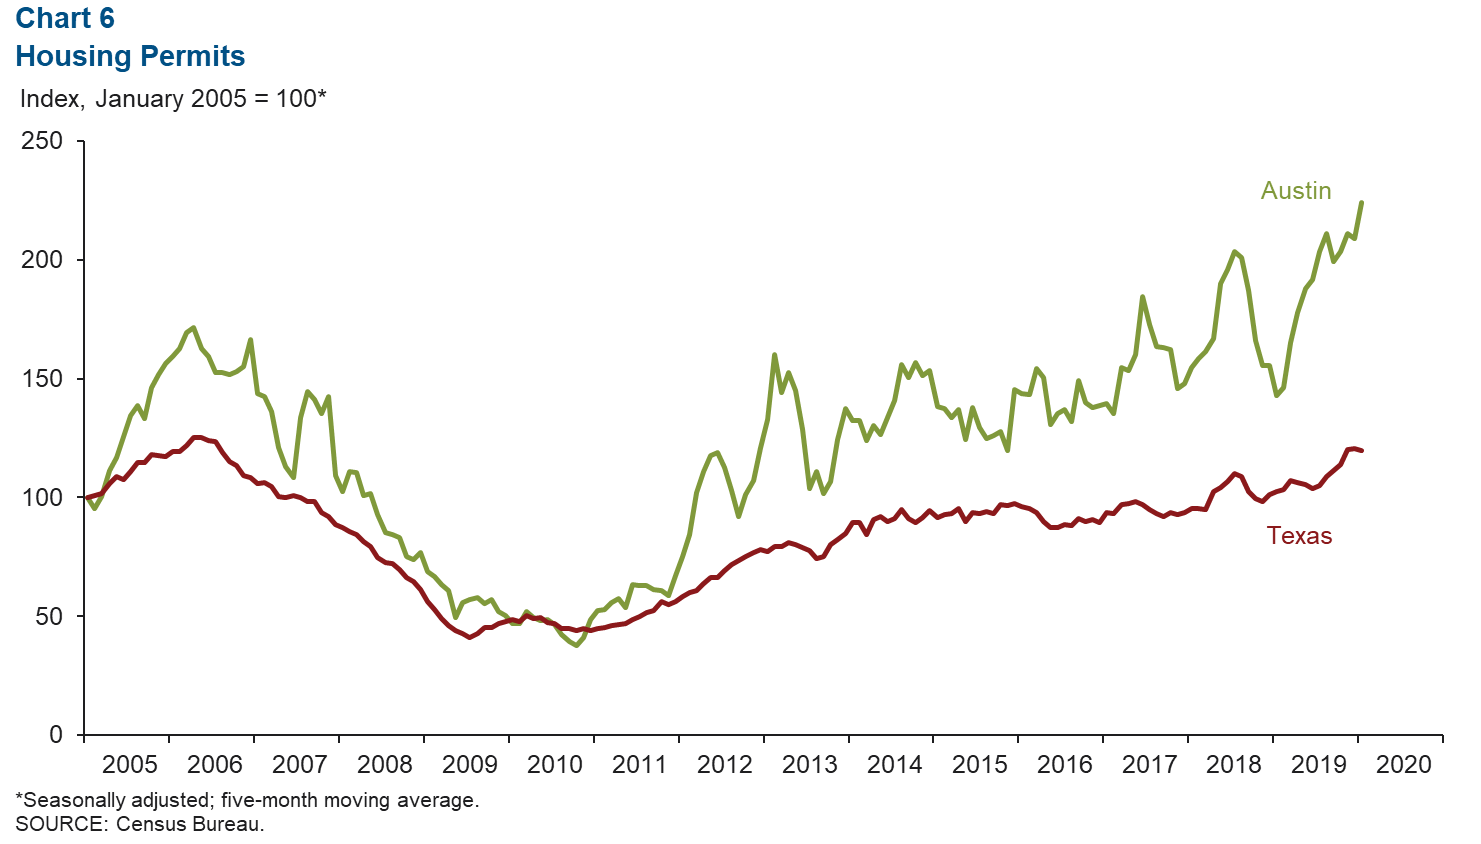
Home Construction Permits Continue to Climb
The five-month moving average for aggregate single-family and multifamily construction permits in Austin increased 7.2 percent in January and was unchanged in the state (Chart 6). Total permits in Austin (five-month moving average) rose 34.6 percent in 2019, which was well above the state’s 19.0 percent growth.
NOTE: Data may not match previously published numbers due to revisions.
About Austin Economic Indicators
Questions can be addressed to Judy Teng at judy.teng@dal.frb.org. Austin Economic Indicators is released on the first Thursday of every month.