Austin Economic Indicators

April 2, 2020
Note: Most of the data included in this release precede the coronavirus (COVID-19) outbreak in the U.S.
The Austin economy expanded at a strong pace in February. The Austin Business-Cycle Index grew well above trend. The unemployment rate held steady, and employment growth was strong. Home sales price, volume and building permits all saw increases. Overall, data suggest the economy was strong in the months before the impact of the coronavirus.
Business-Cycle Index
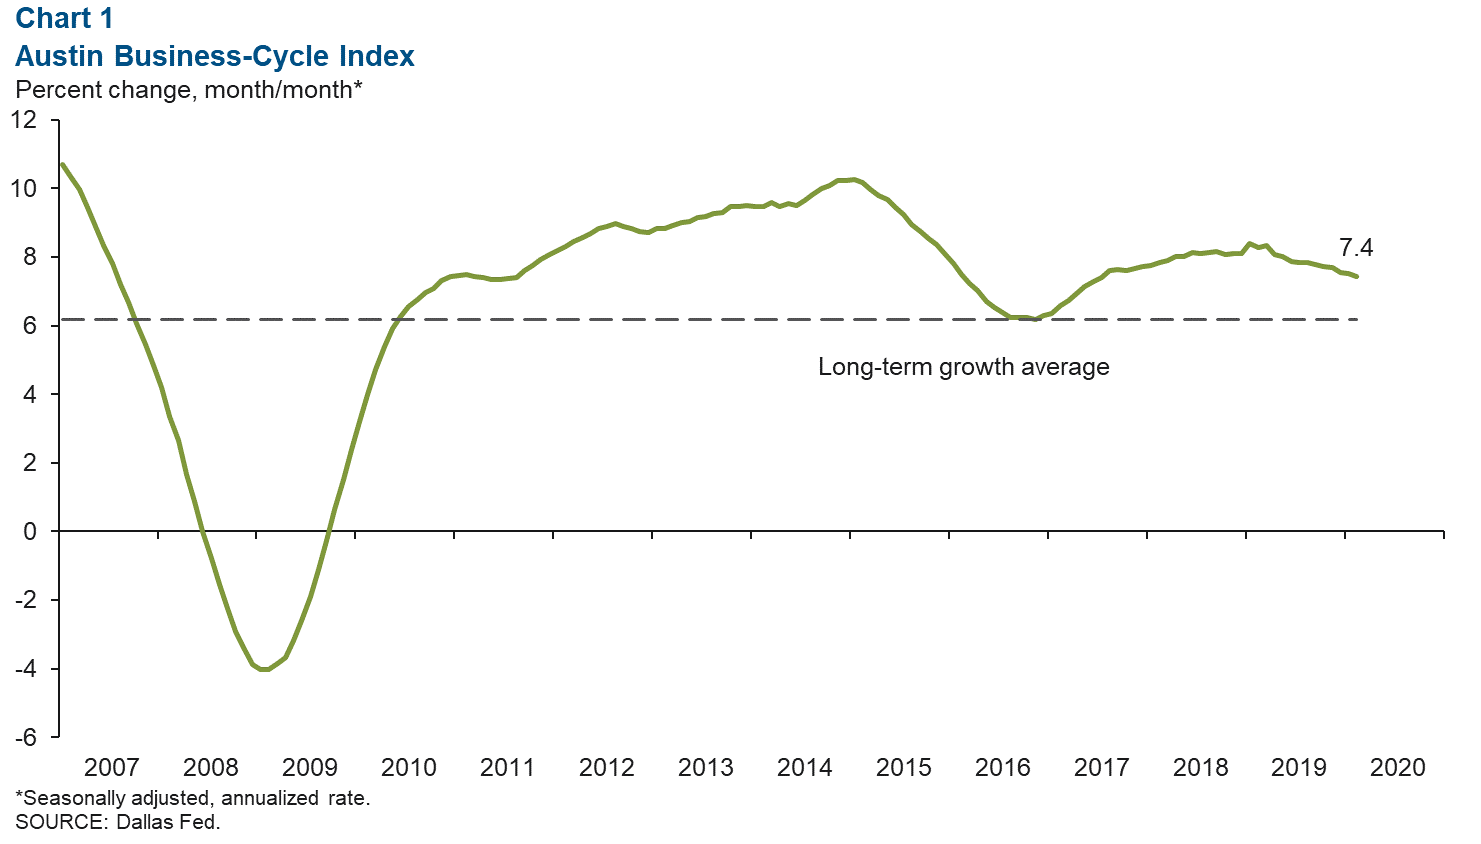
The Austin Business-Cycle Index grew 7.4 percent in February, well above its long-term average of 6.2 percent (Chart 1). The index was buoyed by strong recent job growth.
Labor Market
Unemployment Rate Holds Steady
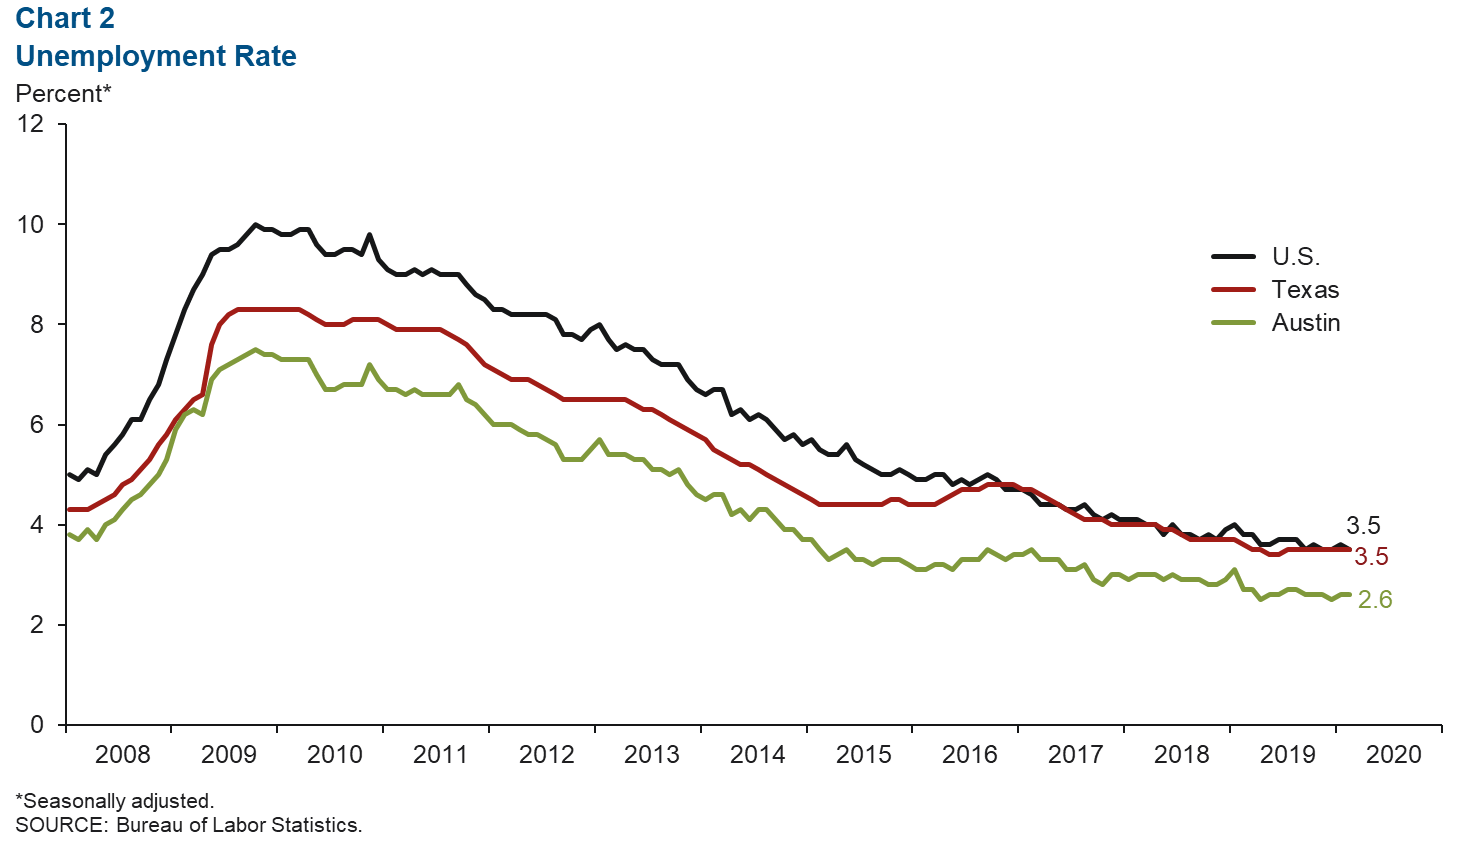
Austin’s unemployment rate remained at 2.6 percent in February for the second consecutive month, with the state rate holding at 3.5 percent for the eighth consecutive month (Chart 2). In February, the jobless rate for the nation fell to 3.5 percent from 3.6 percent in January. For the first two months of the year, Austin’s labor force grew an annualized 0.1 percent, well below growth of 3.1 percent in 2019.
Job Growth Strong in 2019
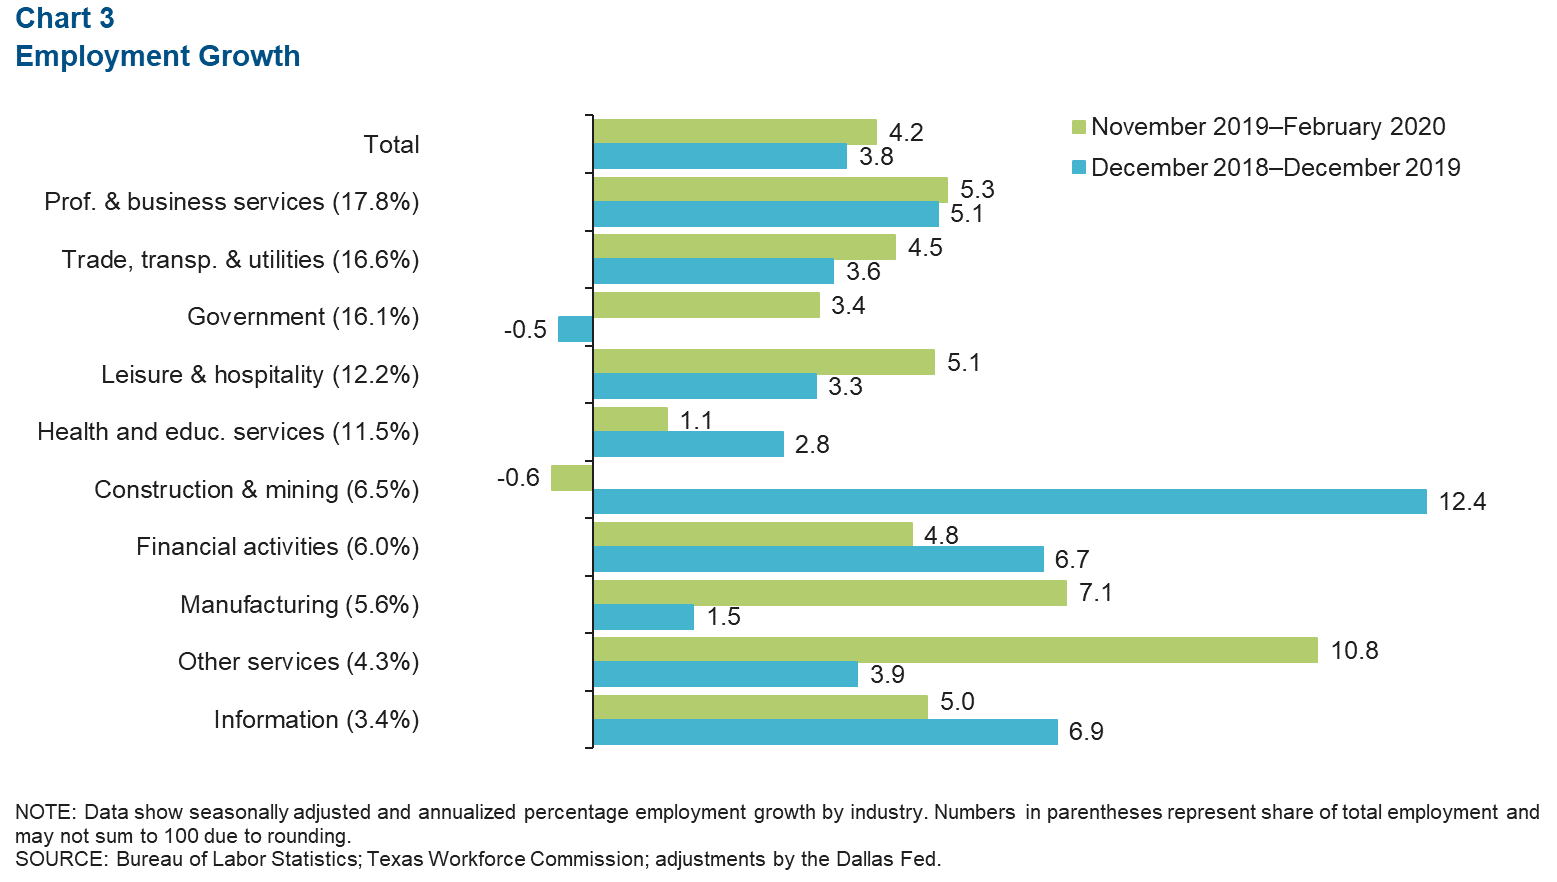
Austin added jobs at a 4.2 percent annualized rate, or a net 11,730 jobs, in the three months ending in February (Chart 3). Recent industry growth was led by the other services and manufacturing sectors, which added 1,260 net jobs (10.8 percent) and 1,080 net jobs (7.1 percent), respectively. Other services includes jobs such as automotive repair and maintenance, barber shops and funeral homes. Additional sectors that experienced strong gains were professional and business services (5.3 percent, or 2,600 jobs), leisure and hospitality (5.1 percent, or 1,720 jobs) and information (5.0 percent, or 480 jobs). Slight weakness was seen in construction and mining (-0.6 percent, or -115 jobs).
Real Estate
Metro Home Sales Prices Rise
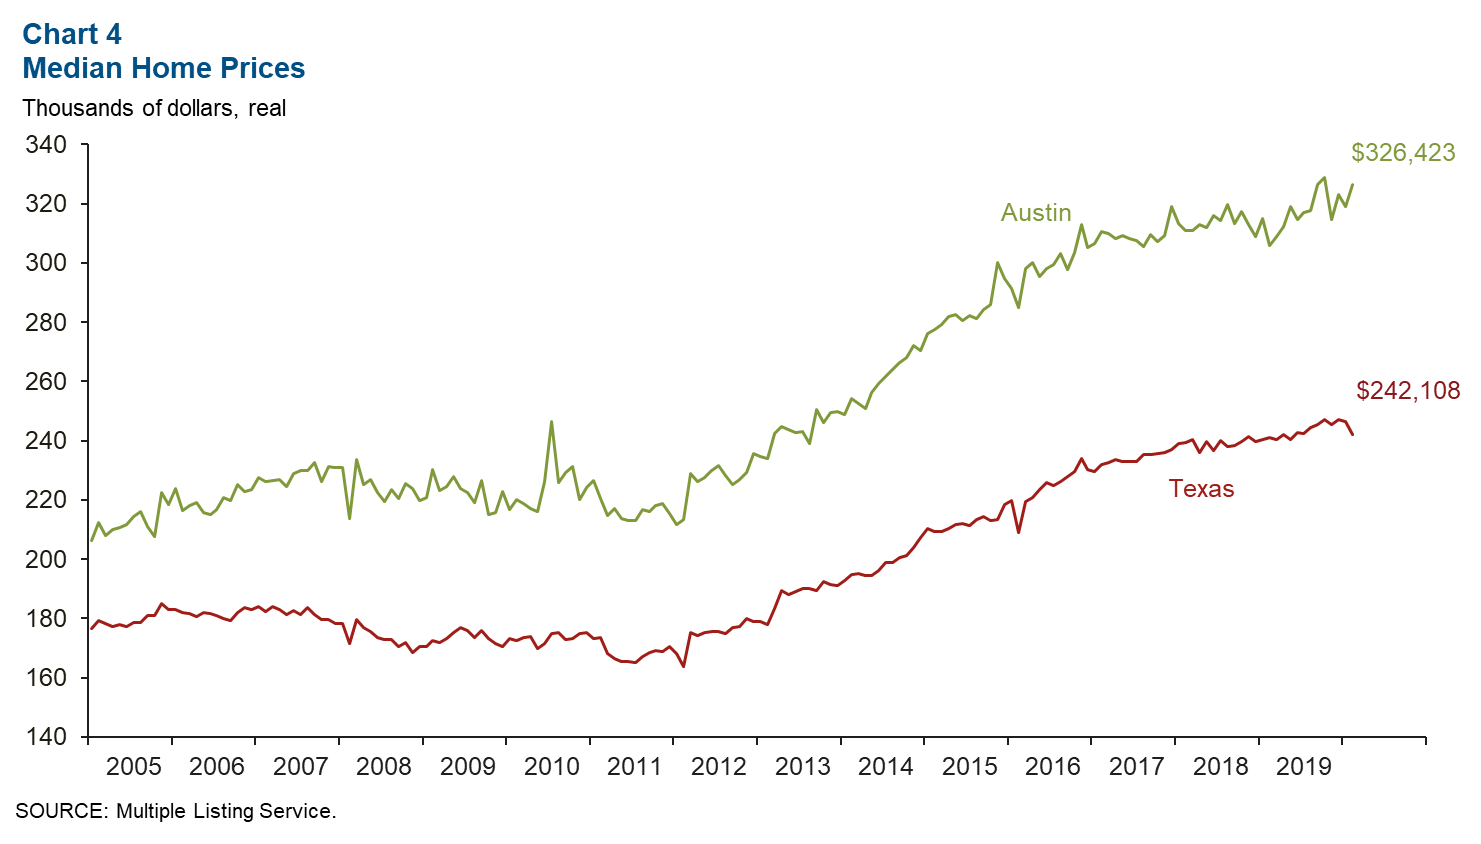
The median price of homes sold in Austin ticked up to $326,423 in February, up 6.7 percent year over year (Chart 4). The median home sales price for Texas declined to $242,108, which is unchanged compared with a year prior. Austin housing affordability, defined as the percentage of homes sold that the median-income household can afford, stood at 67.2 percent in the fourth quarter. Generally, housing affordability in Texas major metros has climbed since second quarter 2018, due in part to the decline in mortgage rates.
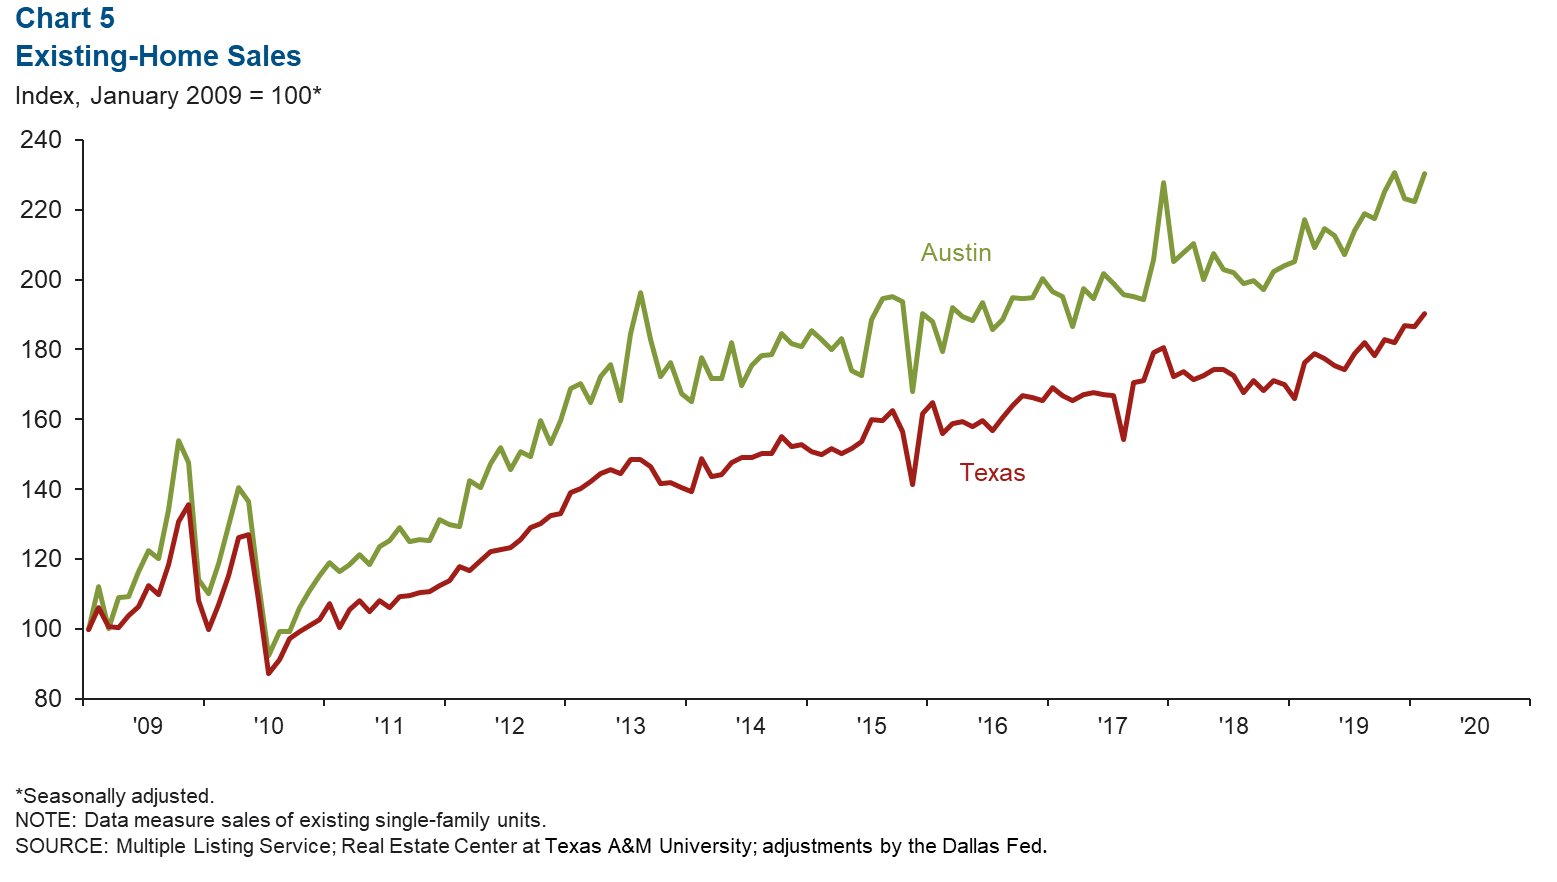
Home Sales Volume Strength Continues
Existing-home sales climbed 3.6 percent in Austin in February and 2.1 percent in Texas (Chart 5). In the first two months of the year, metro home sales are up 7.1 percent relative to the same time period in 2019, below the same metric for Texas of 10.1 percent. Austin homes inventory fell to 1.7 months in February, the lowest since February 2000, and considerably below the six months considered to be a balanced market.
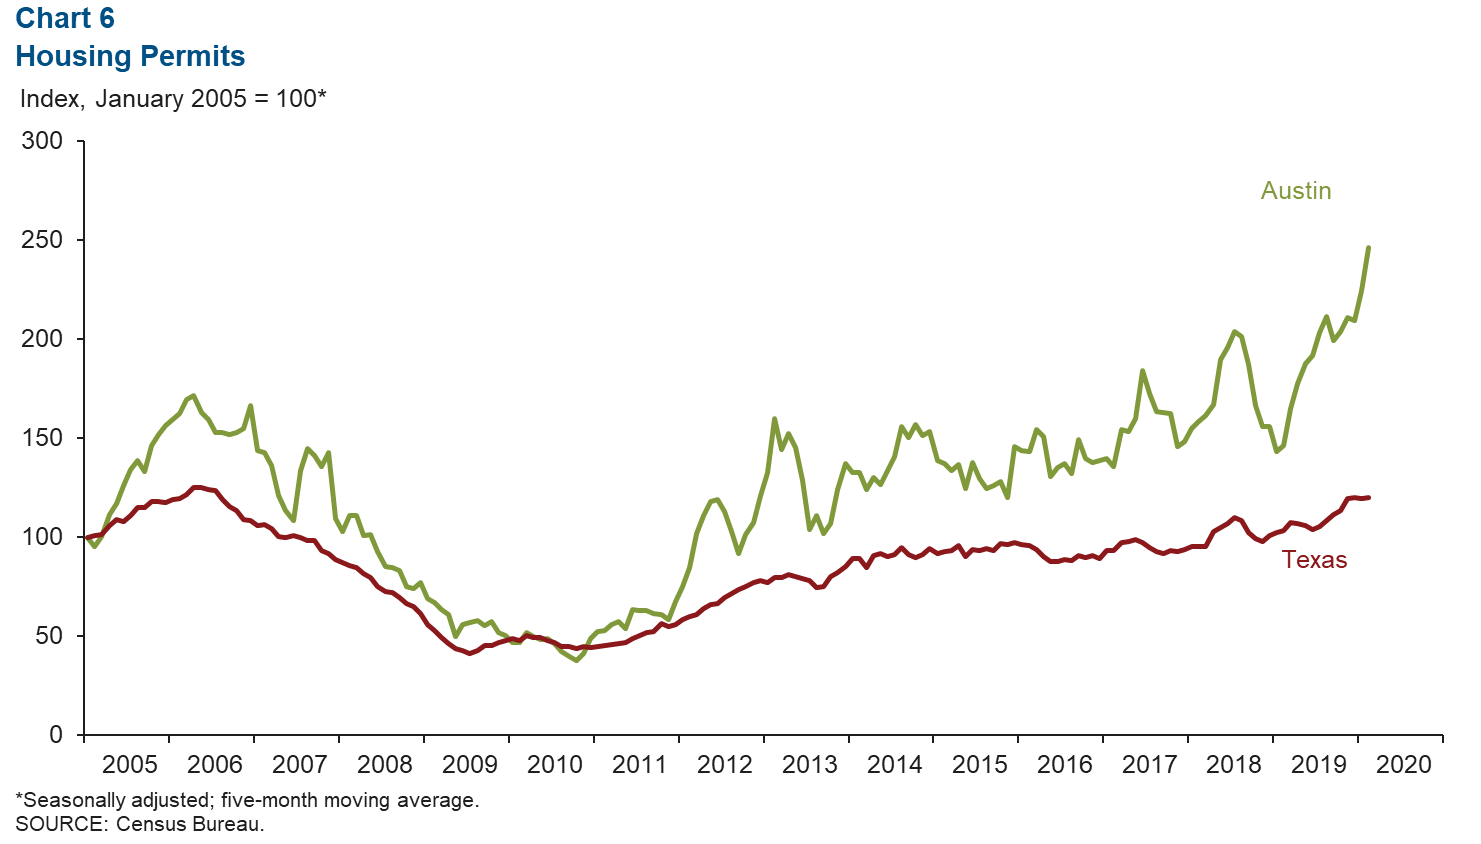
Home Construction Permits Rise
The five-month moving average for aggregate single-family and multifamily construction permits in Austin rose 9.5 percent in February and was unchanged in Texas (Chart 6). Total permits in Austin rose 9.6 percent in 2019, which was well above the state’s 6.7 percent growth.
NOTE: Data may not match previously published numbers due to revisions.
About Austin Economic Indicators
Questions can be addressed to Judy Teng at judy.teng@dal.frb.org. Austin Economic Indicators is released on the first Thursday of every month.