Austin Economic Indicators

June 5, 2020
The Austin economy continued to contract in April due to the impacts of COVID-19. The Austin Business-Cycle Index fell at a historical pace. Payrolls declined and the unemployment rate increased, though initial unemployment claims began to slow. Existing-home sales declined, while building permits rebounded.
Business-Cycle Index
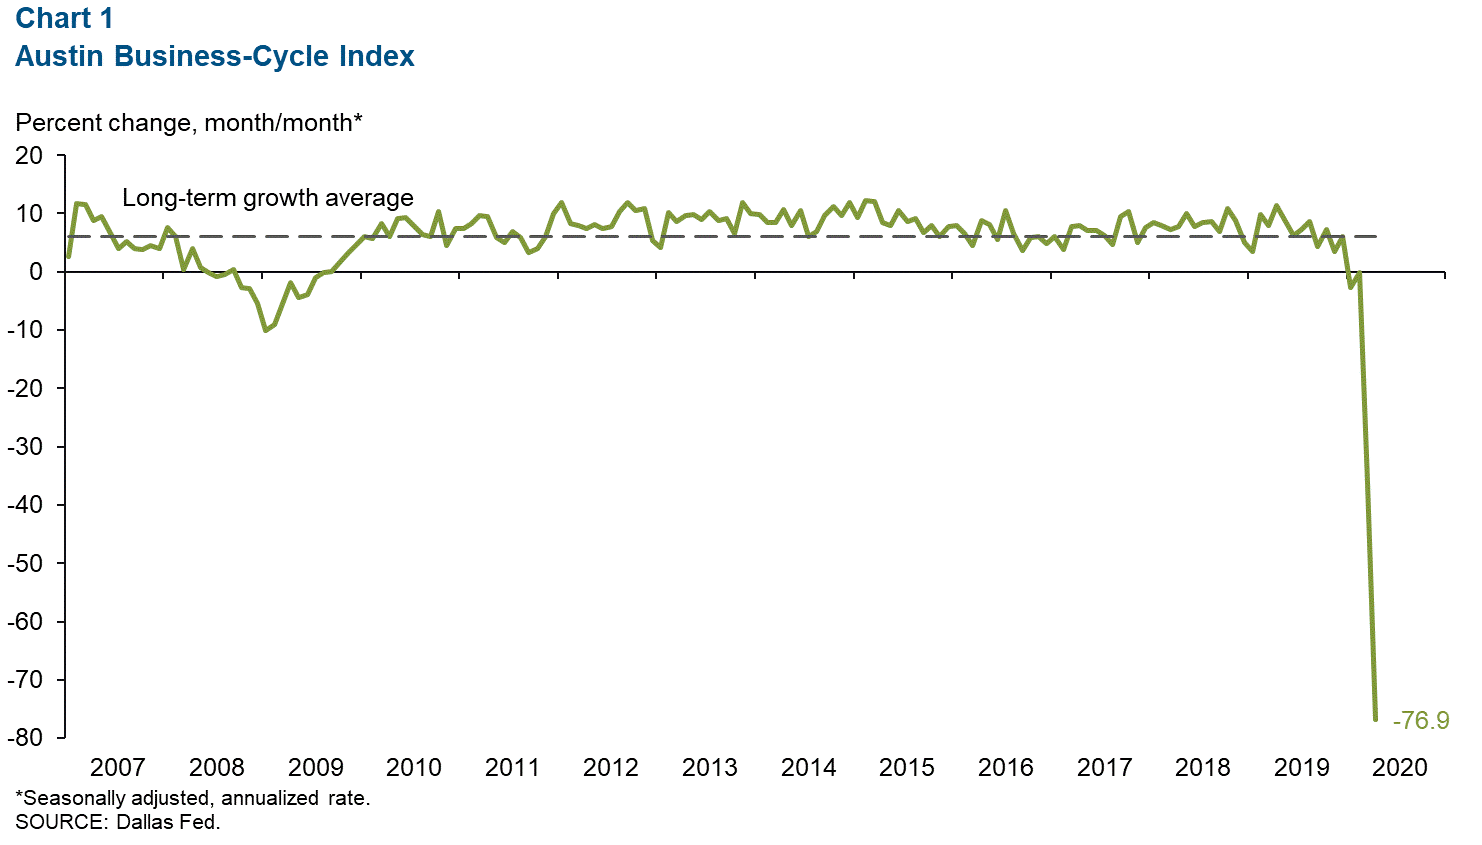
The Austin Business-Cycle Index declined 76.9 percent on an annualized basis in April, the largest contraction since the data series began in 1978 (Chart 1). The weakness was due to the recent drastic job losses and higher unemployment rate.
Labor Market
Unemployment Rate Surges
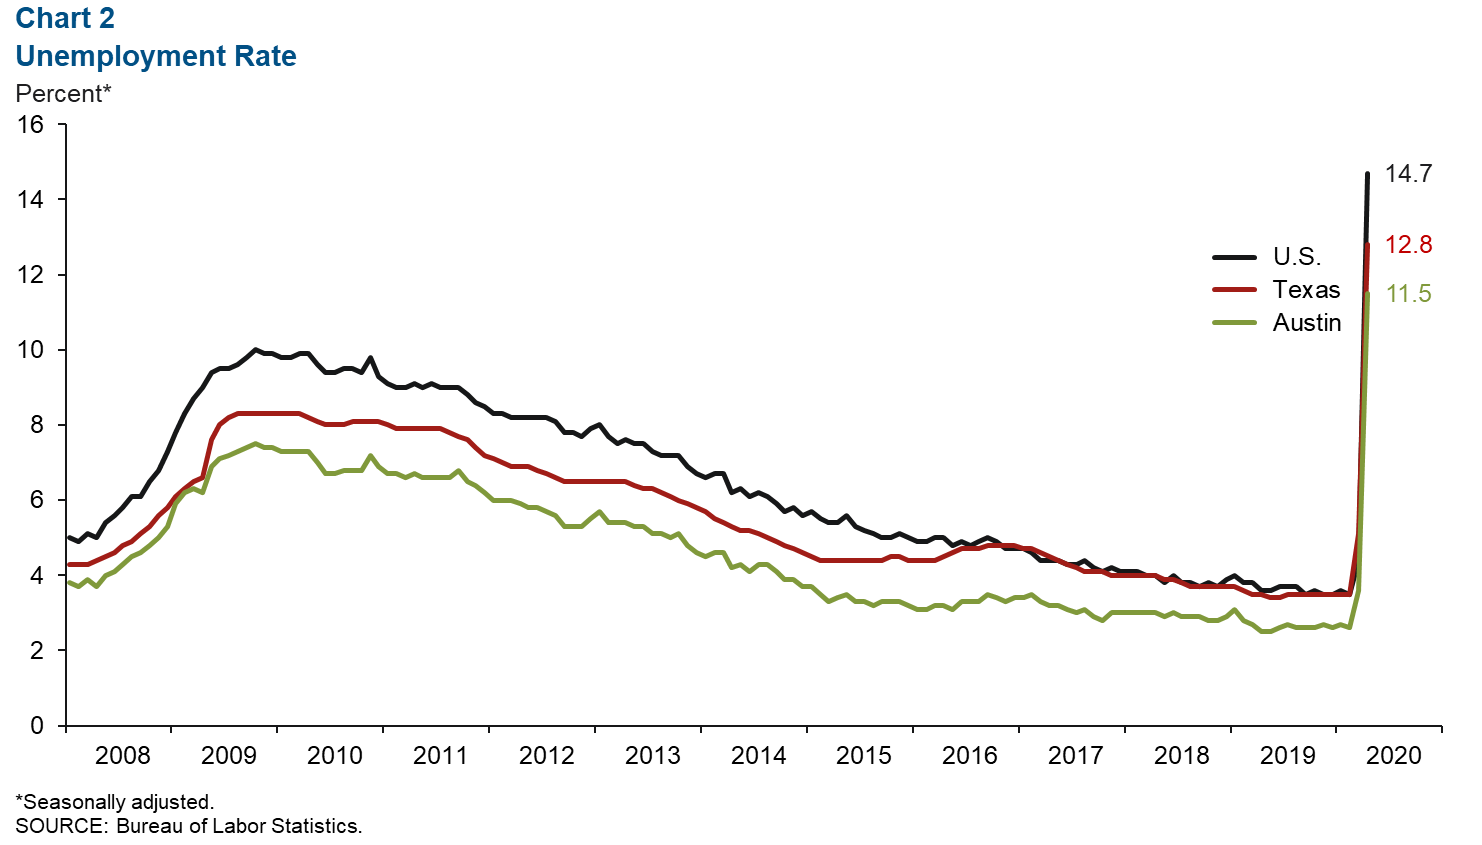
Austin’s unemployment rate climbed to 11.5 percent in April, the highest level since the data series began in 1990 (Chart 2). The unemployment rate in Texas (12.8 percent) and the U.S. (14.7 percent) also reached historical heights.
Unemployment Claims Begin to Slow
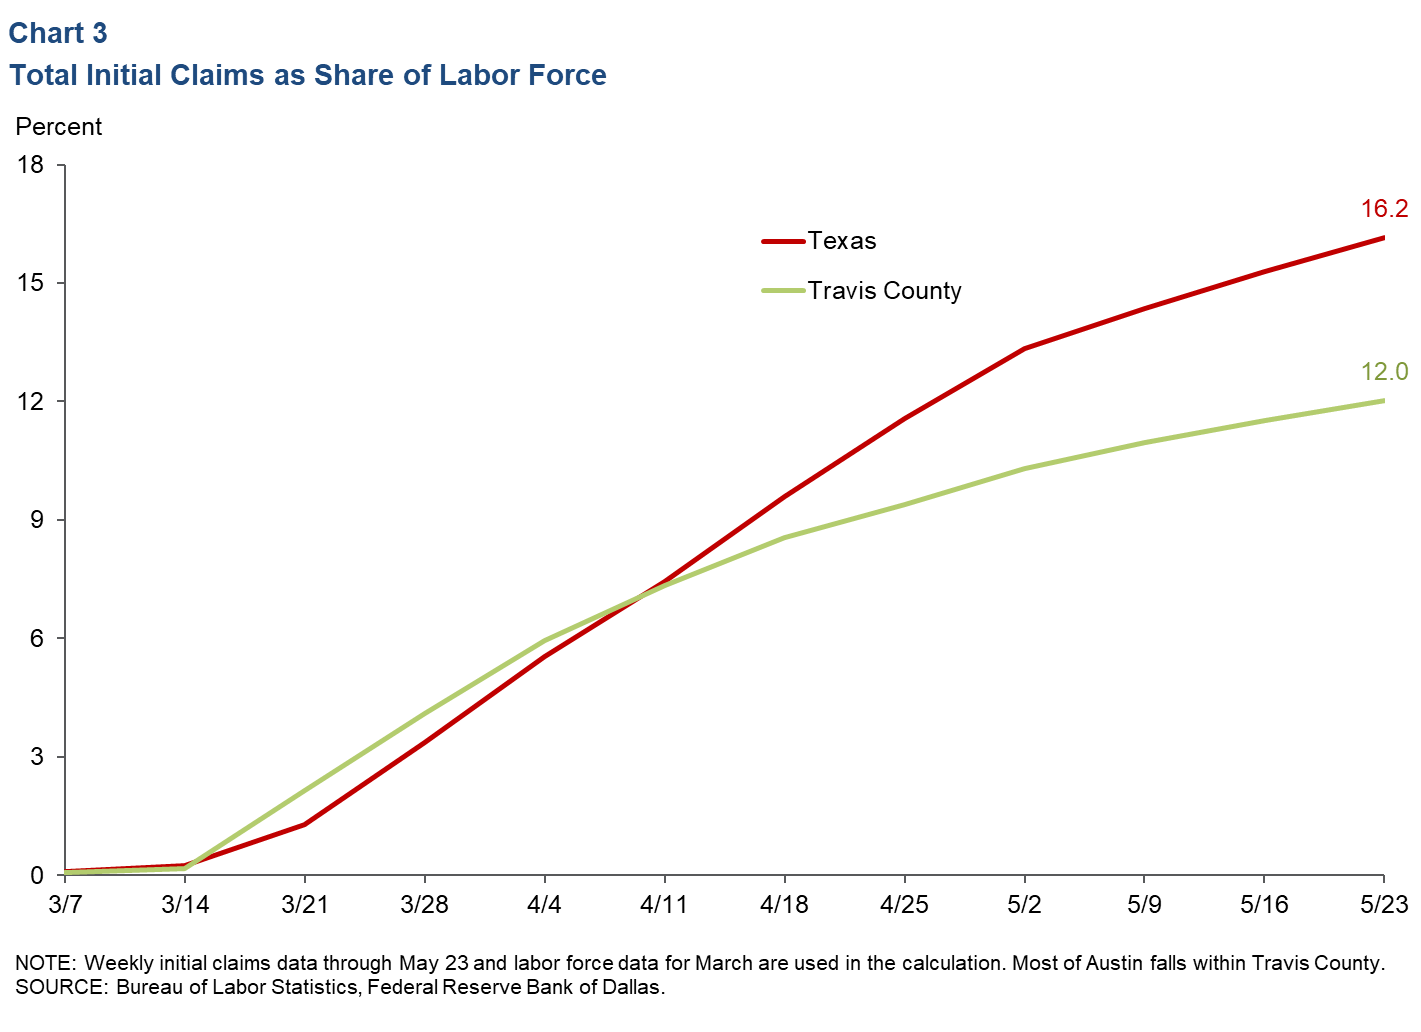
Initial claims for unemployment insurance benefits for the week ending May 23 numbered 3,794 in Travis County. This marked the third consecutive week of declines in initial claims and was the lowest number of claims filed since the week of March 14. Total initial claims filed locally from March 7 to May 23 (89,003) represented 12.0 percent of the labor force, a much lower share relative to Texas’ 16.2 percent (2.3 million) over the same period (Chart 3).
Recent Job Losses Severe
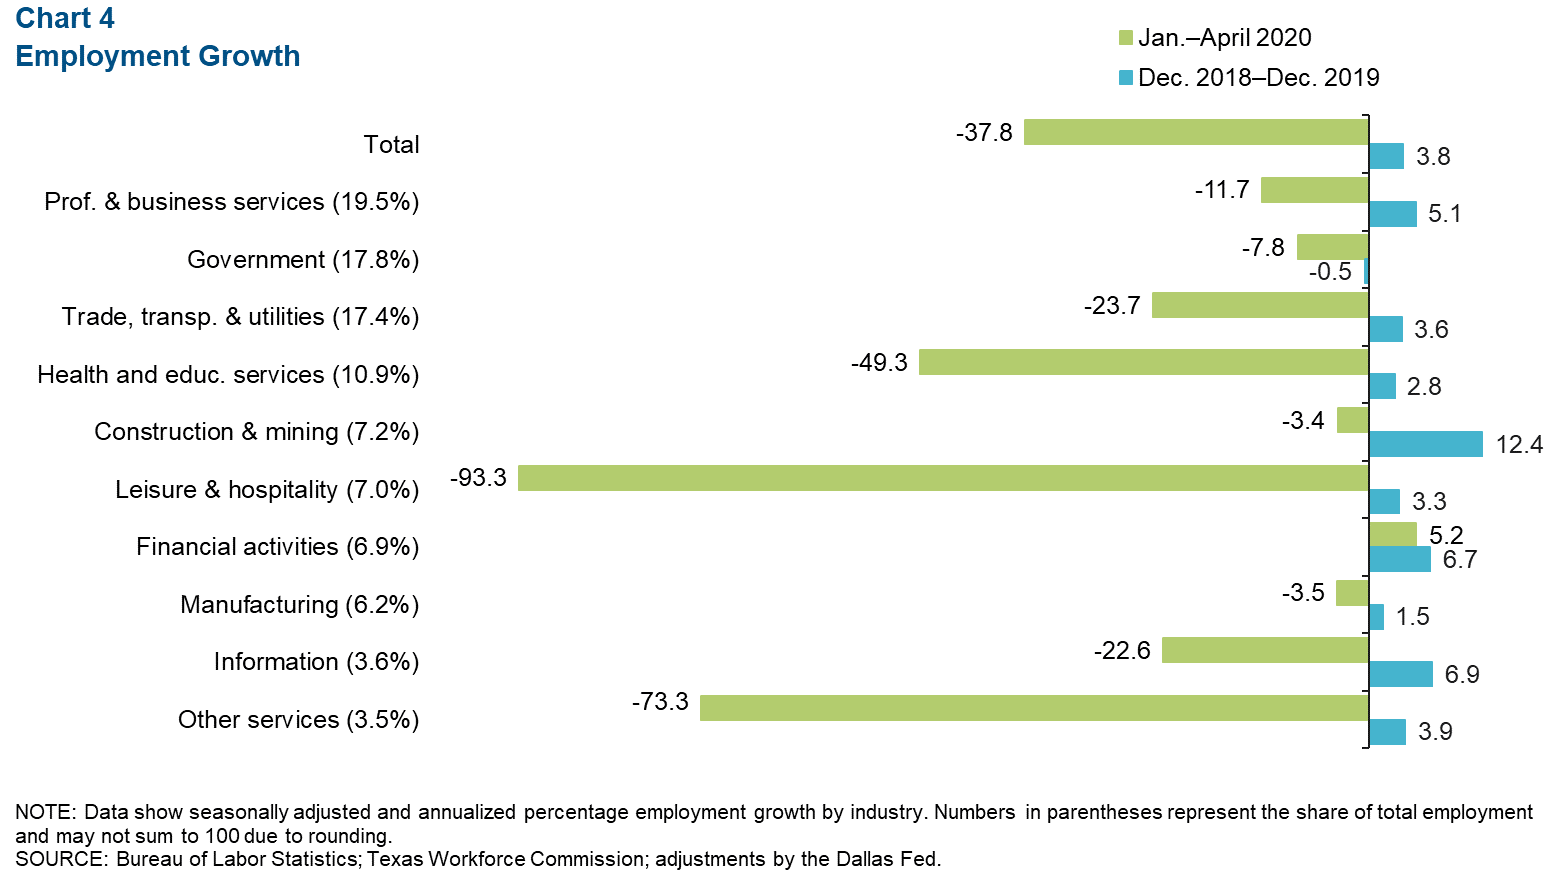
Austin jobs contracted an annualized 37.8 percent (127,230 net jobs lost, not annualized) during the three months ending in April (Chart 4). All sectors except financial activities shed jobs during this period. Leisure and hospitality saw the largest payroll declines at 93.3 percent (-68,000 jobs). It was followed by “other services” such as automotive repair and barber shops (-73.3 percent, or -13,820 jobs), health and private education services (-49.3 percent, or -20,460 jobs) and trade, transportation and utilities (-23.7 percent, or -12,310 jobs). The financial activities sector posted a 5.2 percent gain (870 jobs) during this period.
Real Estate
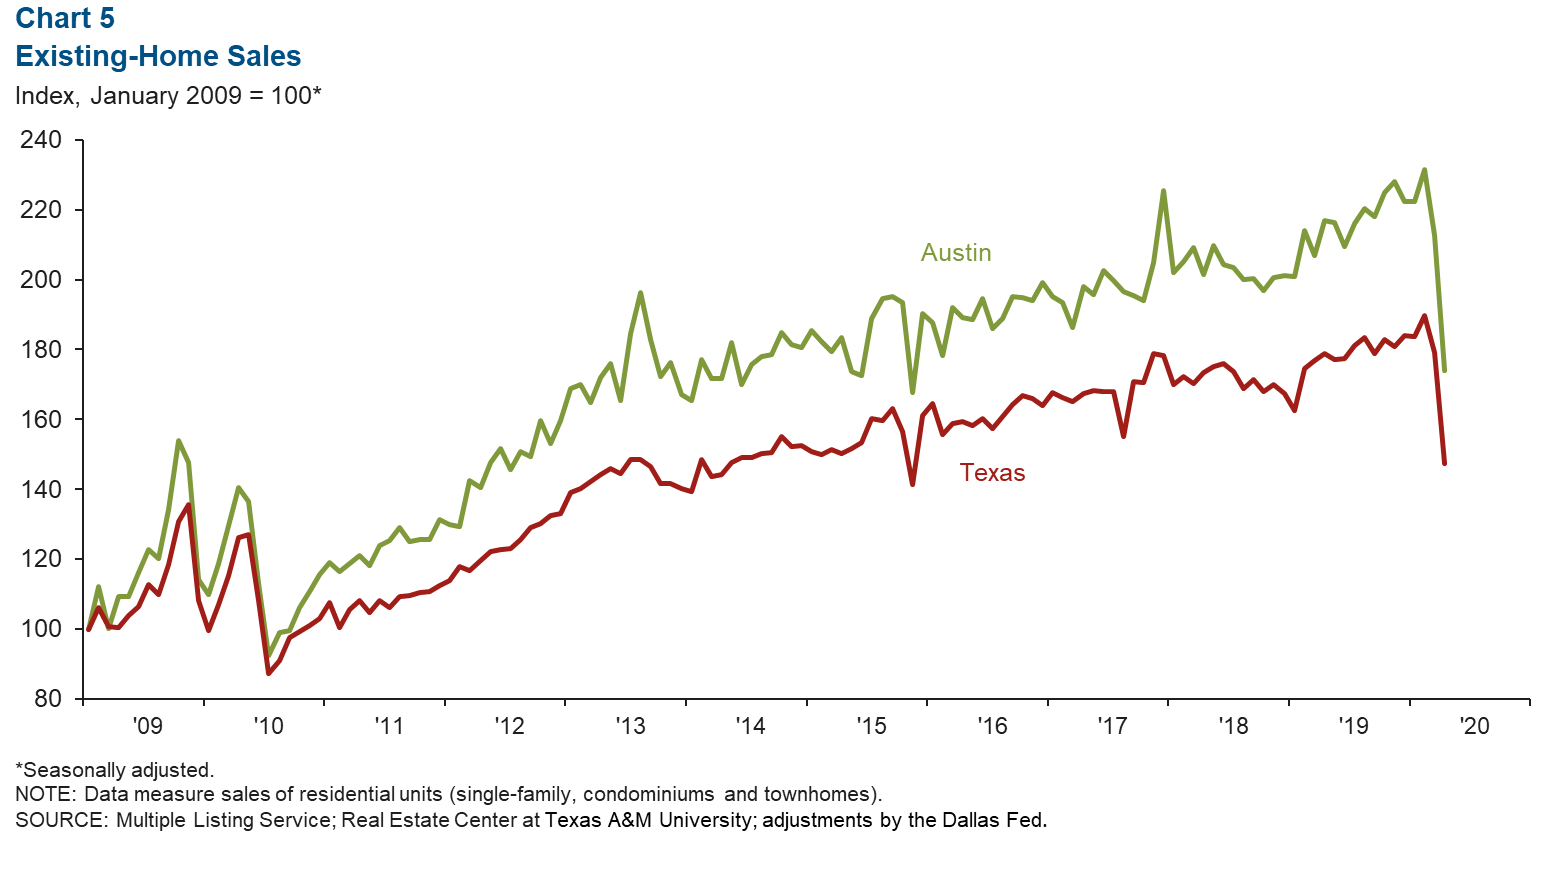
Recent Home Sales Drop
Existing-home sales decreased 18.1 percent in the Austin area and 17.7 percent in the state in April (Chart 5). Austin home sales increased 0.2 percent during the first four months of this year relative to the same period in 2019, while Texas sales were up 1.1 percent. The median price of homes sold in April was $317, 595 in Austin, a 2.5 percent increase year over year, compared with $247,199 in Texas, a 3.7 percent increase from a year ago.
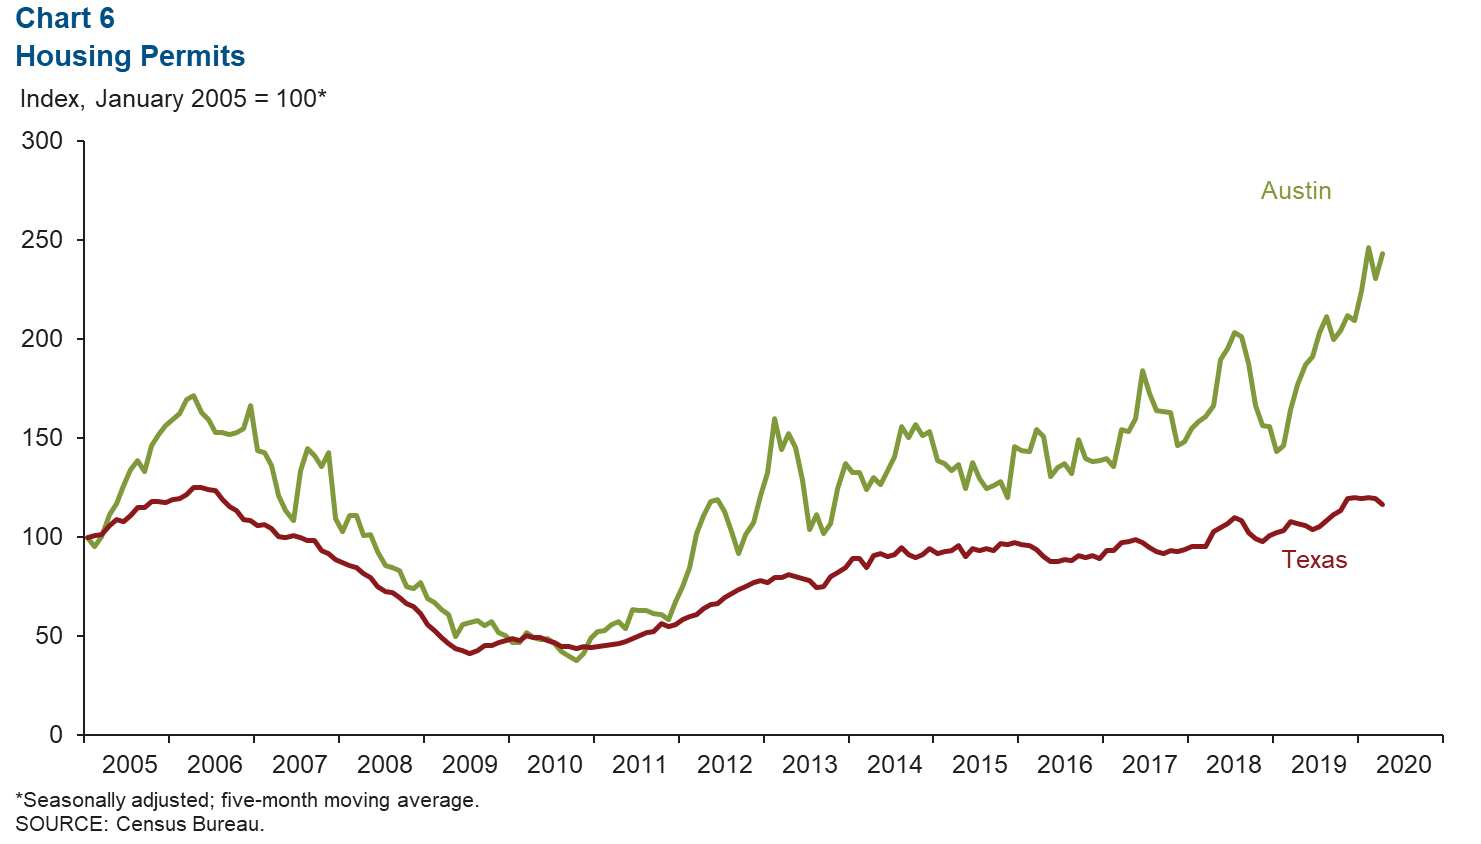
Local Home Construction Permits Rebound
The five-month moving average for aggregate single-family and multifamily construction permits in April climbed 5.5 percent in Austin but contracted 2.5 in Texas (Chart 6). Austin’s home inventory ticked up to 2.1 months, still considerably below the six months considered a balanced market.
NOTE: Data may not match previously published numbers due to revisions.
About Austin Economic Indicators
Questions can be addressed to Judy Teng at judy.teng@dal.frb.org. Austin Economic Indicators is released on the first Thursday of every month.