Austin Economic Indicators

July 3, 2020
The Austin economy continued to contract in May due to the impact of COVID-19. The Austin Business-Cycle Index continued to decline. While jobs and the unemployment rate improved in May, both remain significantly worse than in February. Consumer spending improved significantly from mid-April to mid-June in Travis County. Existing-home sales declined further in May, while building permits held steady.
Business-Cycle Index
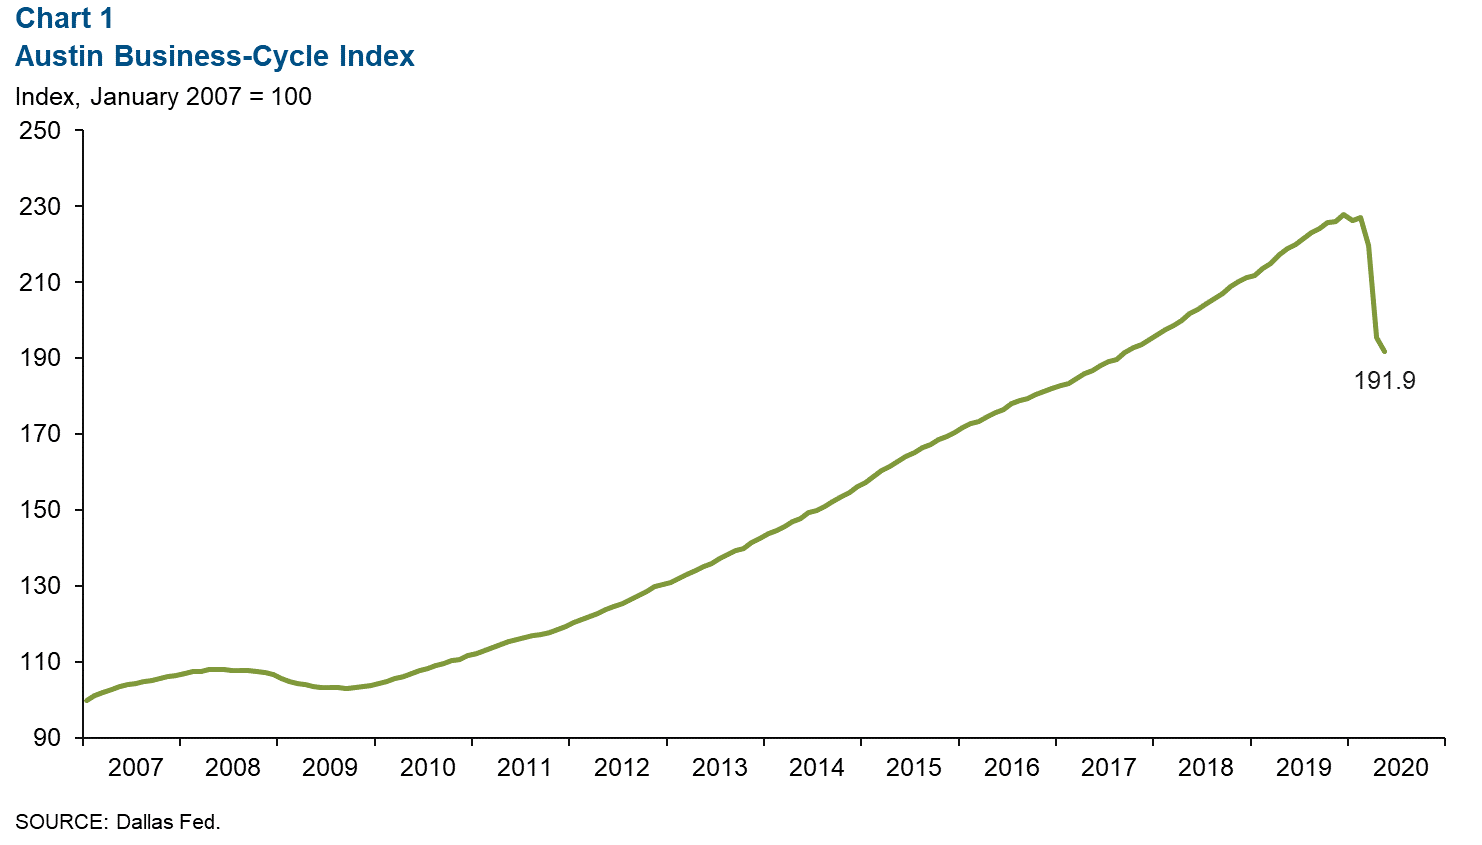
The Austin Business-Cycle Index—a broad measure of economic activity in the metro—fell an annualized 20.3 percent in May, suggesting a weak economic performance (Chart 1).
Labor Market
Unemployment Rate Falls
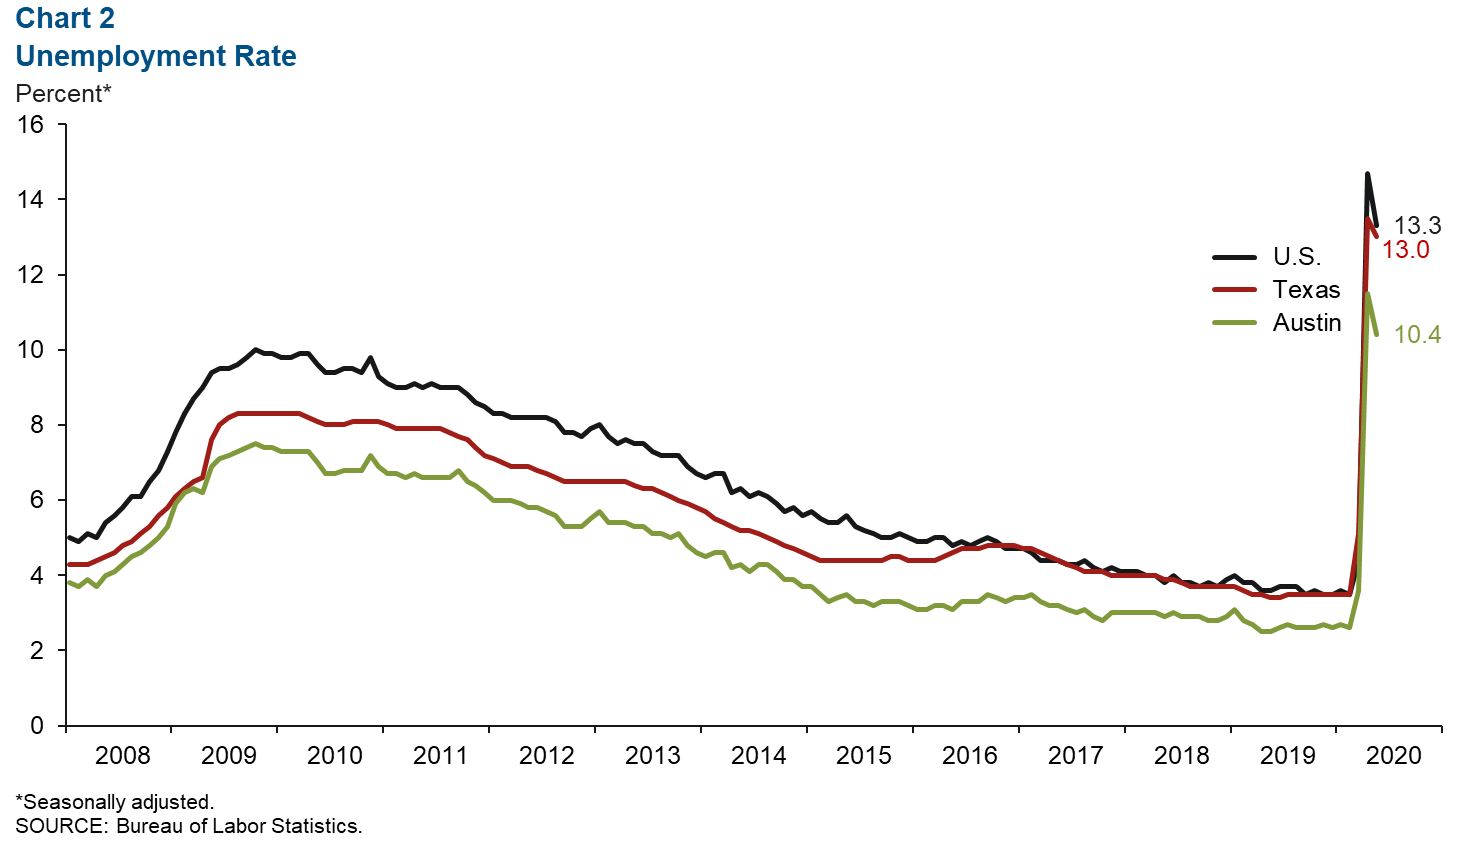
Austin’s unemployment rate declined to a still-elevated 10.4 percent in May (Chart 2). The unemployment rate in Texas and the U.S. ticked down to 13.0 percent and 13.3 percent, respectively.
Most Sectors Post Job Losses
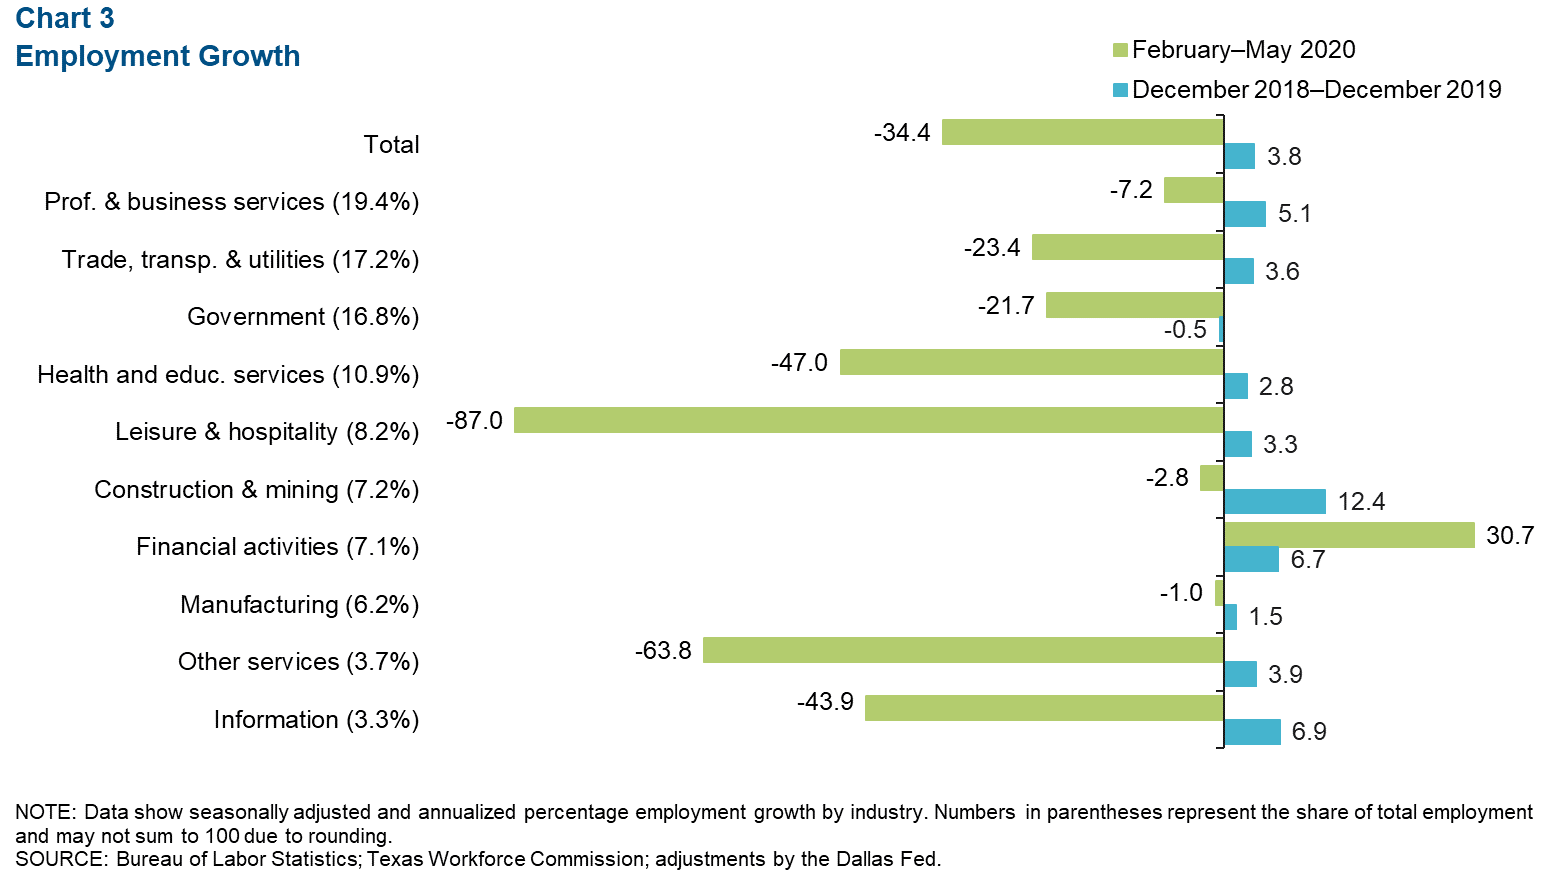
Austin jobs contracted an annualized 34.4 percent (-114,320 net jobs, nonannualized) in the three months ending in May (Chart 3). All sectors except financial activities experienced payroll losses during this period. Leisure and hospitality plunged 87.0 percent, shedding the most jobs (-56,000). It was followed by other services, such as automotive repair and barber shops, which fell 63.8 percent (-11,130). Health and private education services declined 47.0 percent (-19,300), and the information sector contracted 43.9 percent (-5,300). The financial activities industry saw a 30.7 percent gain, adding 4,750 jobs.
Consumer Spending
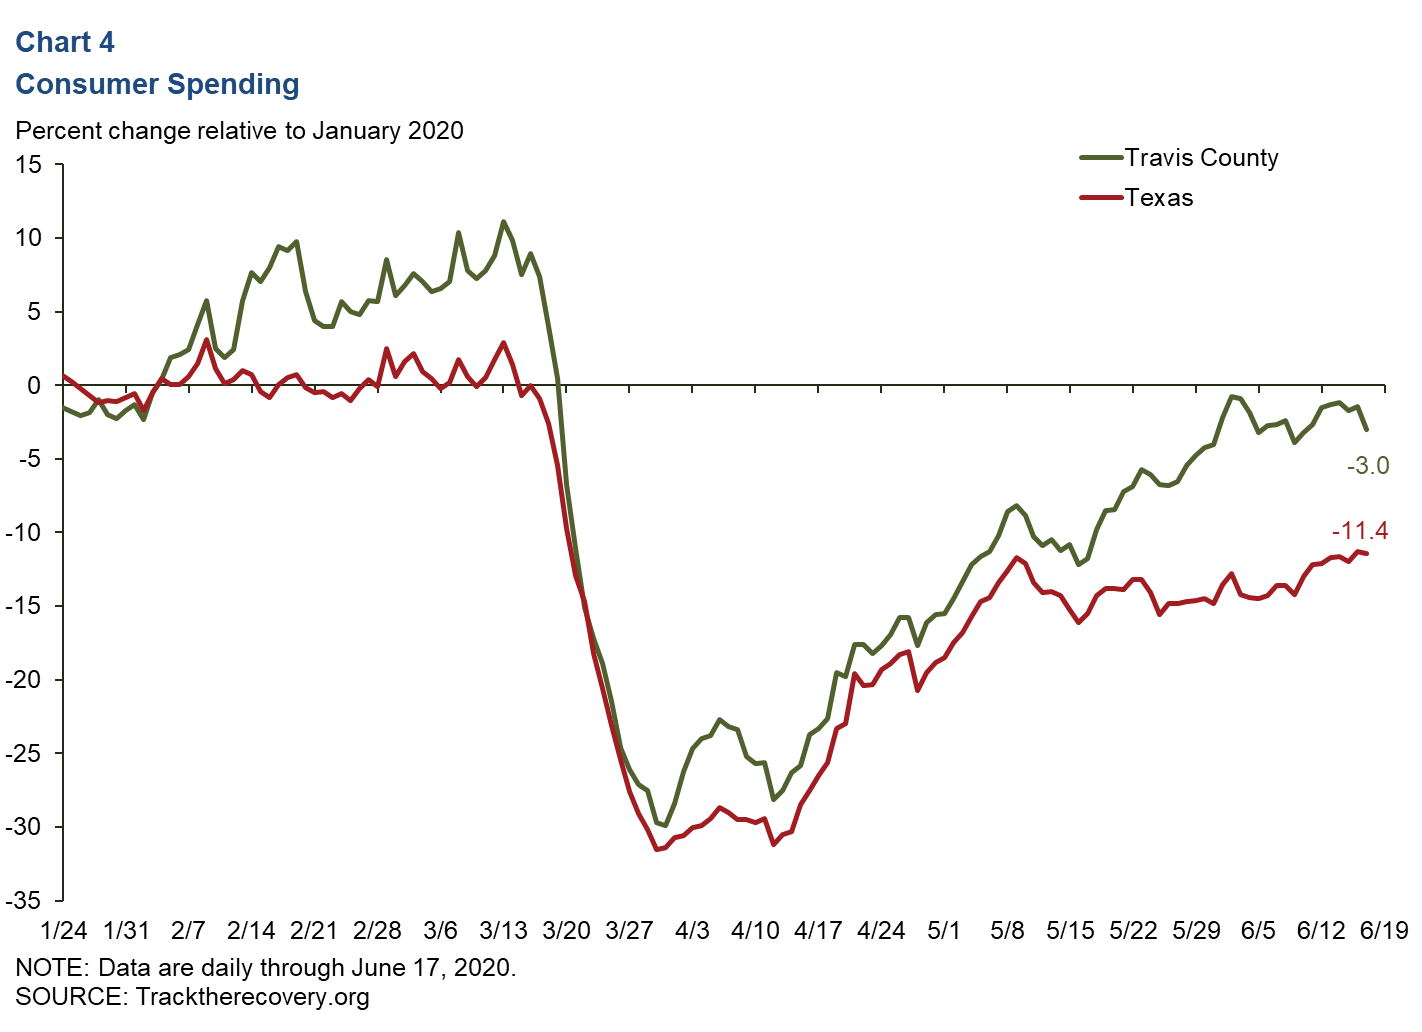
Consumer spending (measured by credit and debit card spending) in Travis County has improved significantly since early April and has increased more than in the state since early May. As of June 17, spending in the county was down only 3.0 percent since January 2020, whereas spending in Texas fell 11.4 percent during that time (Chart 4).
Real Estate
Recent Home Sales Decrease
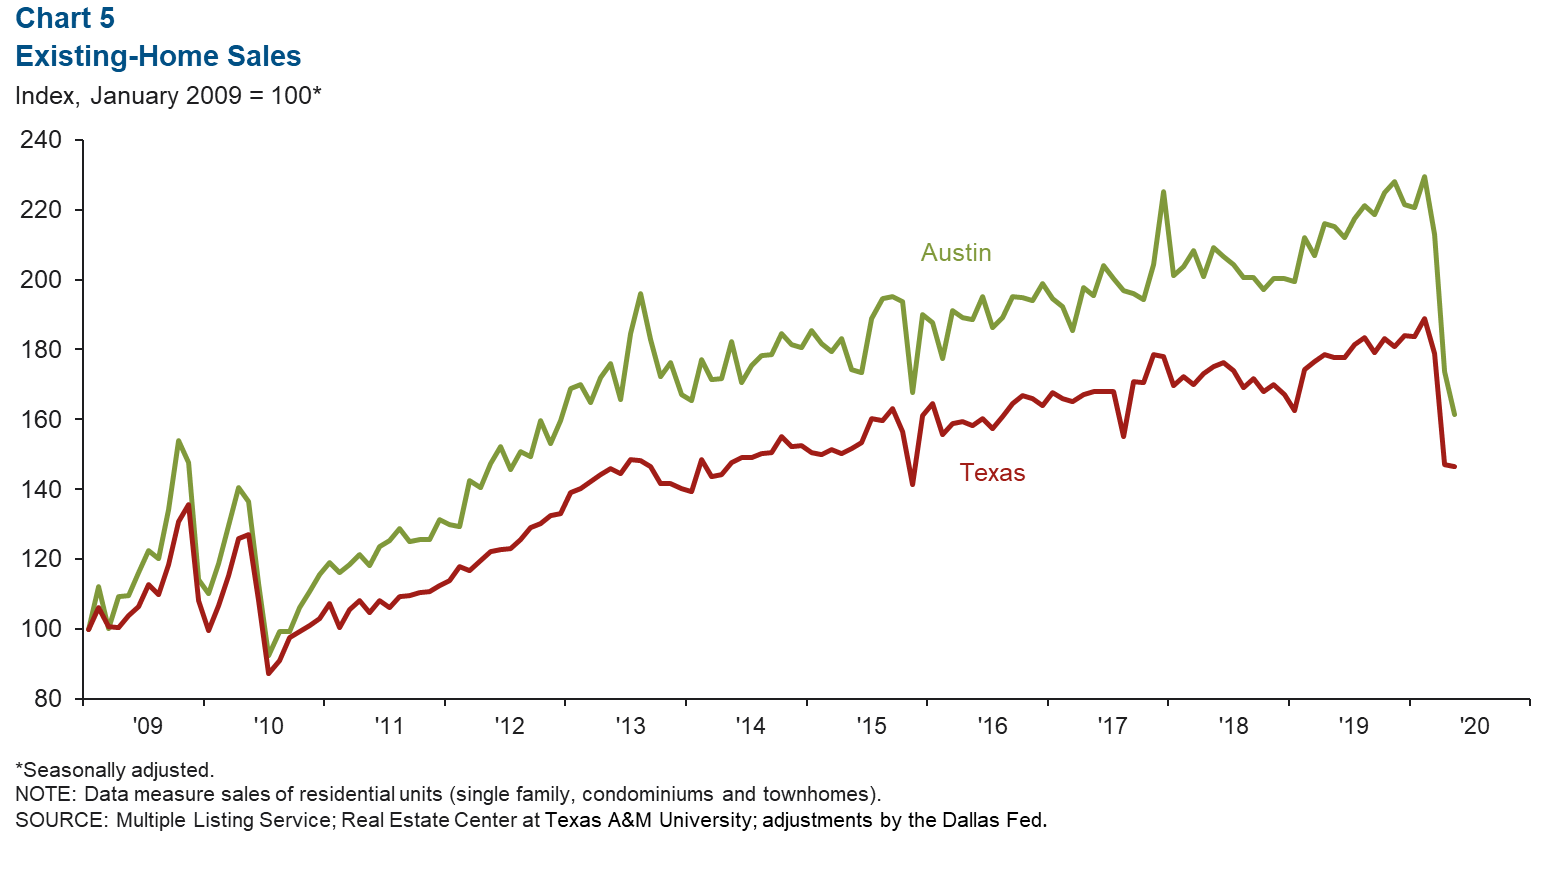
Existing-home sales in May declined 7.0 percent in the Austin area and 0.5 percent in the state (Chart 5). Austin home sales were down 4.9 percent during the first five months of this year relative to the same period in 2019, while Texas sales were down 2.8 percent. The median price of homes sold in May was $318,625 in Austin, a 1.0 percent gain year over year, compared with $240,379 in Texas, a 1.4 percent increase. The general increase in prices and low home inventories suggest that the decline in sales is likely due to fewer homes being put on the market relative to the number of buyers.
Local Home Construction Permits Hold Steady
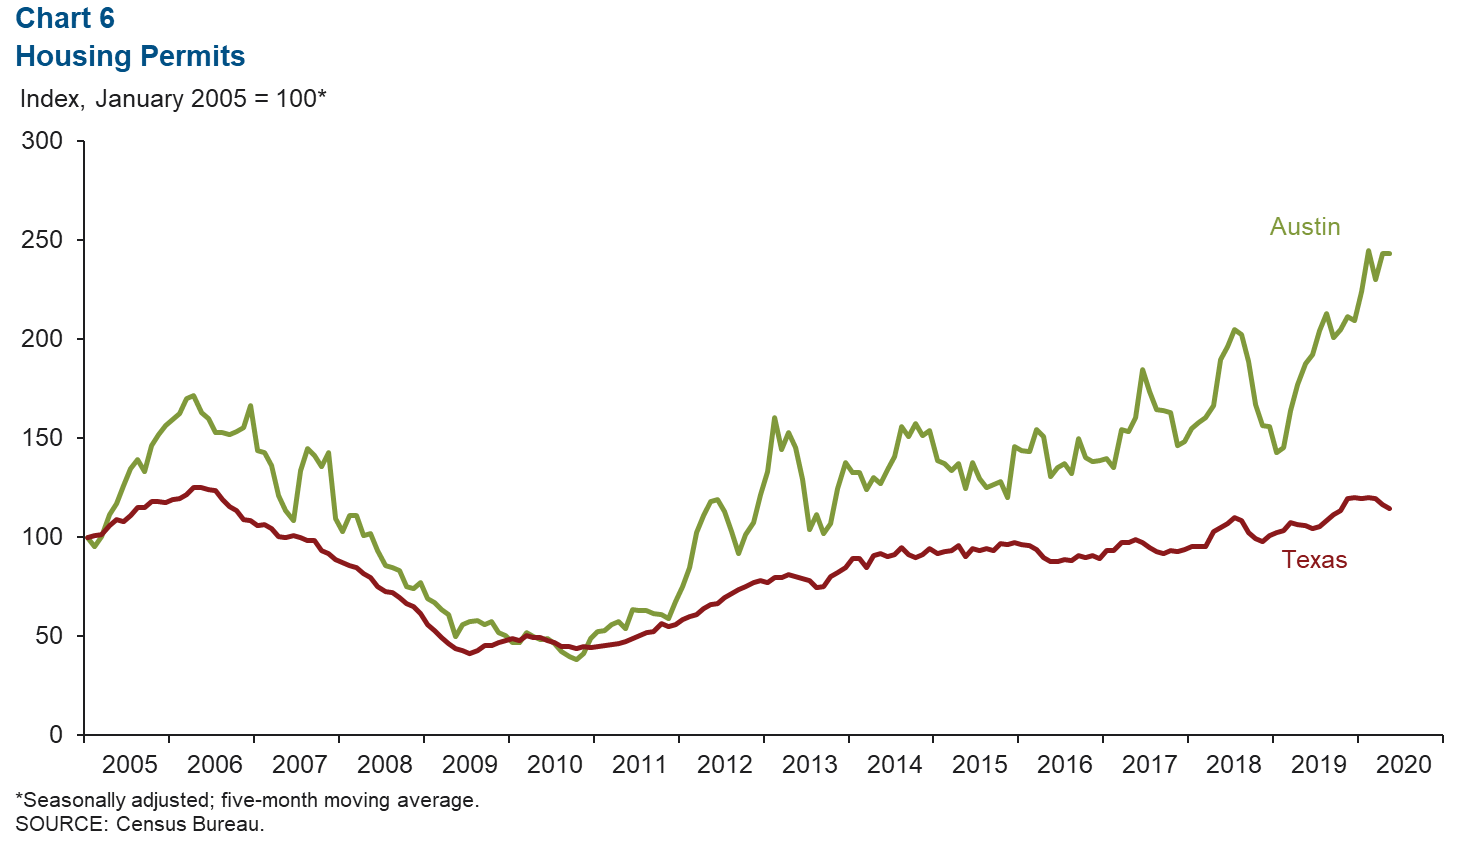
The five-month moving average for aggregate single-family and multifamily construction permits in Austin was unchanged from April to May but contracted 1.8 percent in Texas (Chart 6). Austin’s home inventory ticked down to 1.9 months, considerably below the six months considered to be a balanced market.
NOTE: Data may not match previously published numbers due to revisions.
About Austin Economic Indicators
Questions can be addressed to Judy Teng at judy.teng@dal.frb.org. Austin Economic Indicators is released on the first Thursday of every month.